Google 검색 실적 데이터는 Search Console에서 가장 많이 사용되는 데이터로, 실적 보고서와 검색 애널리틱스 API를 모두 사용합니다.
이 게시물에서는 지연 시간, 저장용량, 리소스 처리와 관련된 개인 정보 보호 필터링 및 기타 제한사항을 비롯하여 사용 가능한 데이터와 Google에서 데이터를 처리하는 방법을 자세히 설명합니다.
이 시스템 작동 방식이 궁금했던 적 없나요? 이번 기회에 자세히 알려드리겠습니다.
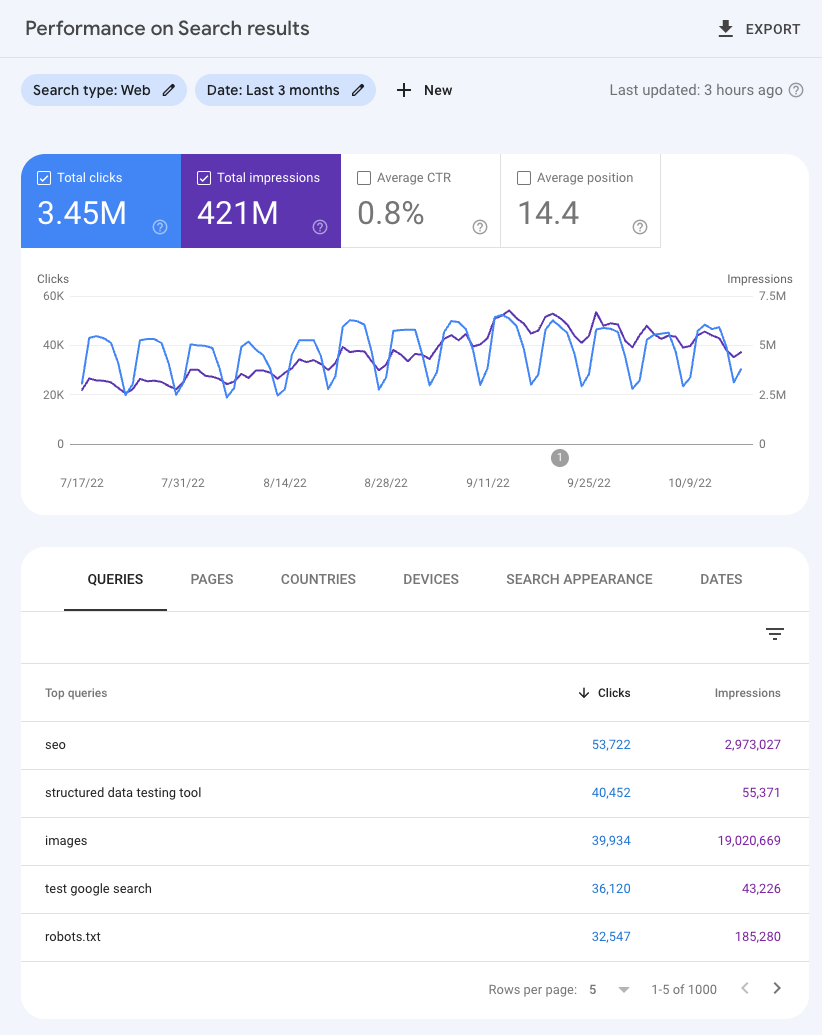
제품 인터페이스의 경우 필터를 사용할 수도 있고, 아래 이미지와 같이 차트 다음에 표시되는 측정기준 표를 통해서도 측정기준을 사용할 수 있습니다.
이 데이터를 사용하면 웹사이트를 사용자의 눈에 띄게 함으로써 궁극적으로는 Google에서 더 많은 트래픽을 얻을 수 있는 방법을 찾을 수 있습니다. 이 샘플 최적화 차트에서 어떤 유형의 분석을 진행할 수 있는지 보여주는 샘플을 확인하세요.
데이터 필터링 및 제한사항
보고서 인터페이스의 데이터 및 내보내기한 데이터는 서로 다른 방식으로 집계 및 필터링됩니다. 다음은 데이터와 관련된 두 가지 주요 제한사항인 개인 정보 보호 필터링과 일일 데이터 행 한도에 관한 설명입니다.
개인 정보 보호 필터링
일부 검색어('익명 검색어'라고 함)는 검색하는 사용자의 개인 정보를 보호하기 위해 Search Console 데이터에 포함되지 않습니다.
익명 검색어는 2~3개월 동안 많은 사용자(최대 수십 명 정도)가 사용하지 않은 검색어입니다. 개인 정보 보호를 위해 실제 검색어는 Google 검색 실적 데이터에 표시되지 않기 때문에
익명 검색어라고 부릅니다. 익명 처리된 실제 검색어는 표에서 항상 생략되지만, 검색어로 필터링하지 않는 한 차트 총계에는 포함됩니다.
예시를 보며 좀 더 자세히 알아보겠습니다. 이 예시에서는 개인 정보 보호 필터링만 고려하지만 다음 섹션에서 다룰 일일 데이터 행 한도도 영향을 미칠 수 있습니다. 아래에서 자세히 알아보세요. 아래 표에는 웹사이트 검색어의 모든 트래픽이 표시되며, 익명처리되지 않은 검색어의 트래픽이 항목별로 표시된다고 가정해 보겠습니다. 일반적인 웹사이트에는 일반적으로 항목별로 익명 검색어가 4개 이상 있지만 이 예시에서는 항목화된 검색어가 4개만 있다고 해 보겠습니다.
검색어
클릭수
고전문학
150
시
125
공상과학
100
비문학
75
항목별 검색어 총계
450
전체 총계
550
차트로 알 수 있듯이 항목별 검색어를 모두 더하면 클릭수가 450회입니다. 사이트에 대한 전체 클릭수도 550회입니다. 이 숫자가 더 큰 이유는 항목별 클릭수에 여기 표시되지 않은 익명 검색어의 클릭수가 더해지기 때문입니다.
실제로 Search Console 보고를 사용할 때 이러한 유형의 불일치가 크게 두 가지 형태로 나타날 수 있습니다.
보고서 표나 API에는 익명 검색어에 관한 행이 없으므로(여기서는 설명을 위해 추가됨) 모든 행의 클릭수를 합산해도 차트 총계 클릭수와 동일한 숫자가 나오지 않습니다. 예를 들어 이 경우 행을 전부 더하면 450이 표시되지만 차트 총계에는 550이 표시됩니다.
익명 검색어는 필터가 적용될 때마다 생략되므로 차트 총계의 클릭수 합계를 some_string은 포함되나 some_string은 포함하지 않는 클릭수의 합계와 비교하면 불일치가 발생합니다. 이 경우 '픽션'이라는 단어가 포함된 검색어만 포함하도록 필터를 사용하면 클릭수는 175회가 되며, '픽션'이라는 단어가 포함된 검색어를 제외하면 클릭수가 275회가 되므로 총 클릭수는 450회가 됩니다. 하지만 차트 총계에는 550회라고 표시됩니다.
일일 데이터 행 한도
게재 지연 시간, 저장용량, 처리 리소스 등과 관련된 제한사항으로 인해 Search Console에서는 표시하거나 내보낼 수 있는 데이터의 양을 제한합니다. 이러한 제한사항은 Search Console에서 대부분의 속성에 영향을 주지 않습니다. 일부 대규모 웹사이트는 이러한 제한사항으로 인해 영향을 받을 수 있지만, 그럼에도 불구하고 이러한 웹사이트에서도 제한사항이 적용된 후의 데이터가 데이터의 대표 샘플을 생성하기에 충분할 것으로 예상됩니다.
Search Console 사용자 인터페이스를 통해 내보낼 수 있는 데이터 상한은 1,000행입니다.
현재 Search Analytics API 및 Looker Studio 커넥터를 통해 내보낼 수 있는 데이터 상한은 검색 유형별로 사이트당 일일 50,000행이지만, 일부는 지원되지 않을 수 있습니다. API에서 반환하는 기본값은 1,000행이지만 rowLimit을 사용하여 기본값을 25, 000행까지 늘릴 수 있고, startRow를 사용해 25,001행~50,000행을 가져올 수 있습니다. 이 가이드에서 사용 가능한 데이터를 가져오는 방법을 알아보세요.
국가, 기기, 검색 노출과 같이 검색어 또는 URL 측정기준과 관련되지 않은 요청의 경우 Search Console은 모든 데이터를 표시하고 내보냅니다.
리소스 및 의견
이 주제에 관해 자세히 알아보려면 실적 문서를 참고하세요.
사용 가능한 데이터, 실적 보고서 사용 방법, 차트에서 발생할 수 있는 불일치에 대한 자세한 설명을 확인할 수 있습니다.
[[["이해하기 쉬움","easyToUnderstand","thumb-up"],["문제가 해결됨","solvedMyProblem","thumb-up"],["기타","otherUp","thumb-up"]],[["필요한 정보가 없음","missingTheInformationINeed","thumb-down"],["너무 복잡함/단계 수가 너무 많음","tooComplicatedTooManySteps","thumb-down"],["오래됨","outOfDate","thumb-down"],["번역 문제","translationIssue","thumb-down"],["샘플/코드 문제","samplesCodeIssue","thumb-down"],["기타","otherDown","thumb-down"]],[],[[["\u003cp\u003eGoogle Search Console's Performance report provides data on clicks, impressions, CTR, and position to analyze website search traffic.\u003c/p\u003e\n"],["\u003cp\u003eSearch performance data can be accessed via the product interface, Search Analytics API, Looker Studio Connector, and manual spreadsheet downloads.\u003c/p\u003e\n"],["\u003cp\u003eData is subject to privacy filtering, meaning some queries are anonymized to protect user privacy and may lead to discrepancies in total click counts.\u003c/p\u003e\n"],["\u003cp\u003eA daily data row limit exists for exported data, capped at 1,000 rows via the user interface and 50,000 via the API or Looker Studio Connector.\u003c/p\u003e\n"],["\u003cp\u003eComprehensive resources and support are available through Google Search Central Community and Twitter for further assistance.\u003c/p\u003e\n"]]],["Google Search Console's Performance report provides data on clicks, impressions, CTR, and position, which can be analyzed across queries, pages, countries, devices, and search appearances. Access is available through the interface, API, Looker Studio, and spreadsheets. Data is filtered for user privacy, omitting anonymized queries from tables but including them in totals, and has limits of 1,000 rows via the interface or up to 50,000 via API per day.\n"],null,["# A deep dive into Search Console performance data filtering and limits\n\nWednesday, October 19, 2022\n\n\nGoogle Search performance data is the most widely used data in Search Console, both through the\n[Performance report](https://support.google.com/webmasters/answer/7576553)\nand the [Search Analytics API](/webmaster-tools/v1/searchanalytics/query).\nThis post explains in detail the data available and how Google processes it, including privacy\nfiltering and other limitations related to serving latency, storage, and processing resources.\nEver wonder how these systems work? Let's do a deep dive\ninto them.\n\n\nIf you're new to Search Console, check out the [introduction to Performance reports](https://support.google.com/webmasters/answer/10268906).\n\nSearch performance basics\n-------------------------\n\n\nThe Performance report contains four metrics that show how your search traffic changes over time.\nWe have an article describing [how each metric is calculated](https://support.google.com/webmasters/answer/7042828),\nand here's a summary:\n\n- Clicks: Count of user clicks from Google Search results to your property.\n- Impressions: Count of times users saw your property on Google search results.\n- CTR (Click-through rate): The click count divided by the impression count.\n- Position: The average position in search results for the URL, query, or for the website in general.\n\n\nEach of those metrics can be analyzed for different dimensions. You can check how each of the queries,\npages, countries, devices, or search appearances driving traffic to your website is performing.\n\n\nThere are many ways to access the Search performance data, including the\n[product interface](https://search.google.com/search-console/performance/search-analytics),\nthe [Search Analytics API](/webmaster-tools/v1/searchanalytics/query),\nthe [Looker Studio connector](/search/blog/2022/03/connecting-data-studio),\nand spreadsheets (requires manual download from the interface).\n\n\nIf you're using the product interface, the dimensions are available through the filters or through\nthe dimensions tables following the chart, as shown in the image below.\n\n\nThis data can be used to find ways to make your website more visible and ultimately get more traffic\nout of Google. For a sample of what type of analysis you can perform, check this\n[sample optimization chart](/search/blog/2022/04/performance-optimization-bubble-chart).\n\nData filtering and limits\n-------------------------\n\n\nBoth the data in the report interface and the data exported are aggregated and filtered in different\nways. Below are the two main limitations to the data: privacy filtering and daily data row limit.\n\n### Privacy filtering\n\n\nSome queries (called anonymized queries) are not included in Search Console data to protect the\nprivacy of the user making the query.\n\n\nAnonymized queries are those that aren't issued by more than a few dozen users over a two-to-three\nmonth period. To protect privacy, the actual queries won't be shown in the Search performance data.\nThis is why we refer to them as anonymized queries. While the actual anonymized queries are always\nomitted from the tables, they are included in chart totals, unless you filter by query.\n\n\nLet's look at an example to make it clearer - note that this is an illustration that takes into\naccount only privacy filtering, but daily data row limits, discussed in the next section, may also\nplay a role, read on to learn more. Let's say the table below shows all the traffic for queries to\nyour website, itemizing the traffic from non-anonymized queries. A typical website will generally\nhave more than four itemized non-anonymized queries, of course, but for purposes of this example,\nwe'll say it's just four that are itemized.\n\n|------------------------------|------------|\n| **Queries** | **Clicks** |\n| classic literature | 150 |\n| poetry | 125 |\n| science fiction | 100 |\n| non fiction | 75 |\n| *Total for itemized queries* | *450* |\n| *Total overall* | *550* |\n\n\nIf you add up all the itemized queries, as the chart shows, there were 450 clicks. There are also\n550 overall clicks to the site. That number is higher because it includes all the itemized clicks\nplus the clicks from anonymized queries, which aren't listed.\n\n\nIn practice, when using Search Console reporting, you may notice this type of discrepancy in two main ways.\n\n1. There is no row for anonymized queries in the report table or API (added here for illustration purposes), so if you sum up clicks for all the rows, you'll not find the same number of clicks as the chart totals. For example in this case you'd see 450 when you sum up the rows, but you'd see 550 in the chart totals.\n2. The anonymized queries are omitted whenever a filter is applied, so there will be a discrepancy if you compare the sum of clicks in the chart totals to the sum of clicks containing `some_string` and not containing `some_string`. In this case, if you use filters to include only queries that contain the word \"fiction\", you'll see 175 clicks, and if you exclude queries that contain the word \"fiction\", you'll see 275 clicks, summing up to 450 clicks, while in the chart total you'll see 550 clicks.\n\n### Daily data row limit\n\n\nDue to limitations related to serving latency, storage, processing resources, and others, Search\nConsole has a limit on the amount of data that can be displayed or exported. These limits won't affect\nthe majority of properties in Search Console. A few very large websites can be affected by this, but\neven for those we believe the remaining data will be large enough to create a representative sample of data.\n\n\nThe maximum you can export through the Search Console user interface is 1,000 rows of data.\nCurrently, the upper limit for the data exported through the [Search Analytics API](/webmaster-tools/v1/searchanalytics/query)\n(and through the [Looker Studio connector](/search/blog/2022/03/connecting-data-studio))\nis 50,000 rows per day per site per search type, which may not be reached in all cases. The default\nreturned by the API will be 1,000 rows, but you can use `rowLimit` to increase it to 25,000\nand `startRow` to pull the rows 25,001 to 50,000 using pagination. Check this guide to\nlearn [how to get the available data](/webmaster-tools/v1/how-tos/all-your-data).\n\n\nFor requests that don't involve query or URL dimensions, such as countries, devices, and Search\nAppearances, Search Console will display and export all the data.\n\nResources and feedback\n----------------------\n\n\nIf you'd like to learn more about the subject, read the [Performance documentation](https://support.google.com/webmasters/answer/7576553).\nYou'll find in-depth explanations about the available data, how to use the Performance report, and more\ndetails about discrepancies you may find in the charts.\n\n\nIf you have any questions or concerns, please reach out to us via the\n[Google Search Central Community](https://support.google.com/webmasters/threads?thread_filter=(category:search_console))\nor on [Twitter](https://twitter.com/googlesearchc).\n\nPosted by [Daniel Waisberg](https://www.danielwaisberg.com), Search Advocate"]]