Friday, December 04, 2009
Let's take a quick look at the individual sections in the Google Webmaster Tools' Site Performance feature:
Performance overview
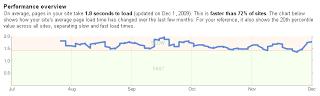
The performance overview shows a graph of the aggregated speed numbers for the website, based on the pages that were most frequently accessed by visitors who use the Google Toolbar with the PageRank feature activated. By using data from Google Toolbar users, you don't have to worry about us testing your site from a location that your users do not use. For example, if your site is in Germany and all your users are in Germany, the chart will reflect the load time as seen in Germany. Similarly, if your users mostly use dial-up connections (or high-speed broadband), that would be reflected in these numbers as well. If only a few visitors of your site use the Google Toolbar, we may not be able to show this data in Webmaster Tools.
The line between the red and the green sections on the chart is the 20th percentile—only 20% of the sites we check are faster than this. This website is pretty close to the 20% mark, which pages would we have to work on first?
Example pages with load times
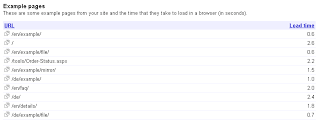
In this section you can find some example pages along with the average, aggregated load times that users observed while they were on your website. These numbers may differ from what you see as they can come from a variety of different browsers, internet connections and locations. This list can help you to recognize pages which take longer than average to load—pages that slow your users down.
As the page load times are based on actual accesses made by your users, it's possible that it includes pages which are disallowed from crawling. While Googlebot will not be able to crawl disallowed pages, they may be a significant part of your site's user experience.
Keep in mind that you may see occasional spikes here, so it's recommended that you watch the load times over a short period to see what's stable. If you consistently see very large load times, that probably means that most of your users are seeing very slow page loads (whether due to slow connections or otherwise), so it's something you should take seriously.
Page Speed suggestions
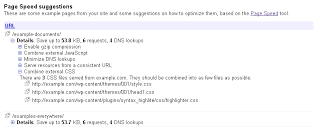
These suggestions are based on the
Page Speed
Firefox / Firebug plugin. In order to find the details for these sample URLs, we fetch the page
and all its embedded resources with Googlebot. If we are not able to fetch all of embedded content
with Googlebot, we may not be able to provide a complete analysis. Similarly, if the servers
return slightly modified content for Googlebot than they would for normal users, this may affect
what is shown here. For example, some servers return uncompressed content for Googlebot, similar
to what would be served to older browsers that do not support gzip-compressed embedded content
(this is currently the case for Google Analytics' ga.js).
When looking at flagged issues regarding common third-party code such as website analytics scripts, one factor that can also play a role is how wide-spread these scripts are on the web. If they are common across the web, chances are that the average user's browser will have already cached the DNS lookup and the content of the script. While these scripts will still be flagged as separate DNS lookups, in practice they might not play a strong role in the actual load time.
We offer these suggestions as a useful guideline regarding possible first performance improvement steps and recommend using the Page Speed plugin (or a similar tool) directly when working on your website. This allows you to better recognize the blocking issues and makes it easy to see how modifications on the server affect the total load time.
For questions about Webmaster Tools and this new feature, you can read the Help Center article, search and post in the Webmaster Help Forums or in the Page Speed discussion group. We hope this information helps you make your website even faster!