Debugging drops in Google Search traffic
A drop in organic Search traffic can happen for several reasons, and it may not be straightforward to understand what exactly happened to your site. This guide explains how to use the Search Console Performance report and Google Trends to investigate the reasons for a drop in Search traffic and how to address it.
Main causes for drops in organic Search traffic
To get an idea of what is affecting your Search traffic, check the sketches in the image. They show roughly what could potentially affect your traffic and how your graph shape would look like.
The following sections cover the main causes you should investigate when analyzing a traffic drop. Also make sure to check the Search Console Data Anomalies page to see if there is anything applicable to your site. The drop might be related to a change in the data processing or a logging error.
Algorithmic update
Google is always improving how it assesses content and updating its search ranking and serving algorithms accordingly; core updates and other smaller updates may change how some pages perform in Google Search results. We post about notable improvements to our systems on our list of ranking updates page; check it to see if there's anything that's applicable to your site.
If you suspect a drop in traffic is due to an algorithmic update, it's important to understand that there might not be anything fundamentally wrong with your content. To determine whether you need to make a change, review your top pages in Search Console and assess how they were ranking:
- Small drop in position? For example, dropping from position 2 to 4.
- Large drop in position? For example, dropping from position 4 to 29.
Small drop in position
A small drop in position is when there's a small shift in position in the top results (for example, dropping from position 2 to 4 for a search query). In Search Console, you might see a noticeable drop in traffic without a big change in impressions.
Small fluctuations in position can happen at any time (including moving back up in position, without you needing to do anything). In fact, we recommend avoiding making radical changes if your page is already performing well.
Large drop in position
A large drop in position is when you see a notable drop out of the top results for a wide range of terms (for example, dropping from the top 10 results to position 29).
In cases like this, self-assess your whole website overall (not just individual pages) to make sure it's helpful, reliable and people-first. If you've made changes to your site, it may take time to see an effect: some changes can take effect in a few days, while others could take several months. For example, it may take months before our systems determine that a site is now producing helpful content in the long term. In general, you'll likely want to wait a few weeks to analyze your site in Search Console again to see if your efforts had a beneficial effect on ranking position.
Technical issues
Technical issues are errors that can prevent Google from crawling, indexing, or serving your pages to users. For example, server availability, robots.txt fetching, "page not found", and others.
Note that the issues can be site-wide (for example, your website is down) or page-wide (for
example, a misplaced noindex tag, which would depend on Google crawling the page,
meaning there would be a slower drop in traffic).
Check the Crawl stats report and Page indexing report to find if there's a corresponding spike in issues detected, this might help you pinpoint the problem.
Security issues
If your site is affected by a security threat, like malware or phishing, Google may alert users before they reach your site with warnings or interstitial pages, which may decrease Search traffic.
Check the Security Issues report to find if Google detected a security threat on your website.
Spam issues
Google detects practices that violate Google Search spam policies both through automated systems and, as needed, human review that can result in a manual action. If your site doesn't comply with the Spam policies for Google web search, your content might rank lower in results or not appear in results at all.
If you suspect a drop due to a spam violation, review our spam policies to ensure you're not engaging in spam practices that our automated systems would detect. Also, check the Manual Actions report on Search Console to see if any have been issued to your website.
Seasonality and changing interests
Sometimes changes in user behavior will change the demand for certain queries, either due to a new trend, or seasonality throughout the year. This means your traffic may drop as a result of external influences.
Find queries that saw a drop in clicks and impressions using the Performance report by applying a filter to include only a query at a time (choose the queries that receive the most traffic); then, check them on Google Trends to understand if the drop was only for your website or throughout the web.
Site moves and migrations
If you change the URLs of existing pages on your site, you may experience ranking fluctuations while Google recrawls and reindexes your site. As a general rule, a medium-sized website can take a few weeks for Google to notice the change; larger sites can take longer.
If you see a drop after moving and it's not recovering, check the site move troubleshooting section for common mistakes when migrating a site with URL changes.
Analyze your Search traffic drop pattern
The best way to understand what happened to your traffic is to look at the main chart in your Search Console Performance report, as it summarizes a lot of information.
If both impressions and clicks dropped, check the list of the most common reasons that could have caused it. If your impressions remain the same but your clicks drop, you might not be generating the best page title and snippet that you could, and so users don't understand the content of your page, or perhaps other sites had a more appealing rich result.
Visit the Search Performance report and try applying filters to your data as discussed in the following sections.
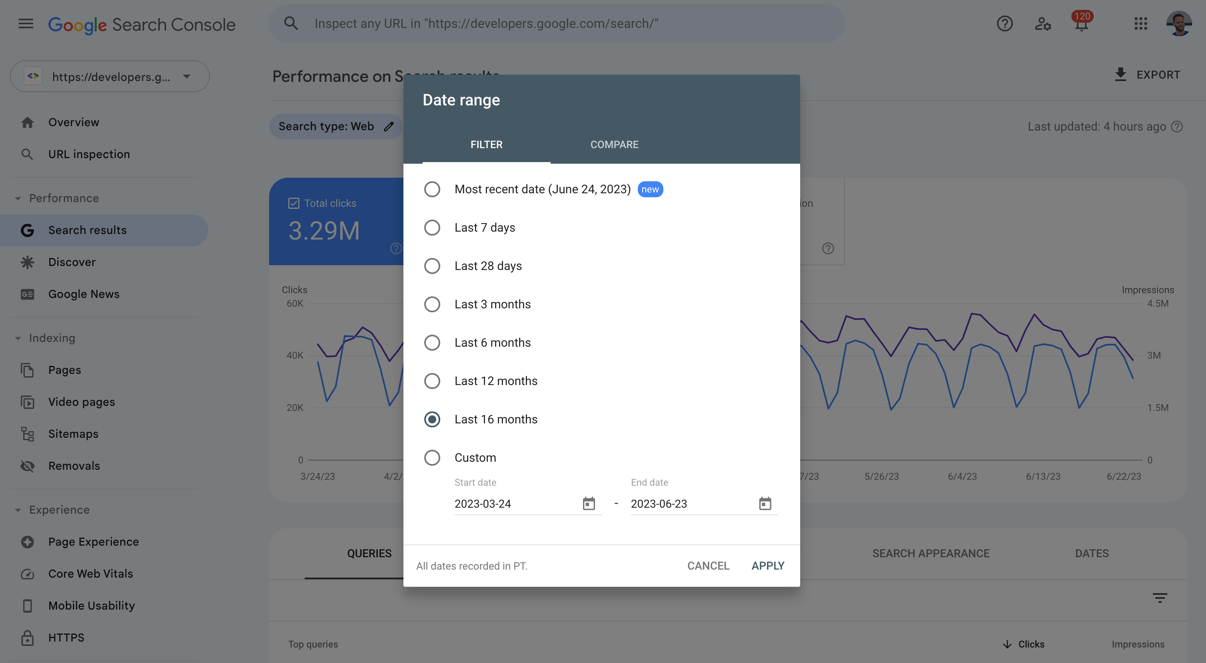
Change the date range to include 16 months
Choose the Date filter on top of the chart and select Last 16 months. This will help you analyze the traffic drop in context and make sure it's not a drop that happens every year due to a festivity or a trend. If you'd like to extend the 16 months, you could use the Search Analytics API or bulk data exports to pull data and store it in your systems.
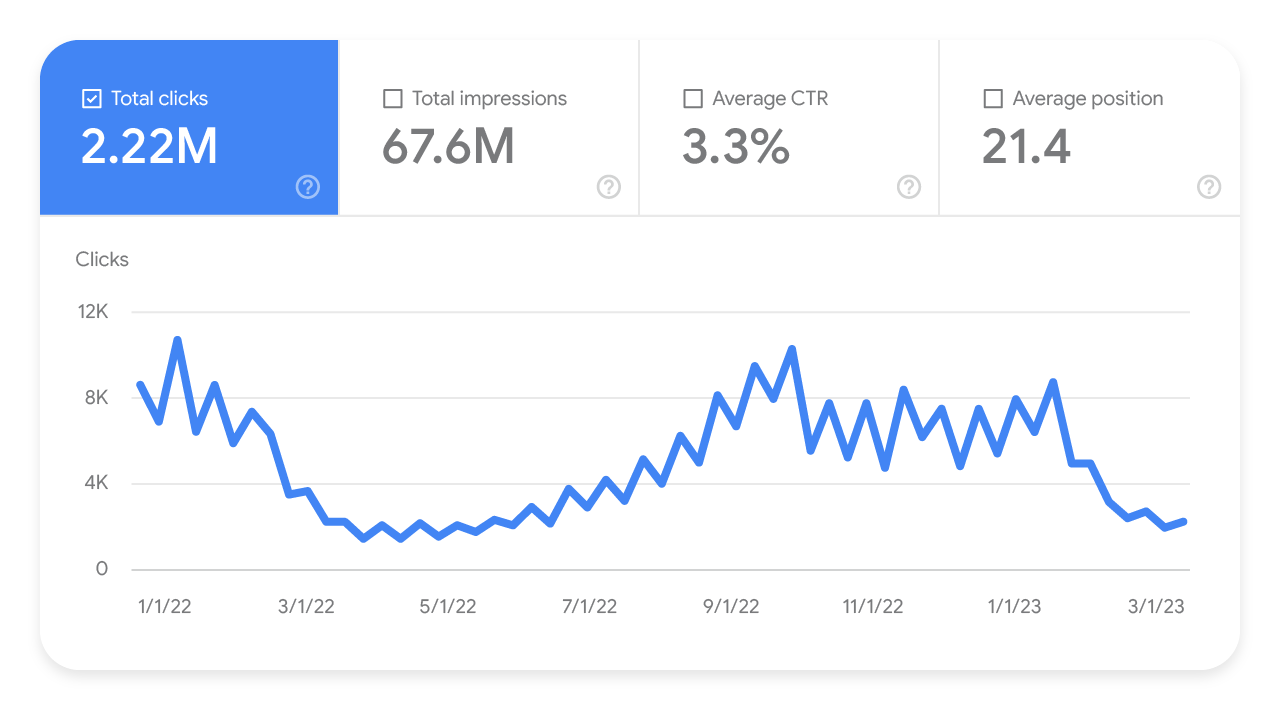
The following chart shows a Performance chart with yearly seasonality (16 months of data). Notice how the recent drop happened exactly as it did the previous year.
Compare the drop period to a similar period
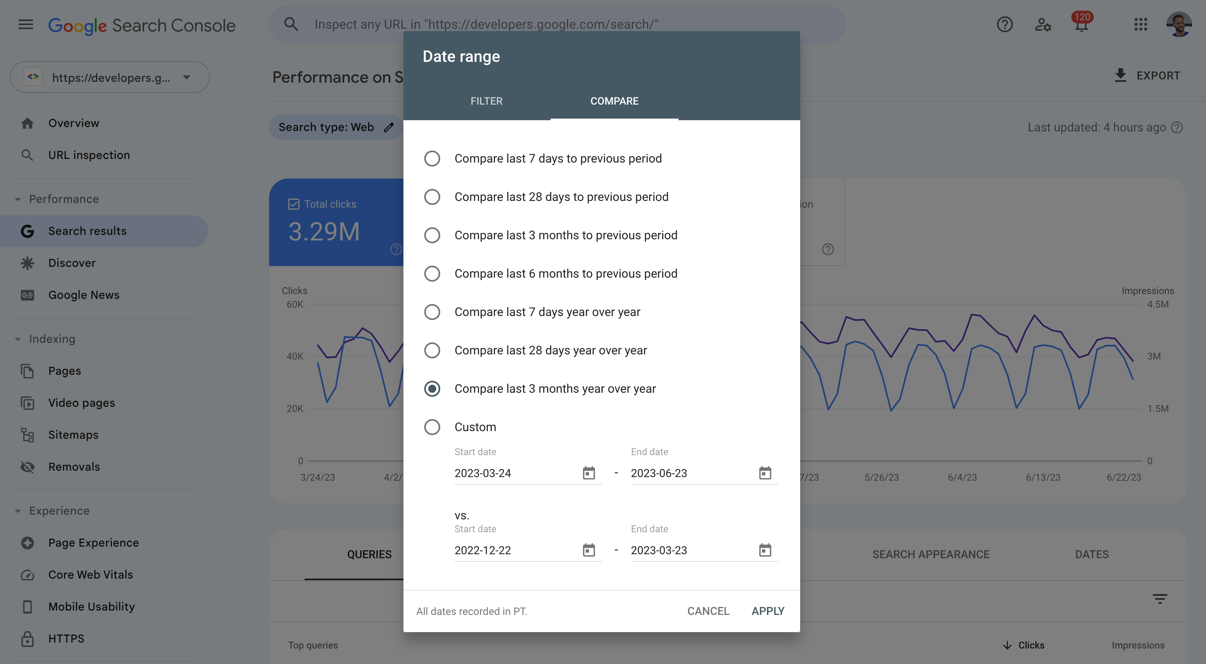
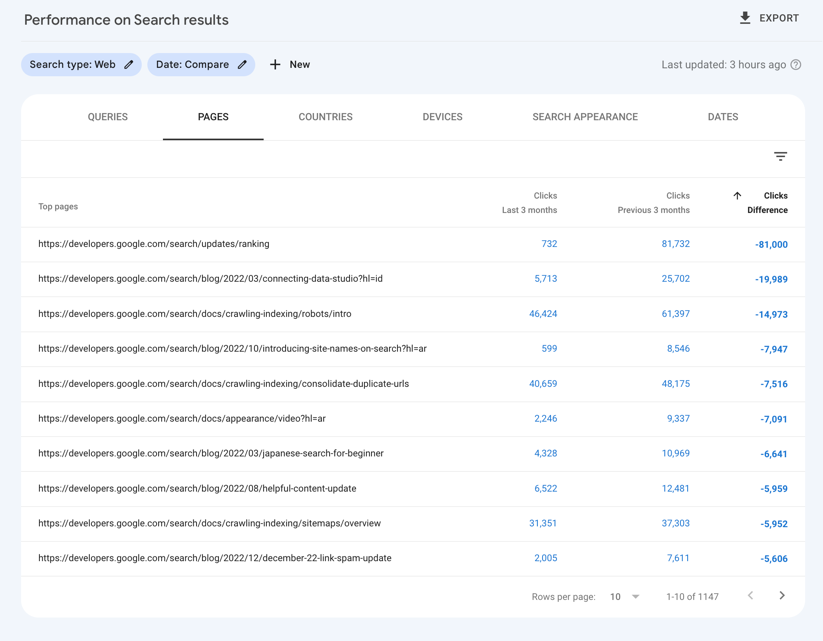
Choose the Date filter on top of the chart, select the Compare tab, and then Compare last 3 months to previous period or Compare last 3 months year over year. This will help you review what exactly changed. Make sure to click all tabs to find out if the change happened only for specific queries, URLs, countries, devices, or search appearances (learn how to create a comparison filter).
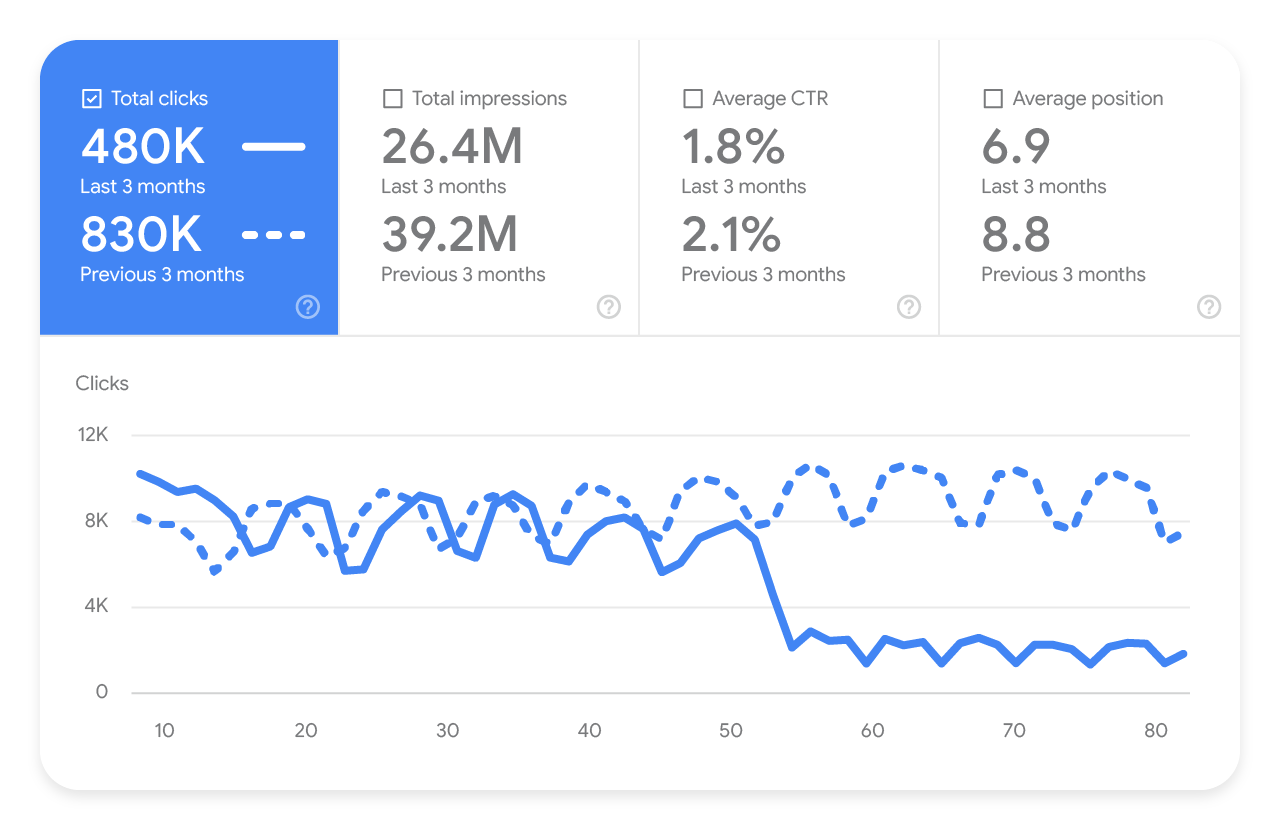
The following chart shows a three month comparison Performance chart. Notice how the drop in traffic is clear when comparing the full line (last three months) to the dotted line (previous three months).
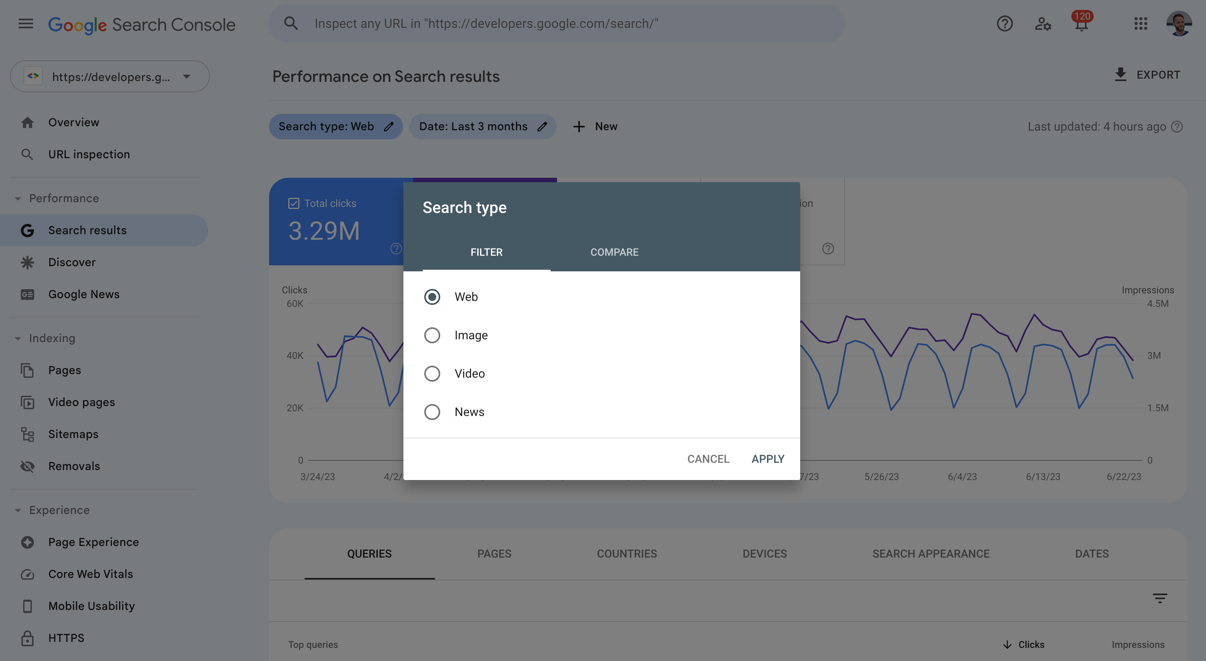
Analyze different search types separately
Choose the Search type filter on top of the chart and try the different options available. This will help you understand whether the drop you've seen happened in web Search, Google Images, or the Video or News tab.
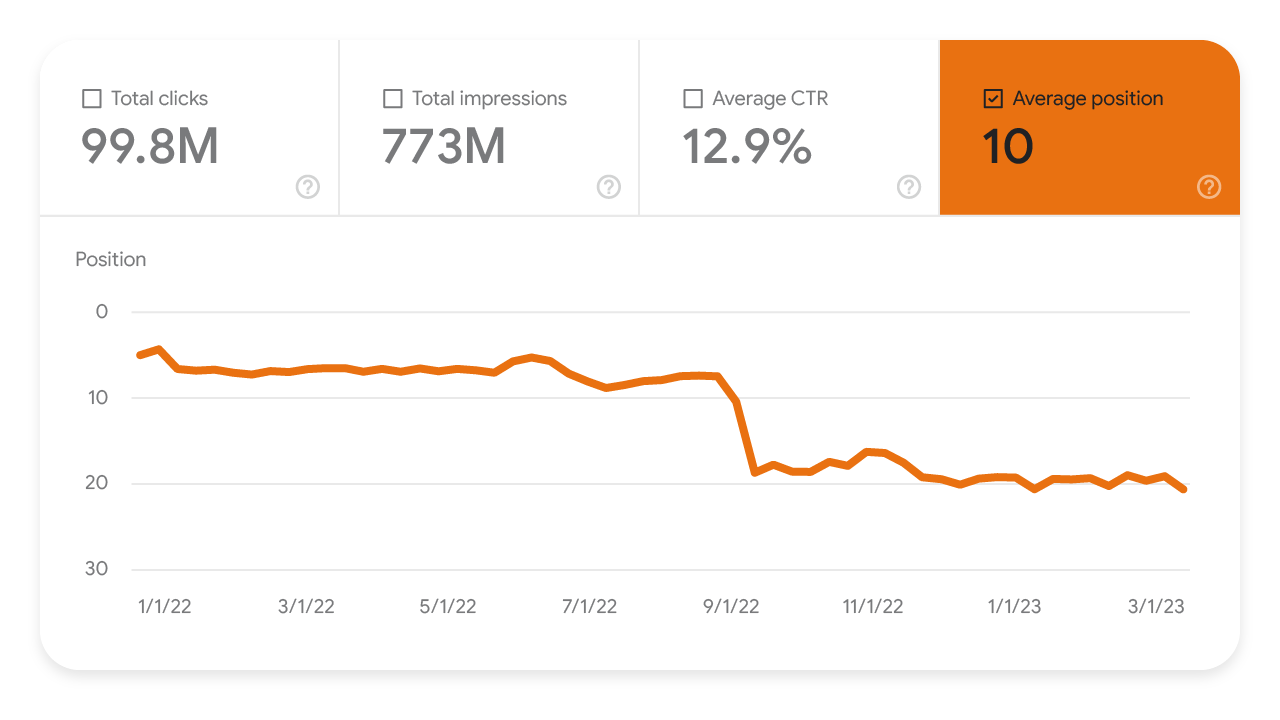
Monitor your average position in search results
Click Average position above the chart. In general, you shouldn't focus too much on your absolute position. Impressions and clicks are ultimately the measure of success for your site. However, if you do see a dramatic, persistent drop in position, try self-assessing your content to gauge if it's helpful and reliable.
Look for patterns in the pages affected
Review the Pages table below the chart to find patterns that might explain where the drop is coming from. For example, one important factor is finding out if the drop happened across the whole site, a group of pages, or even just one very important page in your site. You can do that by comparing the drop period to a similar period, and comparing the pages that lost a significant amount of clicks. Select Clicks Difference to order it based on pages that lost the most traffic.
If it's a site-wide issue, check the Page indexing report. If the drop only affects a group of pages, use the URL inspection tool to investigate a few pages.
Investigate overall trends in your industry
If you want to go the extra mile, you can use Google Trends to understand whether the drop is a wider trend or if it's just happening for your site. These changes can be caused by two main factors:
- Changing interests. If there are major changes in what and how people search, people may start searching for different queries, or using their devices for different purposes. In addition, if you sell a specific brand online, there might be new products for the same search queries.
- Seasonality. For example, the rhythm of food website shows that food related queries are very seasonal: people search for diets in January, turkey in November, and champagne in December. Different industries have different levels of seasonality.
To analyze trends in different industries, you can use Google Trends, which provides access to a largely unfiltered sample of actual search requests made to Google. It's anonymized, categorized, and aggregated. This allows Google to display interest in topics from around the globe or down to city-level.
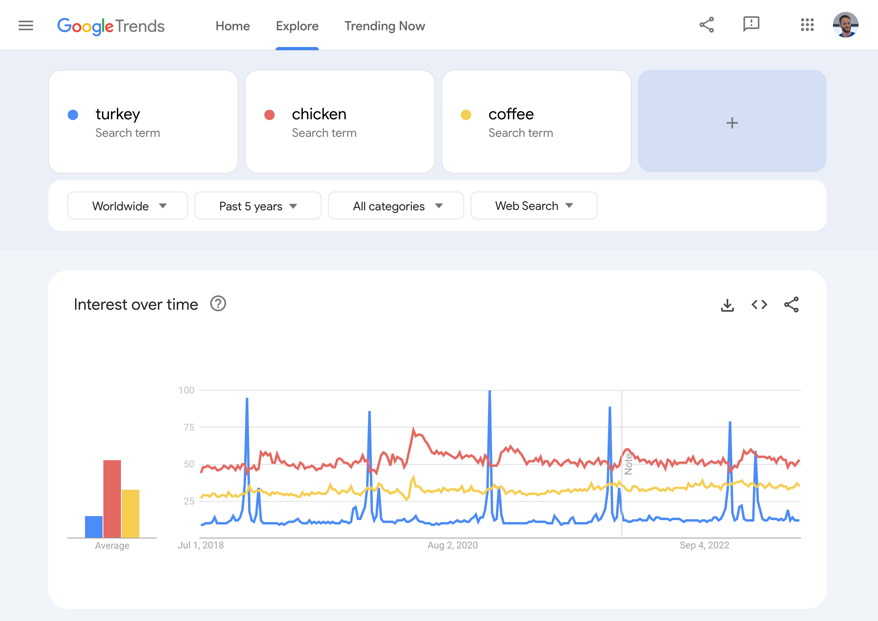
Check the queries that are driving traffic to your website to see if they have clear drops in different times of the year. In this example, you can see three types of trends (check the data):
- Turkey has a strong seasonality, peaking every year in November.
- Chicken shows some seasonality, but less accentuated.
- Coffee is significantly more stable; it looks like people need it throughout the year.
You may also want to check some other interesting insights that can help you with your Search traffic:
- Check top queries in your region and compare them to the queries that you're getting traffic from, as shown in Search Console's Performance report. If there are queries missing from your traffic, check if you have content on that subject and make sure it's being crawled and indexed.
- Check queries related to important topics. This might surface rising related queries and help you prepare your site for them, for example by adding related content to address those new topics.