Search Console performans verileri filtreleme ve sınırlar hakkında ayrıntılı inceleme
Koleksiyonlar ile düzeninizi koruyun
İçeriği tercihlerinize göre kaydedin ve kategorilere ayırın.
19 Ekim 2022, Çarşamba
Google Arama performans verileri hem Performans raporu hem de Search Analytics
API aracılığıyla Search
Console'da en sık kullanılan verilerdir.
Bu yayında, mevcut veriler ve Google'ın bu verileri nasıl işlediği (gizlilik filtrelemesinin yanı sıra
sunum gecikmesi, depolama ve işleme kaynaklarıyla ilgili diğer sınırlamalar da dahil) ayrıntılı olarak açıklanmaktadır.
Bu sistemlerin nasıl çalıştığını hiç merak ettiniz mi? Bunları yakından
inceleyelim.
Performans raporu, arama trafiğinizin zaman içinde nasıl değiştiğini gösteren dört metrik içerir.
Her metriğin nasıl hesaplandığını açıklayan bir makalemiz mevcuttur ve
aşağıda da bunların özeti verilmiştir:
Tıklama sayısı: Google Arama sonuçlarından mülkünüze gelen kullanıcı tıklamalarının sayısı.
Gösterim sayısı: Kullanıcıların mülkünüzü Google arama sonuçlarında görme sayısı.
TO (Tıklama oranı): Tıklama sayısının gösterim sayımına bölümü.
Konum: URL, sorgu veya genel olarak web sitesinin, arama sonuçlarındaki ortalama konumu.
Bu metriklerin her biri farklı boyutlar açısından analiz edilebilir. Web sitenize trafik çeken sorgular, sayfalar,
ülkeler, cihazlar veya arama görünümlerinin her birinin nasıl performans gösterdiğini kontrol edebilirsiniz.
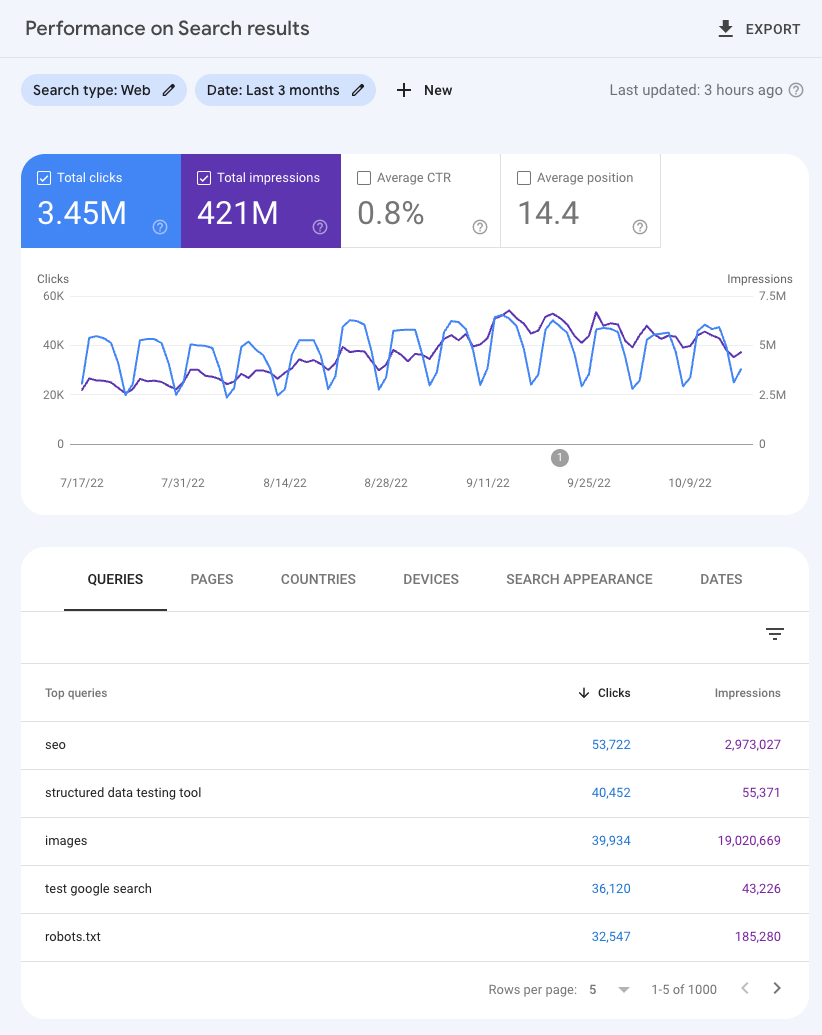
Ürün arayüzünü kullanıyorsanız boyutlara, aşağıdaki resimde gösterildiği gibi filtrelerden veya
grafikteki bilgileri içeren boyutlar tablosundan ulaşabilirsiniz.
Bu veriler, web sitenizi daha görünür hale getirmek ve nihayetinde Google'dan daha fazla trafik çekme yöntemleri
bulmak için kullanılabilir. Ne tür analiz gerçekleştirebileceğinizle ilgili örnek için bu örnek
optimizasyon grafiğine bakın.
Veri filtreleme ve sınırlar
Hem rapor arayüzündeki veriler hem de dışa aktarılan veriler farklı şekillerde toplanıp
filtrelenir. Bu verilerle ilgili iki ana sınırlama olan gizlilik filtreleme ve günlük veri satırı sınırı aşağıda açıklanmıştır.
Gizlilik filtreleme
Bazı sorgular (anonimleştirilmiş sorgular olarak adlandırılır), sorguyu yapan kullanıcının gizliliğini korumak
amacıyla Search Console verilerine dahil edilmez.
Anonimleştirilmiş sorgular, iki ila üç aylık bir dönemde en fazla birkaç düzine kullanıcı tarafından yapılan
sorgulardır. Gizliliği korumak için Arama performansı verilerinde gerçek sorgular gösterilmez.
Bu nedenle, bunları anonimleştirilmiş sorgular olarak adlandırırız. Anonimleştirilmiş gerçek sorgular tablolardan her zaman
çıkarılsa da sorguya göre filtrelemediğiniz sürece grafik toplamlarına dahil edilir.
Konuyu daha anlaşılır hale getirmek için bir örneğe göz atalım. Bu örneğin yalnızca gizlilik filtrelemesini
dikkate alan bir resim olduğunu, ancak bir sonraki bölümde bahsedilen günlük veri satırı sınırlarının da burada rol
oynayabileceğini unutmayın. Daha fazla bilgi edinmek için okumaya devam edin. Aşağıdaki tablonun, anonimleştirilmemiş sorgulardan gelen trafiği ayrıntılı
öğe listesi halinde düzenleyerek web sitenizdeki sorgularla ilgili tüm trafiği gösterdiğini varsayalım. Normalde bir web sitesinde
anonimleştirilmemiş ve ayrıntılı öğe listesi halinde gösterilen dörtten fazla sorgu bulunur. Ancak bu örneğin amacı
doğrultusunda, sadece dört tanesinin ayrıntılı öğe listesi halinde gösterildiğini söyleyeceğiz.
Sorgular
Tıklamalar
klasik edebiyat
150
şiir
125
bilim kurgu
100
kurgu olmayan
75
Ayrıntılı öğe listesi halinde gösterilen sorguların toplamı
450
Genel toplam
550
Ayrıntılı öğe listesi halinde gösterilen tüm sorguları, grafikte gösterildiği gibi toplarsanız 450 tıklama sayısı olduğunu görürsünüz. Ayrıca, sitede
toplam 550 tıklama gerçekleşmiştir. Bu sayı, ayrıntılı öğe listesi halinde gösterilen tüm tıklama sayılarını ve listede yer almayan
anonimleştirilmiş sorgulardan gelen tıklama sayılarını içerdiği için daha yüksektir.
Pratikte Search Console raporlamasını kullanırken bu tür bir tutarsızlığı iki temel şekilde fark edebilirsiniz.
Rapor tablosunda veya API'de, anonimleştirilmiş sorgular için bir satır olmadığından (buraya örnek
olarak eklenmiştir) tüm satırlardaki tıklama sayılarını toplarsanız grafikteki toplam sayıyla aynı tıklama sayısına
ulaşmazsınız. Örneğin, bu durumda satırları topladığınızda 450 değerini görürsünüz, ancak grafikteki toplam
sayı 550'dir.
Anonimleştirilmiş sorgular filtre uygulandığında atlanır. Bu nedenle, grafik genelindeki tıklama sayısı
toplamını, some_string içeren ve some_string içermeyen tıklama sayılarının toplamıyla
karşılaştırırsanız aralarında tutarsızlık olacaktır. Bu durumda, yalnızca "kurgu" kelimesini içeren sorguları dahil etmek için filtreler kullanırsanız 175 tıklama görürsünüz. "Kurgu" kelimesini içeren sorguları hariç tutarsanız 275 tıklama ile birlikte bu sayı toplam 450 tıklamaya ulaşırken, grafikteki toplamda 550 tıklama görürsünüz.
Günlük veri satırı sınırı
Sunum gecikmesi, depolama, işleme kaynakları ve diğer konularla ilgili kısıtlamalar nedeniyle Search
Console'da gösterilebilecek veya dışa aktarılabilecek veri miktarı sınırlıdır. Bu sınırlar, Search Console'daki
mülklerin çoğunluğunu etkilemez. Birkaç tane çok büyük web sitesi bu durumdan etkilenebilir,
ancak bu web siteleri söz konusu olduğunda bile, kalan verilerin temsili bir veri örneği oluşturmaya yetecek kadar fazla olacağına inanıyoruz.
Search Console kullanıcı arayüzü aracılığıyla maksimum 1.000 veri satırı dışa aktarabilirsiniz.
Şu anda Search Analytics API (ve Looker Studio bağlayıcısı) aracılığıyla
dışa aktarılan veriler için üst sınır, arama türü ve site başına
günlük 50.000 satırdır. Bu sayıya da her durumda ulaşmak mümkün olmayabilir. API tarafından
döndürülen varsayılan değer 1.000 satırdır. Bununla birlikte, sayfalara ayırma işlemiyle bu değeri 25.000 satıra
yükseltmek için rowLimit, satır aralığını 25.001'den 50.000'e çekmek için de startRow kullanabilirsiniz. Mevcut verileri
nasıl alacağınızı öğrenmek için bu kılavuzu inceleyin.
Ülkeler, cihazlar ve arama görünümleri gibi sorgu veya URL boyutlarını içermeyen istekler söz konusu
olduğunda Search Console tüm verileri gösterip dışa aktarır.
Kaynaklar ve geri bildirim
Bu konu hakkında daha fazla bilgi edinmek istiyorsanız Performans dokümanlarını okuyun.
Mevcut veriler, performans raporunun nasıl kullanılacağı ve grafiklerde karşılaşabileceğiniz tutarsızlıklarla ilgili
ayrıntılı açıklamalar bulabilirsiniz.
[[["Anlaması kolay","easyToUnderstand","thumb-up"],["Sorunumu çözdü","solvedMyProblem","thumb-up"],["Diğer","otherUp","thumb-up"]],[["İhtiyacım olan bilgiler yok","missingTheInformationINeed","thumb-down"],["Çok karmaşık / çok fazla adım var","tooComplicatedTooManySteps","thumb-down"],["Güncel değil","outOfDate","thumb-down"],["Çeviri sorunu","translationIssue","thumb-down"],["Örnek veya kod sorunu","samplesCodeIssue","thumb-down"],["Diğer","otherDown","thumb-down"]],[],[[["\u003cp\u003eGoogle Search Console's Performance report provides data on clicks, impressions, CTR, and position to analyze website search traffic.\u003c/p\u003e\n"],["\u003cp\u003eSearch performance data can be accessed via the product interface, Search Analytics API, Looker Studio Connector, and manual spreadsheet downloads.\u003c/p\u003e\n"],["\u003cp\u003eData is subject to privacy filtering, meaning some queries are anonymized to protect user privacy and may lead to discrepancies in total click counts.\u003c/p\u003e\n"],["\u003cp\u003eA daily data row limit exists for exported data, capped at 1,000 rows via the user interface and 50,000 via the API or Looker Studio Connector.\u003c/p\u003e\n"],["\u003cp\u003eComprehensive resources and support are available through Google Search Central Community and Twitter for further assistance.\u003c/p\u003e\n"]]],["Google Search Console's Performance report provides data on clicks, impressions, CTR, and position, which can be analyzed across queries, pages, countries, devices, and search appearances. Access is available through the interface, API, Looker Studio, and spreadsheets. Data is filtered for user privacy, omitting anonymized queries from tables but including them in totals, and has limits of 1,000 rows via the interface or up to 50,000 via API per day.\n"],null,["# A deep dive into Search Console performance data filtering and limits\n\nWednesday, October 19, 2022\n\n\nGoogle Search performance data is the most widely used data in Search Console, both through the\n[Performance report](https://support.google.com/webmasters/answer/7576553)\nand the [Search Analytics API](/webmaster-tools/v1/searchanalytics/query).\nThis post explains in detail the data available and how Google processes it, including privacy\nfiltering and other limitations related to serving latency, storage, and processing resources.\nEver wonder how these systems work? Let's do a deep dive\ninto them.\n\n\nIf you're new to Search Console, check out the [introduction to Performance reports](https://support.google.com/webmasters/answer/10268906).\n\nSearch performance basics\n-------------------------\n\n\nThe Performance report contains four metrics that show how your search traffic changes over time.\nWe have an article describing [how each metric is calculated](https://support.google.com/webmasters/answer/7042828),\nand here's a summary:\n\n- Clicks: Count of user clicks from Google Search results to your property.\n- Impressions: Count of times users saw your property on Google search results.\n- CTR (Click-through rate): The click count divided by the impression count.\n- Position: The average position in search results for the URL, query, or for the website in general.\n\n\nEach of those metrics can be analyzed for different dimensions. You can check how each of the queries,\npages, countries, devices, or search appearances driving traffic to your website is performing.\n\n\nThere are many ways to access the Search performance data, including the\n[product interface](https://search.google.com/search-console/performance/search-analytics),\nthe [Search Analytics API](/webmaster-tools/v1/searchanalytics/query),\nthe [Looker Studio connector](/search/blog/2022/03/connecting-data-studio),\nand spreadsheets (requires manual download from the interface).\n\n\nIf you're using the product interface, the dimensions are available through the filters or through\nthe dimensions tables following the chart, as shown in the image below.\n\n\nThis data can be used to find ways to make your website more visible and ultimately get more traffic\nout of Google. For a sample of what type of analysis you can perform, check this\n[sample optimization chart](/search/blog/2022/04/performance-optimization-bubble-chart).\n\nData filtering and limits\n-------------------------\n\n\nBoth the data in the report interface and the data exported are aggregated and filtered in different\nways. Below are the two main limitations to the data: privacy filtering and daily data row limit.\n\n### Privacy filtering\n\n\nSome queries (called anonymized queries) are not included in Search Console data to protect the\nprivacy of the user making the query.\n\n\nAnonymized queries are those that aren't issued by more than a few dozen users over a two-to-three\nmonth period. To protect privacy, the actual queries won't be shown in the Search performance data.\nThis is why we refer to them as anonymized queries. While the actual anonymized queries are always\nomitted from the tables, they are included in chart totals, unless you filter by query.\n\n\nLet's look at an example to make it clearer - note that this is an illustration that takes into\naccount only privacy filtering, but daily data row limits, discussed in the next section, may also\nplay a role, read on to learn more. Let's say the table below shows all the traffic for queries to\nyour website, itemizing the traffic from non-anonymized queries. A typical website will generally\nhave more than four itemized non-anonymized queries, of course, but for purposes of this example,\nwe'll say it's just four that are itemized.\n\n|------------------------------|------------|\n| **Queries** | **Clicks** |\n| classic literature | 150 |\n| poetry | 125 |\n| science fiction | 100 |\n| non fiction | 75 |\n| *Total for itemized queries* | *450* |\n| *Total overall* | *550* |\n\n\nIf you add up all the itemized queries, as the chart shows, there were 450 clicks. There are also\n550 overall clicks to the site. That number is higher because it includes all the itemized clicks\nplus the clicks from anonymized queries, which aren't listed.\n\n\nIn practice, when using Search Console reporting, you may notice this type of discrepancy in two main ways.\n\n1. There is no row for anonymized queries in the report table or API (added here for illustration purposes), so if you sum up clicks for all the rows, you'll not find the same number of clicks as the chart totals. For example in this case you'd see 450 when you sum up the rows, but you'd see 550 in the chart totals.\n2. The anonymized queries are omitted whenever a filter is applied, so there will be a discrepancy if you compare the sum of clicks in the chart totals to the sum of clicks containing `some_string` and not containing `some_string`. In this case, if you use filters to include only queries that contain the word \"fiction\", you'll see 175 clicks, and if you exclude queries that contain the word \"fiction\", you'll see 275 clicks, summing up to 450 clicks, while in the chart total you'll see 550 clicks.\n\n### Daily data row limit\n\n\nDue to limitations related to serving latency, storage, processing resources, and others, Search\nConsole has a limit on the amount of data that can be displayed or exported. These limits won't affect\nthe majority of properties in Search Console. A few very large websites can be affected by this, but\neven for those we believe the remaining data will be large enough to create a representative sample of data.\n\n\nThe maximum you can export through the Search Console user interface is 1,000 rows of data.\nCurrently, the upper limit for the data exported through the [Search Analytics API](/webmaster-tools/v1/searchanalytics/query)\n(and through the [Looker Studio connector](/search/blog/2022/03/connecting-data-studio))\nis 50,000 rows per day per site per search type, which may not be reached in all cases. The default\nreturned by the API will be 1,000 rows, but you can use `rowLimit` to increase it to 25,000\nand `startRow` to pull the rows 25,001 to 50,000 using pagination. Check this guide to\nlearn [how to get the available data](/webmaster-tools/v1/how-tos/all-your-data).\n\n\nFor requests that don't involve query or URL dimensions, such as countries, devices, and Search\nAppearances, Search Console will display and export all the data.\n\nResources and feedback\n----------------------\n\n\nIf you'd like to learn more about the subject, read the [Performance documentation](https://support.google.com/webmasters/answer/7576553).\nYou'll find in-depth explanations about the available data, how to use the Performance report, and more\ndetails about discrepancies you may find in the charts.\n\n\nIf you have any questions or concerns, please reach out to us via the\n[Google Search Central Community](https://support.google.com/webmasters/threads?thread_filter=(category:search_console))\nor on [Twitter](https://twitter.com/googlesearchc).\n\nPosted by [Daniel Waisberg](https://www.danielwaisberg.com), Search Advocate"]]