Search Console kabarcık grafiğiyle web sitesi performansını optimize etme
Koleksiyonlar ile düzeninizi koruyun
İçeriği tercihlerinize göre kaydedin ve kategorilere ayırın.
6 Nisan 2022, Çarşamba
Arama performansı verilerini analiz etmek her zaman çaba gerektiren bir iş olmuştur. Üzerine bir de görselleştirmesi ve anlaması zahmetli olan çok sayıda genişlemeli sorgunuz varsa işiniz daha da zorlaşır. Bu yayında, sitenizin Google Arama performansını optimize etme fırsatlarını keşfetmenize yardımcı olacak ipuçlarından bahsedeceğiz.
Bugünkü yayınımızda, sitenizdeki hangi sorguların iyi performans gösterdiğini ve hangilerinin iyileştirilebileceğini anlamanıza yardımcı olacak bir kabarcık grafikten bahsedeceğiz. İlk olarak grafikteki ana öğelerden bahsederek belirli ayarları ve bu ayarların verileri nasıl etkilediğini açıklayacağız. Ardından, verileri analiz ederken dikkat edilmesi gereken noktalarla ilgili birkaç öneri sunacağız.
Önce iyi haberi verelim: Grafiği sıfırdan oluşturmanıza gerek yok. Bu şablonu kullanarak verilerinize bağlanabilir ve istediğiniz ayarda değişiklik yapabilirsiniz.
Lafı daha fazla uzatmayalım...
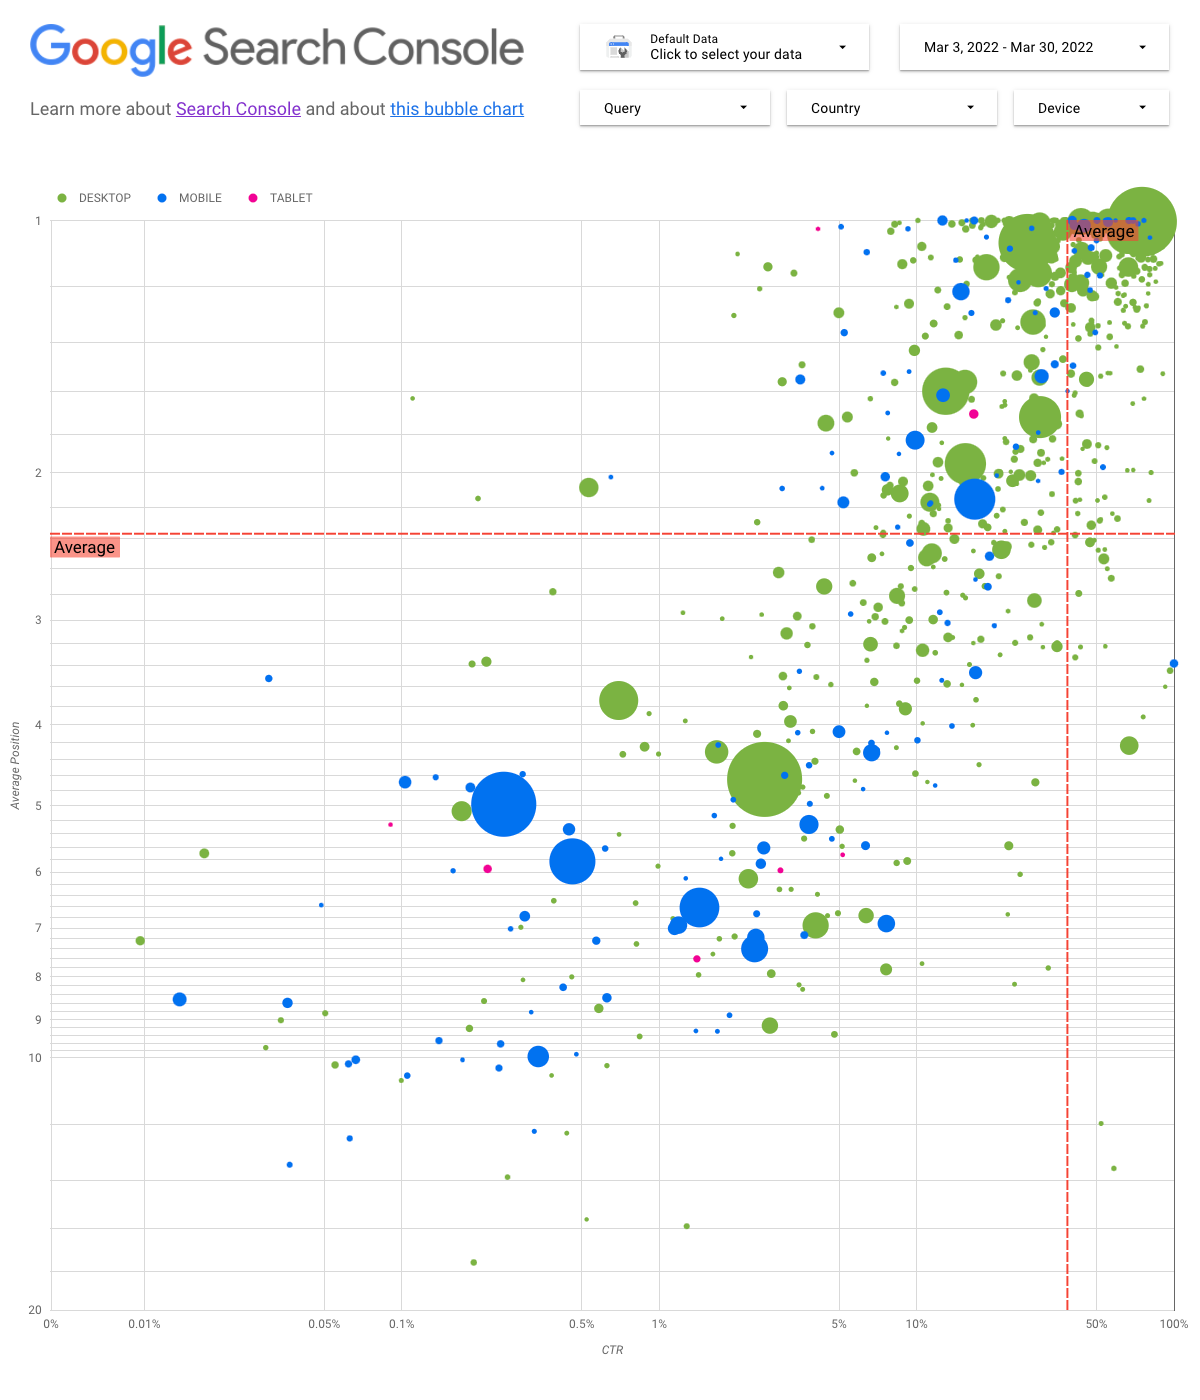
Grafiği anlama
Kabarcık grafik, verilerinizdeki ilişkileri ve kalıpları daha etkili bir şekilde görmenizi sağladığı için birden fazla metriğiniz ve boyutunuz olduğunda mükemmel bir görselleştirme aracıdır. Burada gösterilen örnekte farklı boyutlar (sorgu, cihaz) için trafik özelliklerini (tıklama oranı (TO), ortalama konum) ve hacmi (toplam tıklama sayısı) aynı anda görebilirsiniz.
Bazı grafik öğelerini inceleyerek nelerin gösterilip gösterilmediğini daha net ifade edeceğiz.
Verileri rahatça kontrol etmenizi sağlamak için grafiğe beş farklı özelleştirme seçeneği ekledik:
Veri kontrolü: Analiz etmek istediğiniz Search Console mülkünü seçin.
Tarih aralığı: Raporda görmek istediğiniz tarih aralığını seçin. Varsayılan olarak son 28 günü görürsünüz.
Sorgu: Odaklanmak istediğiniz sorguları dahil edin veya hariç tutun. Search Console'da kullandığınıza benzer şekilde normal ifadeler kullanabilirsiniz.
Ülke: Ülkeleri dahil edin veya hariç tutun.
Cihaz: Cihaz kategorilerini dahil edin veya hariç tutun.
Eksenler
Grafikteki eksenler, Ortalama konumu (y ekseni) ve Site TO'sunu (x ekseni) ifade etmektedir. Bununla birlikte, grafiği daha kapsamlı hale getirmek için üç önemli dönüşüm uyguladık:
Ters y ekseni yönü: Y ekseni, ortalama konumu gösterdiğinden bu eksen ters çevrildiğinde 1 değeri en üstte gelir.
Çoğu işletme grafiğinde en iyi konum sağ üst köşededir. Bu nedenle, ortalama konumu göstermek için kullanılıyorsa y eksenini ters çevirmek kullanım açısından daha kolaydır.
Logaritmik ölçek: Logaritmik ölçek, "değer aralığı çok geniş olan sayısal verileri toplu halde görüntülemenin bir yoludur (...) ölçek üzerinde bir birimlik ilerleme sayının 10 ile çarpılması anlamına gelir". İki eksen için de logaritmik ölçek kullanıldığında, grafiğin uç noktalarında bulunan sorguları (çok düşük TO, ortalama konum veya her ikisi) daha iyi anlayabilirsiniz.
Referans çizgileri: Referans çizgisi, belirli bir eşiğin üstündeki veya altındaki değerleri vurgulamak için oldukça faydalıdır. Ortalamaya, ortanca değere veya belirli yüzdelik dilimlere bakıldığında düzendeki sapmalar dikkat çekebilir.
Baloncuklar
Grafikteki her bir kabarcık tek bir sorguyu temsil eder. Grafiği daha kullanışlı hale getirmek için ise iki tane stil özelliği kullandık:
Boyut: Tıklama sayısını kabarcık boyutuyla göstermek, trafiğin büyük kısmını getiren sorguları bir bakışta görmenizi sağlar. Kabarcık ne kadar büyükse sorgu o kadar fazla trafik oluşturuyor demektir.
Renk: Cihaz kategorisini kabarcık rengiyle göstermek, mobil ve masaüstü Arama performansı arasındaki farkları anlamanızı sağlar. Herhangi bir boyutu renkle gösterebilirsiniz ancak değerlerin sayısı arttıkça düzenleri tanımak daha zor hale gelir.
Verileri analiz etme
Bu görselleştirmenin amacı, sorgu optimizasyon fırsatlarının ortaya çıkarılmasına yardımcı olmaktır. Sorgu performansının gösterildiği grafikte; y ekseni ortalama konumu, x ekseni TO'yu, kabarcık boyutu toplam tıklama sayısını ve kabarcık rengi cihaz kategorisini temsil eder.
Kırmızı referans çizgileri her bir eksenin ortalamasını belirtir. Bu eksenler grafiği dört bölüme ayırarak dört sorgu performansı türünü gösterir. Sizin grafiğinizdeki dört bölüm, site sorgularınızın nasıl dağıtıldığına bağlı olarak bu yayında paylaşılandan farklı olabilir.
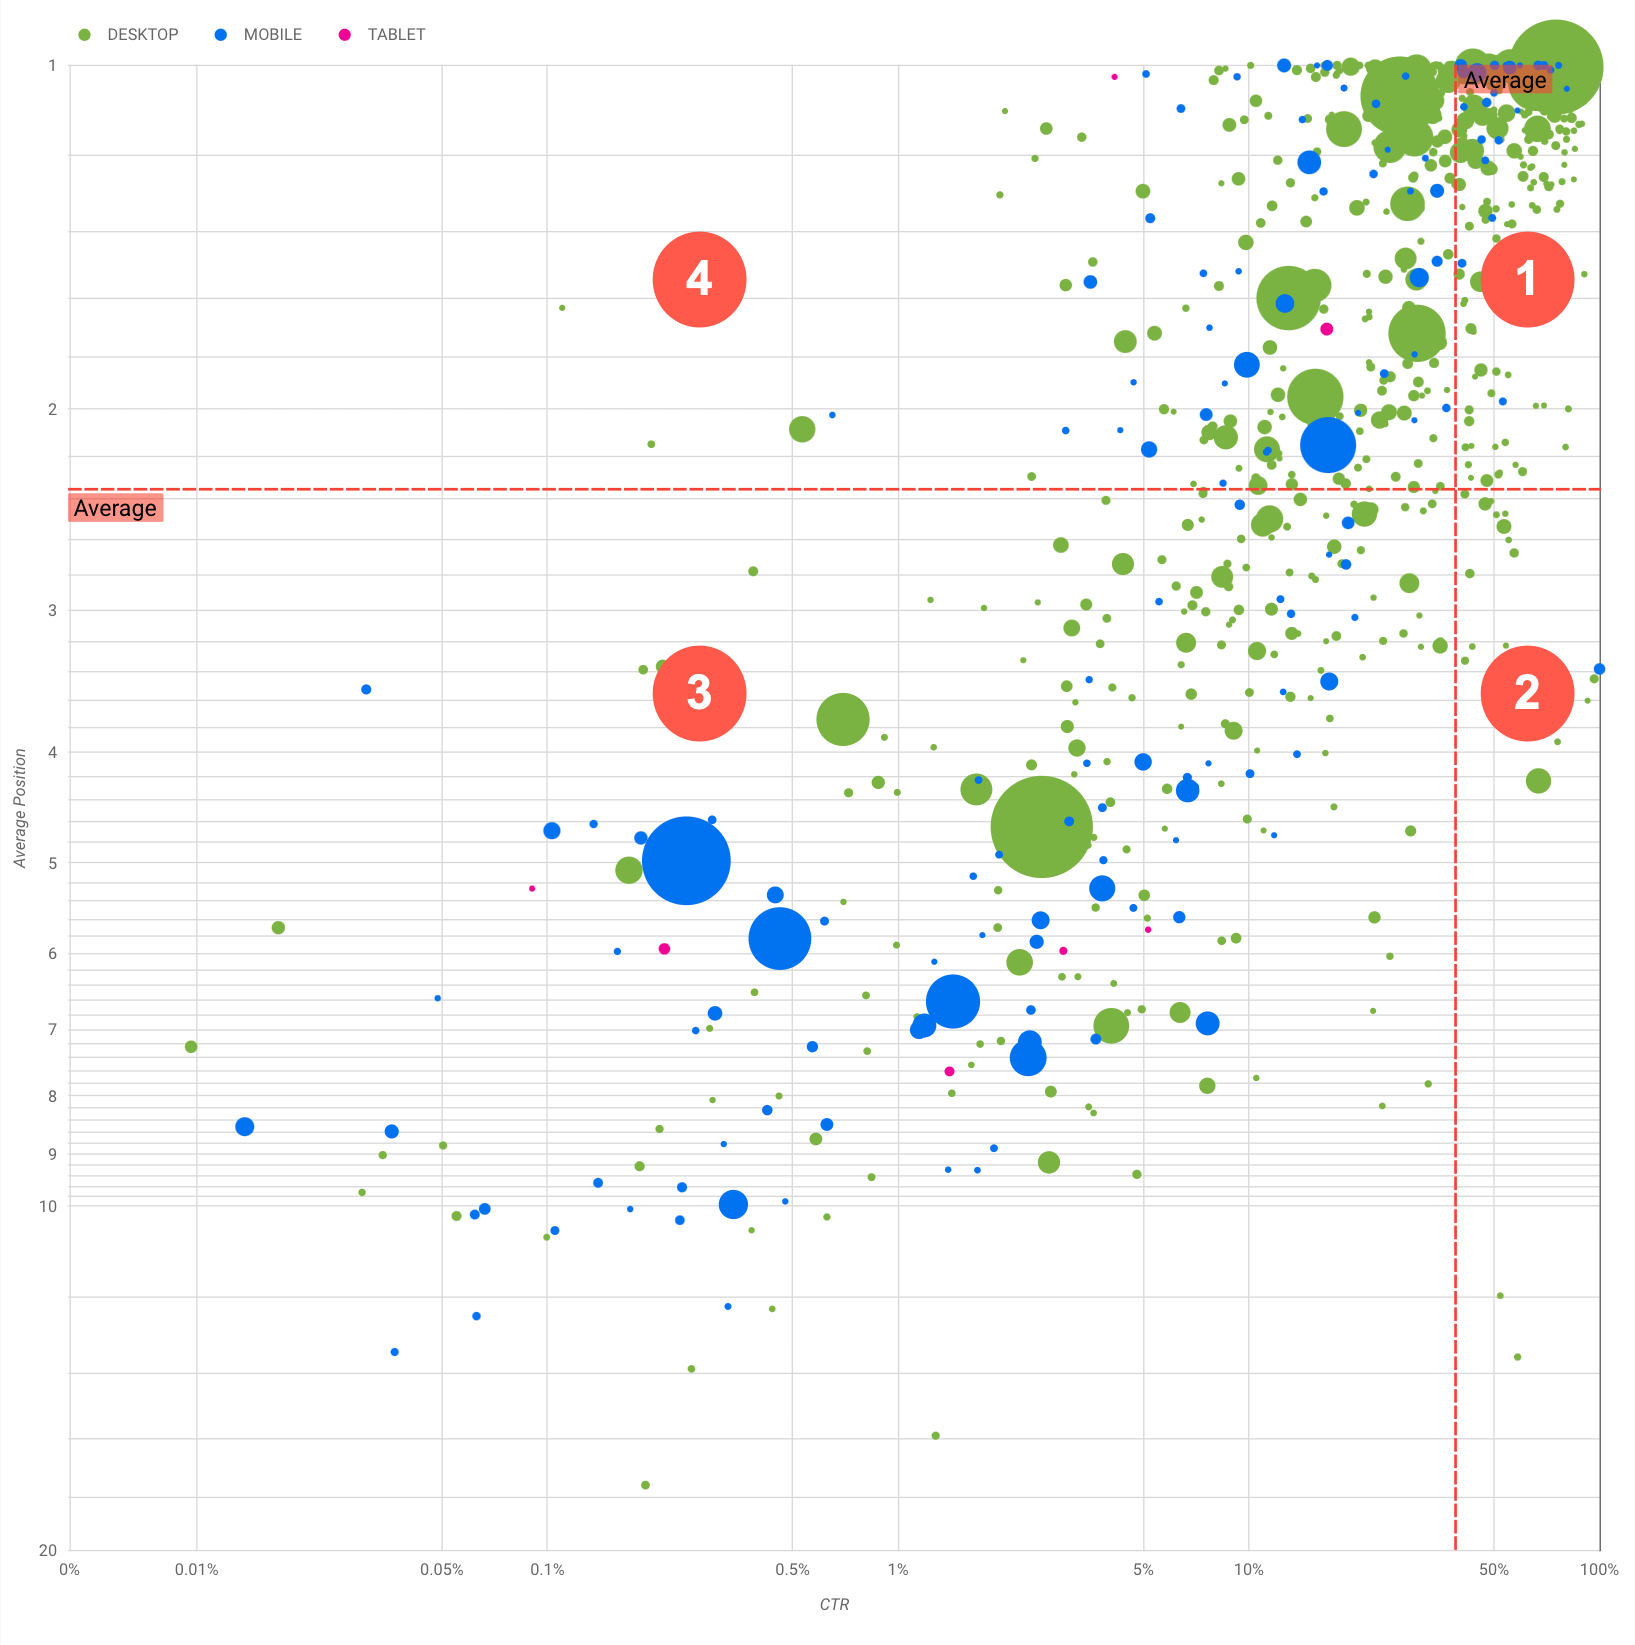
Grafik genel olarak analiz edebileceğiniz dört grubu göstererek sorgu performansınızı optimize ederken nereye zaman harcayacağınıza karar vermenizi sağlar.
En üst konum, yüksek TO: Zaten mükemmel bir iş çıkardığınız için bu grupta yapmanız gereken pek fazla şey yoktur.
Düşük konum, yüksek TO: Bu sorgular kullanıcılar açısından alakalıdır. Web sitenizdeki ortalama sorgudan daha düşük bir sıralamada olsalar bile yüksek TO alırlar. Konumları yükselirse önemli ölçüde katkı sağlayacakları için bu sorguları optimize etmeye odaklanın.
Düşük konum, düşük TO: Düşük TO'ya sahip sorgulara (bu maddede ve sonraki maddede) bakarken TO'su düşük olmasına rağmen önemli miktarda trafik getiren sorguların hangileri olduğu anlamak için kabarcık boyutlarına bakmak ilginç olabilir. Bu bölümdeki sorgular için gösterdiğiniz çabaya değmez gibi görünse de bu sorgular da iki ana gruba ayrılabilir:
İlgili sorgular: Söz konusu sorgu sizin için önemliyse Arama'da zaten görünüyor olması iyi bir başlangıçtır.
Arama sonuçlarında hiç görünmeyen sorgulara göre optimize edilmeleri daha kolay olacağından bu sorgulara öncelik verin.
İlgisiz sorgular: Sorgu, sitenizle ilgili değilse içeriğinize küçük dokunuşlar yaparak alakalı trafik getirecek sorgulara odaklanmak iyi bir fırsat olabilir.
En üst konum, düşük TO: Bu sorgular çeşitli nedenlerle düşük TO'ya sahip olabilir. En büyük kabarcıkları kontrol ederek aşağıdaki durumları arayabilirsiniz:
Rakipleriniz yapılandırılmış veri işaretlemeye sahipse zengin sonuçlarla birlikte görünürler. Bu nedenle kullanıcılar sizin sonuçlarınızdan ziyade rakiplerinizin sonuçlarını tıklamaya yönlendirilebilirler. Siteniz için arama sonucu özelliklerini etkinleştirmeyi düşünün.
Kullanıcıların sitenizde ilgilenmediği bir sorgu için optimizasyon yapmış veya "yanlışlıkla" sıralamada yer alıyor olabilirsiniz.
Kullanıcılar ihtiyaç duydukları bilgileri (örneğin, şirketinizin çalışma saatleri, adresi veya telefon numarası) zaten bulmuş olabilirler.
Web sitenizin performansını optimize etme
Zaman ve çaba harcamaya değer sorguları bulduktan sonra SEO Başlangıç Kılavuzu'ndan faydalanarak bu sorgular için optimizasyon yapın. Aşağıda bazı ipuçları verilmiştir:
Önemli metinleri vurgulamak ve içeriğinizde hiyerarşik bir yapı oluşturmak için başlık öğeleri kullanarak kullanıcıların ve arama motorlarının dokümanınızda gezinmesini kolaylaştırabilirsiniz.
İçeriğinizi arama motorlarına açıklamak ve arama sonuçlarında faydalı (ve göze çarpan) şekillerde gösterilmeye uygun hale getirmek için yapılandırılmış veri işaretleme ekleyin.
Kullanıcıların içeriğinizde bir bölümü bulmak için arayabileceği kelimeleri düşünün. Google Ads'in sunduğu Anahtar Kelime Planlayıcı'yı kullanarak yeni anahtar kelime varyasyonlarını keşfedebilir ve her anahtar kelime için yaklaşık arama hacmine bakabilirsiniz. Web sitenizle alakalı popüler konulara ve sorgulara dair fikirler bulmak için Google Trendler'i de kullanabilirsiniz.
[[["Anlaması kolay","easyToUnderstand","thumb-up"],["Sorunumu çözdü","solvedMyProblem","thumb-up"],["Diğer","otherUp","thumb-up"]],[["İhtiyacım olan bilgiler yok","missingTheInformationINeed","thumb-down"],["Çok karmaşık / çok fazla adım var","tooComplicatedTooManySteps","thumb-down"],["Güncel değil","outOfDate","thumb-down"],["Çeviri sorunu","translationIssue","thumb-down"],["Örnek veya kod sorunu","samplesCodeIssue","thumb-down"],["Diğer","otherDown","thumb-down"]],[],[[["\u003cp\u003eThis blog post provides tips and techniques using a bubble chart in Data Studio to analyze website search performance and identify optimization opportunities.\u003c/p\u003e\n"],["\u003cp\u003eThe bubble chart visualizes query performance by showing average position, click-through rate, total clicks (bubble size), and device category (bubble color).\u003c/p\u003e\n"],["\u003cp\u003eThe chart helps identify four types of queries: top-performing, high-CTR but low-ranking, low-CTR and low-ranking, and high-ranking but low-CTR, offering optimization strategies for each.\u003c/p\u003e\n"],["\u003cp\u003eOptimization tips include improving title tags, meta descriptions, headings, structured data, and keyword research using tools like Keyword Planner and Google Trends.\u003c/p\u003e\n"],["\u003cp\u003eUsers can leverage a provided Data Studio template to connect to their Search Console data and customize the analysis according to their needs.\u003c/p\u003e\n"]]],["This blog post explains how to use a bubble chart to analyze Google Search performance data. The chart visualizes query performance, with average position on the y-axis, CTR on the x-axis, click volume as bubble size, and device category as bubble color. Users can customize the data with filters like date range, query, country, and device. The chart identifies four query performance groups to target for optimization: high or low position and CTR. Optimization tips include improving titles, descriptions, structured data, and keyword research.\n"],null,["# Optimizing website performance with a Search Console bubble chart\n\nWednesday, April 06, 2022\n| It's been a while since we published this blog post. Some of the information may be outdated (for example, some images may be missing, and some links may not work anymore). Check out the new documentation on [improving SEO with a Search Console bubble chart](/search/docs/monitor-debug/bubble-chart-analysis).\n\n\nAnalyzing Search performance data is always a challenge, but even more so when you have plenty of long-tail queries,\nwhich are harder to visualize and understand. In this post, we'll provide tips to help you uncover opportunities to\noptimize your site's Google Search performance.\n\n\nIf you haven't read our recent posts on [connecting Search Console to Data Studio](/search/blog/2022/03/connecting-data-studio)\nand [monitoring Search traffic with Data Studio](/search/blog/2022/03/monitoring-dashboard),\nconsider checking them out to understand more about what you can do with Search Console in Data Studio.\n\n\nToday we'll discuss a [bubble chart](https://support.google.com/datastudio/answer/7207785)\nthat can help you understand which queries are performing well for your site, and which could be improved. We'll first\nexplain the main elements in the chart, describing specific settings and how they influence the data. Then we'll provide\nsome pointers on what to look for when analyzing the data.\n\n\nStarting with the good news: you don't need to build the chart from scratch, you can use\n[this template](https://datastudio.google.com/reporting/1e5b5f6a-38d7-4547-a54b-69594681a09b/page/xFbeC/preview), connect to your data,\nand tweak any settings you want.\n\n\n*Without further ado...*\n\nUnderstanding the chart\n-----------------------\n\n\nA **bubble chart** is a great visualization when you have multiple metrics and dimensions because it enables you to see\nrelationships and patterns in your data more effectively. In the example shown here, you can see traffic attributes\n(click-through rate (CTR), [average position](https://support.google.com/webmasters/answer/7042828#position))\nand volume (total [clicks](https://support.google.com/webmasters/answer/7042828#click)) for different dimensions (query, device) at the same time.\n\n\nWe'll go through some of the chart elements to clarify what it shows, and what it doesn't.\n\n### Data source\n\n\nFor this chart, we're using the **Site Impression** table available through the [Search Console data source](https://support.google.com/datastudio/answer/7314895), which includes [Search\nperformance data](https://support.google.com/webmasters/answer/7576553) aggregated by site and queries.\n\n### Filters and data controls\n\n\nIn order to make it easy for you to control your data effectively, we included five customization options in the chart:\n\n1. **[Data control](https://support.google.com/datastudio/answer/7415591)**: Choose the Search Console property you'd like to analyze.\n2. **Date range**: Choose the date range you'd like to see in the report; by default you'll see the last 28 days.\n3. **Query** : Include or exclude queries to focus on. You can [use regular\n expressions](/search/blog/2021/06/regex-negative-match) similar to the way you use them in Search Console.\n4. **Country**: Include or exclude countries.\n5. **Device**: Include or exclude device categories.\n\n### Axes\n\n\nThe axes in the chart are **Average position** (y-axis) and **Site CTR** (x-axis), but we made three significant transformations\nto make the chart more insightful:\n\n- **Reverse y-axis direction**: Since the y-axis shows average position, inverting it means that 1 is at the top. For most business charts, the best position is in the top right corner, so it is more intuitive to invert the y-axis when using it to display average position.\n- **Log scale** : A [logarithmic scale](https://en.wikipedia.org/wiki/Logarithmic_scale) is \"a way of displaying numerical data over a very wide range of values in a compact way (...) moving a unit of distance along the scale means the number has been multiplied by 10\". Using log scale for both axes enables you to have a better understanding of queries that are in the extremities of the chart (very low CTR, average position, or both).\n- **[Reference lines](https://support.google.com/datastudio/answer/9921462)**: The reference line is very helpful to highlight values that are above or below a certain threshold. Looking at the average, median, or a certain percentile can call attention to deviations from the pattern.\n\n### Bubbles\n\n\nEach bubble in the chart represents a single query, and in order to make the chart more useful, we used two\n[style properties](https://support.google.com/datastudio/answer/7207785#style-properties):\n\n- **Size**: Using the number of clicks as the bubble size helps you see in a glance which queries are driving the bulk of the traffic --- the larger the bubble the more traffic the query generates.\n- **Color**: Using the device category as the bubble color helps you understand the differences between mobile and desktop Search performance. You can use any dimension as the color, but as the number of values increases, the harder it is to recognize patterns.\n\nAnalyzing the data\n------------------\n\n\nThe goal of this visualization is to help surface query optimization opportunities. The chart shows query performance, where\nthe y-axis represents **average position** , the x-axis represents **CTR** , the bubble size represents total number of\n**clicks** , and the bubble color represents **device category**.\n\n\nThe red reference lines show the average for each of the axes, which split the chart into quadrants, showing four types of\nquery performance. Your quadrants are likely to look different than the one shared in this post; they'll depend on how your\nsite queries are distributed.\n\n\nIn general, the chart will show four groups you can analyze to help you decide where to invest your time when optimizing your query performance.\n\n1. **Top position, high CTR**: There's not much you need to do for those; you're doing a great job already.\n2. **Low position, high CTR** : Those queries seem relevant to users; they get a high CTR even when ranking lower than the average query on your website. They could represent a significant contribution if their position goes up --- *invest in optimizing them!*\n3. **Low position, low CTR** : When looking at queries with low CTR (this and the next bullet), it's especially interesting to look at the bubble sizes to understand which queries have a low CTR but are still driving significant traffic. While the queries in this quadrant might seem unworthy of your effort, they can be divided into two main groups:\n - *Related queries*: If the query in question is important to you, it's a good start to have it appearing in Search already. Prioritize these queries over queries that are not appearing in Search results at all, as they'll be easier to optimize.\n - *Unrelated queries*: If the query is unrelated to your site, maybe it's a good opportunity to fine-tune your content to focus on queries that will bring relevant traffic.\n4. **Top position, low CTR** : Those queries might have a low CTR for various reasons. You should check the largest bubbles to find signs of the following:\n - Your competitors may have structured data markup and are showing up with rich results, which might attract users to click their results instead of yours. Consider [enabling Search result\n features for your site](/search/docs/appearance/search-result-features).\n - You may have optimized, or be \"accidentally\" ranking, for a query that users are not interested in relation to your site.\n - Users may have already found the information they needed, for example your company's opening hours, address, or phone number.\n\nOptimizing your website performance\n-----------------------------------\n\n\nOnce you find queries that are worth the time and effort, make sure to optimize for them with the help of the\n[SEO starter guide](/search/docs/fundamentals/seo-starter-guide). Here are some tips:\n\n- Ensure that your [`title`](/search/docs/appearance/title-link#page-titles) elements, [description `meta` tags](/search/docs/appearance/snippet#meta-descriptions), and `alt` attributes are descriptive, specific, and accurate.\n- Use heading elements to emphasize important text and help create a hierarchical structure for your content, making it easier for users and search engines to navigate through your document.\n- Add [structured data markup](/search/docs/appearance/structured-data/intro-structured-data) to describe your content to search engines and be eligible to display your content in useful (and eye-catching) ways in search results.\n- Think about the words that a user might search for to find a piece of your content. You can use the [Keyword Planner](https://ads.google.com/home/tools/keyword-planner/) provided by Google Ads to help you discover new keyword variations and see the approximate search volume for each keyword. You can also use [Google Trends](https://trends.google.com/trends/) to find ideas from rising topics and queries related to your website.\n\nFeedback\n--------\n\n\nAs always, let us know if you have any questions through the [Google\nSearch Central Community](https://support.google.com/webmasters/threads?thread_filter=(category:search_console)) or the [Data Studio Community](https://support.google.com/datastudio/threads?thread_filter=(category:connect_to_data)).\nAlso, if you're on Twitter, make sure to [follow us](https://twitter.com/googlesearchc), as we'll announce future posts over there.\n\nPosted by [Daniel Waisberg](https://www.danielwaisberg.com), Search Advocate"]]