Ottimizzare le prestazioni del sito web con un grafico a bolle di Search Console
Mantieni tutto organizzato con le raccolte
Salva e classifica i contenuti in base alle tue preferenze.
Mercoledì 6 aprile 2022
Analizzare i dati sulle prestazioni nella Ricerca è sempre una sfida, ma lo è in particolar modo se avete molte query long-tail, che sono più difficili da visualizzare e comprendere. In questo post, forniremo suggerimenti per aiutarvi a scoprire le opportunità per ottimizzare le prestazioni del vostro sito nella Ricerca Google.
Oggi parleremo di un grafico a bolle che può aiutarvi a capire quali query hanno buoni risultati sul sito e quali potrebbero essere migliorate. Innanzitutto, illustreremo gli elementi principali del grafico, descrivendo le impostazioni specifiche e in che modo influiscono sui dati; dopodiché, vi daremo alcuni suggerimenti relativi agli aspetti su cui concentrarsi durante l'analisi dei dati.
Iniziamo con la buona notizia: non dovete creare il grafico da zero, dato che potete utilizzare questo modello, collegare i vostri dati e modificare le impostazioni come preferite.
Vediamo un esempio concreto.
Comprendere il grafico
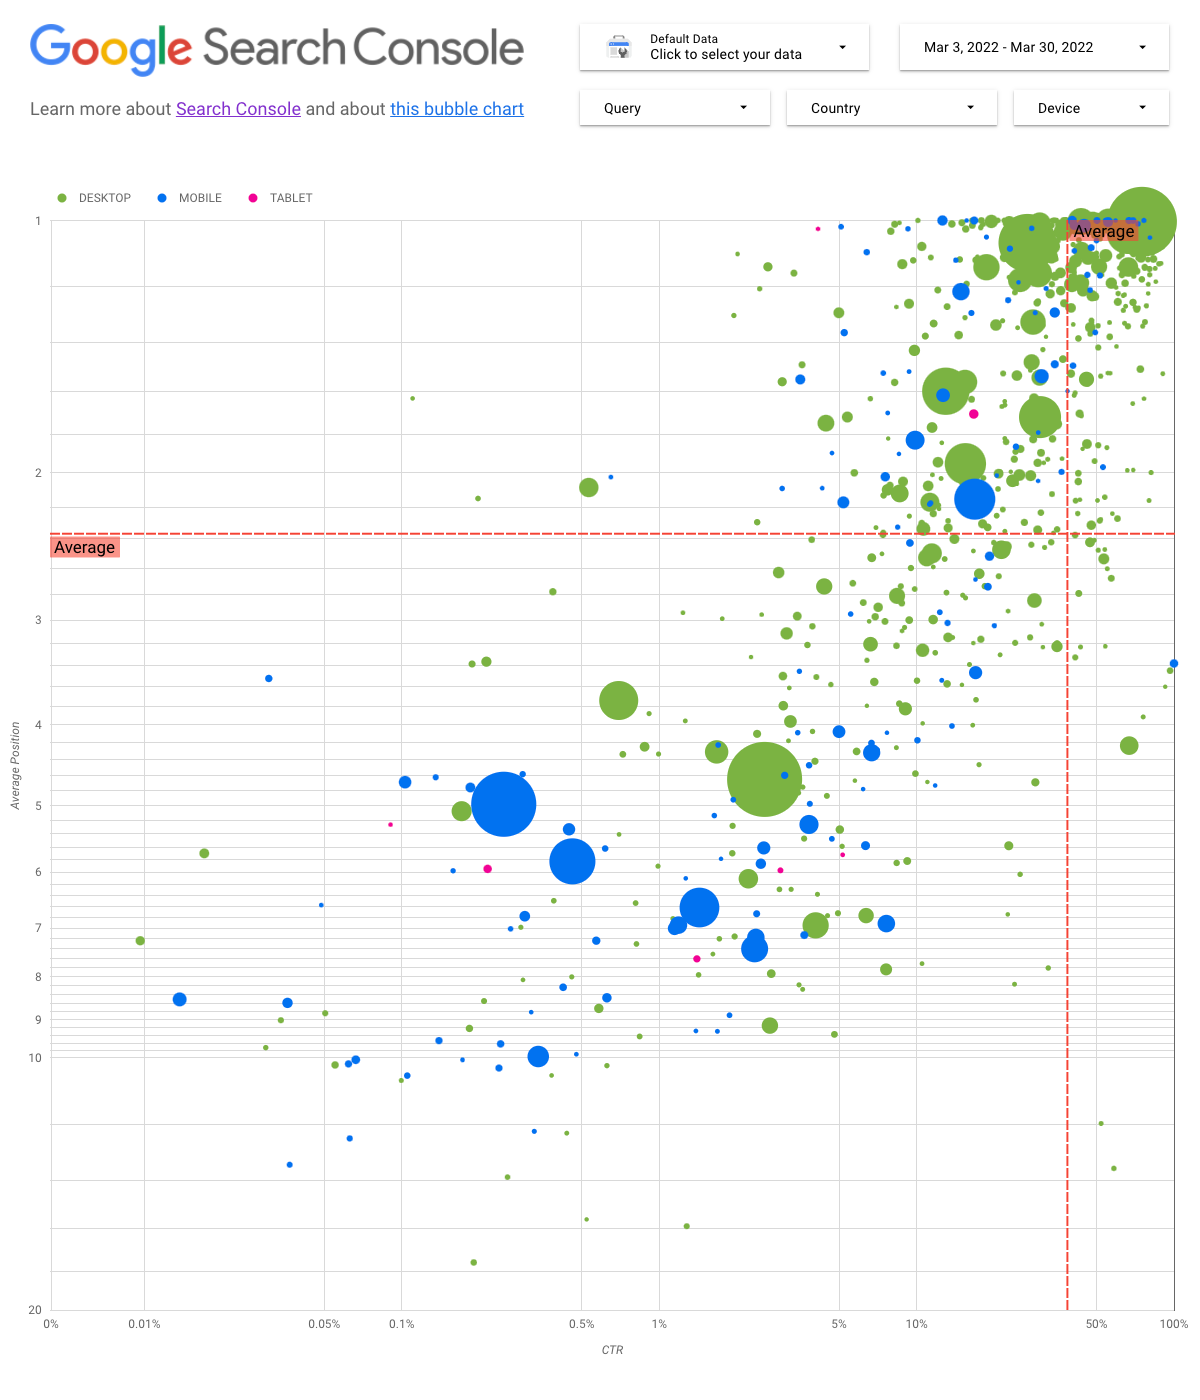
Un grafico a bolle è un'ottima visualizzazione quando avete più metriche e dimensioni perché vi consente di individuare relazioni e pattern nei dati in modo più efficace. Nell'esempio riportato di seguito, potete visualizzare contemporaneamente gli attributi relativi al traffico (percentuale di clic (CTR), posizione media) e il volume (clic totali) per dimensioni diverse (query, dispositivo).
Esamineremo alcuni elementi del grafico per chiarire cosa viene e cosa non viene mostrato.
Al fine di semplificare il controllo dei dati, abbiamo incluso nel grafico cinque opzioni di personalizzazione:
Controllo dei dati: scegliete la proprietà di Search Console che volete analizzare.
Intervallo di date: scegliete l'intervallo di date da visualizzare nel report; per impostazione predefinita, vengono visualizzati gli ultimi 28 giorni.
Query: includete o escludete le query a seconda delle esigenze. Potete utilizzare espressioni regolari simili a quelle che usate in Search Console.
Paese: includete o escludete determinati paesi.
Dispositivo: includete o escludete categorie di dispositivi.
Assi
Gli assi nel grafico sono Posizione media (asse Y) e CTR sito (asse X), ma abbiamo apportato tre trasformazioni significative per rendere il grafico più approfondito:
Inverti direzione asse Y: poiché l'asse Y mostra la posizione media, l'inversione fa sì che l'1 sia in alto.
Per la maggior parte dei grafici aziendali, la posizione migliore è nell'angolo in alto a destra, in modo che sia più intuitivo invertire l'asse Y quando viene utilizzato per visualizzare la posizione media.
Scala logaritmica: una scala logaritmica è un modo per visualizzare i dati numerici su un intervallo molto ampio di valori in maniera compatta; lo spostamento di un'unità di distanza lungo la scala indica che il numero è stato moltiplicato per 10. L'utilizzo della scala logaritmica per entrambi gli assi vi consente di comprendere meglio le query che si trovano nelle estremità del grafico (CTR molto basso, posizione media o entrambe).
Linee di riferimento: la linea di riferimento è molto utile per evidenziare valori superiori o inferiori a una determinata soglia. Osservando la media, la mediana o un determinato percentile è possibile richiamare l'attenzione sulle deviazioni dal pattern.
Bolle
Ogni bolla del grafico rappresenta una singola query e, per rendere più utile il grafico, abbiamo utilizzato due proprietà di stile:
Dimensioni: l'utilizzo del numero di clic come dimensione della bolla vi consente di vedere a colpo d'occhio quali query generano la maggior parte del traffico; più è grande la bolla, maggiore è il traffico generato dalla query.
Colore: l'uso della categoria del dispositivo come colore della bolla vi aiuta a comprendere le differenze tra le prestazioni nella Ricerca da dispositivi mobili e computer. Potete utilizzare qualsiasi dimensione come colore ma, man mano che aumenta il numero di valori, è più difficile riconoscere i pattern.
Analizzare i dati
L'obiettivo di questa visualizzazione è aiutare a mostrare le opportunità di ottimizzazione delle query. Il grafico mostra le prestazioni delle query, dove l'asse Y rappresenta la posizione media, l'asse X il CTR, mentre la dimensione delle bolle rappresenta il numero totale di clic e il colore delle bolle rappresenta la categoria del dispositivo.
Le linee di riferimento rosse mostrano la media di ciascuno degli assi, che divide il grafico in quadranti, mostrando quattro tipi di prestazioni delle query. È probabile che i vostri quadranti abbiano un aspetto diverso da quello condiviso in questo post; dipende da come vengono distribuite le query del sito.
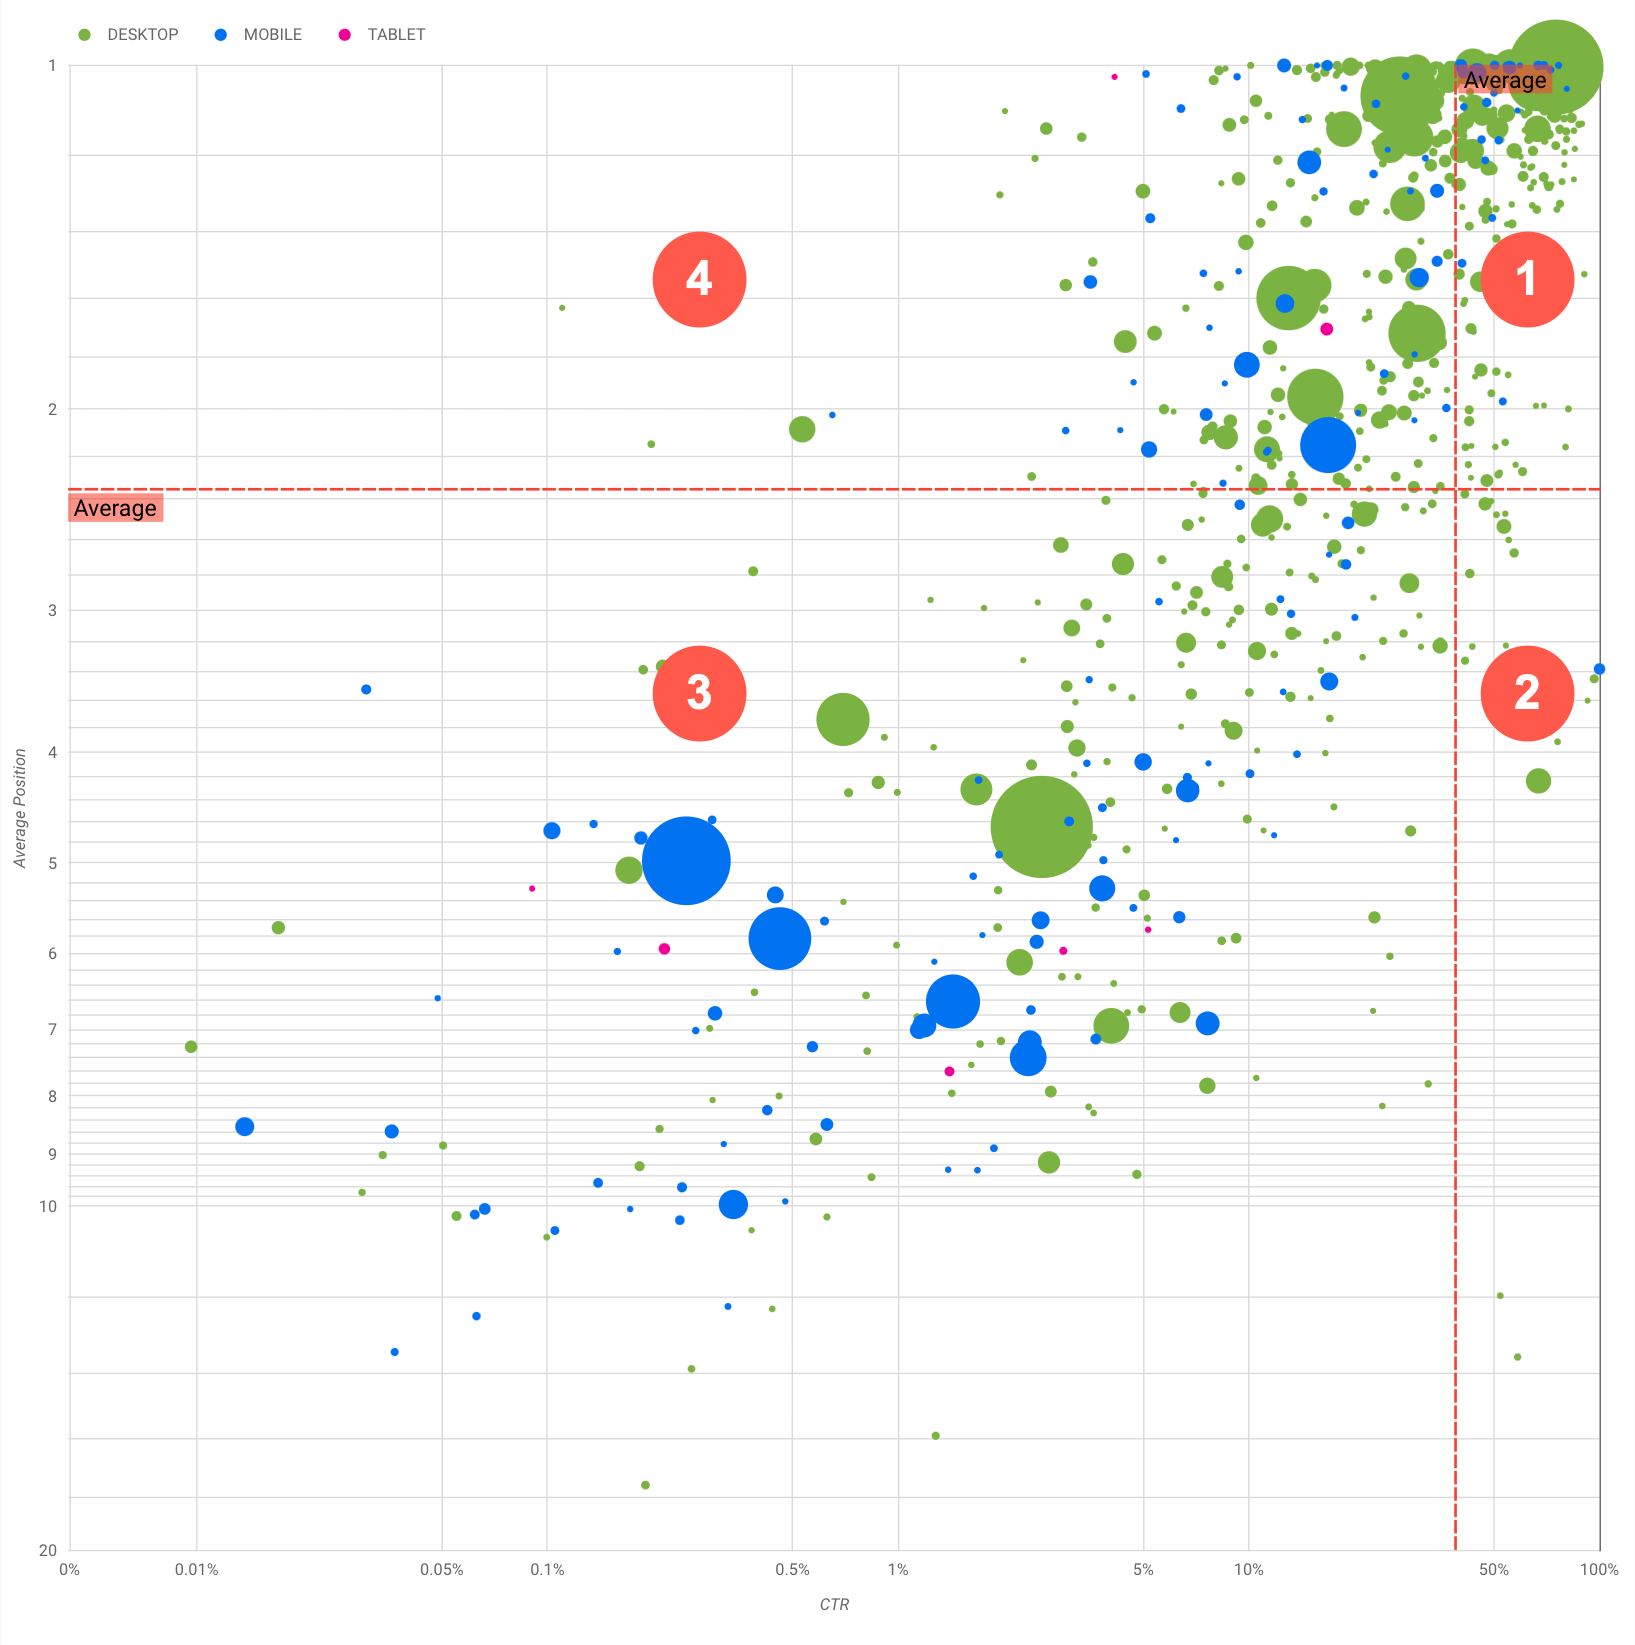
In generale, il grafico mostra quattro gruppi che potete analizzare per decidere su cosa concentrarvi quando ottimizzate le prestazioni delle query.
Posizione superiore, CTR elevato: non c'è molto da fare per queste query, state già facendo un ottimo lavoro.
Posizione bassa, CTR elevato: le query sembrano pertinenti agli utenti; ottengono un CTR elevato anche con un ranking inferiore alla query media sul vostro sito web. Potrebbero dare un contributo significativo se la loro posizione migliorasse, pertanto investite nella loro ottimizzazione.
Posizione bassa, CTR basso: quando analizzate le query con un CTR basso (questo e il punto successivo), è particolarmente interessante esaminare le dimensioni delle bolle per capire quali query hanno un CTR basso, ma generano comunque un traffico significativo. Anche se potrebbe sembrare inutile impegnarsi per le query in questo quadrante, possono essere divise in due gruppi principali:
Query correlate: se la query in questione è importante per voi, per prima cosa dovrebbe già comparire nella Ricerca.
Date la priorità a queste query anziché a quelle che non vengono mostrate nei risultati della Ricerca, dato che saranno più facili da ottimizzare.
Query non correlate: se la query non è correlata al vostro sito, potrebbe essere una buona occasione per ottimizzare i contenuti in modo da concentrarvi sulle query che generano traffico pertinente.
Posizione superiore, CTR basso: queste query potrebbero avere un CTR basso per vari motivi. Dovreste controllare le bolle più grandi per individuare segni di quanto segue:
I vostri concorrenti potrebbero avere un markup dei dati strutturati e vengono mostrati con risultati avanzati, il che potrebbe portare gli utenti a fare clic sui loro risultati anziché sui vostri. Valutate la possibilità di attivare le funzionalità dei risultati della Ricerca per il vostro sito.
Potreste aver ottimizzato (oppure il ranking è stato accidentalmente ottimizzato) per una query che non interessa gli utenti in relazione al vostro sito.
Gli utenti potrebbero aver già trovato le informazioni di cui avevano bisogno, ad esempio l'orario di apertura, l'indirizzo o il numero di telefono della vostra azienda.
Ottimizzare le prestazioni del sito web
Una volta individuate query utili per cui valga la pena investire tempo e risorse, assicuratevi di ottimizzarle con l'aiuto della Guida introduttiva alla SEO. Ecco alcuni suggerimenti:
Assicuratevi che gli elementi title, i tag meta description e gli attributi alt siano descrittivi, specifici e precisi.
Utilizzate gli elementi di intestazione per mettere in evidenza il testo importante e contribuire a creare una struttura gerarchica per i contenuti, aiutando sia gli utenti che i motori di ricerca a navigare con più facilità nel documento.
Aggiungete il markup dei dati strutturati per descrivere i contenuti ai motori di ricerca e per essere idonei a visualizzarli in modi utili (e accattivanti) nei risultati di ricerca.
Pensate a quali termini potrebbe cercare un utente per trovare uno dei vostri contenuti. Potete utilizzare lo Strumento di pianificazione delle parole chiave fornito da Google Ads per scoprire nuove varianti di parole chiave e conoscere il volume di ricerca approssimativo per ognuna di queste. Potete anche utilizzare Google Trends per trovare idee da query o argomenti in crescita correlati al vostro sito web.
[[["Facile da capire","easyToUnderstand","thumb-up"],["Il problema è stato risolto","solvedMyProblem","thumb-up"],["Altra","otherUp","thumb-up"]],[["Mancano le informazioni di cui ho bisogno","missingTheInformationINeed","thumb-down"],["Troppo complicato/troppi passaggi","tooComplicatedTooManySteps","thumb-down"],["Obsoleti","outOfDate","thumb-down"],["Problema di traduzione","translationIssue","thumb-down"],["Problema relativo a esempi/codice","samplesCodeIssue","thumb-down"],["Altra","otherDown","thumb-down"]],[],[[["\u003cp\u003eThis blog post provides tips and techniques using a bubble chart in Data Studio to analyze website search performance and identify optimization opportunities.\u003c/p\u003e\n"],["\u003cp\u003eThe bubble chart visualizes query performance by showing average position, click-through rate, total clicks (bubble size), and device category (bubble color).\u003c/p\u003e\n"],["\u003cp\u003eThe chart helps identify four types of queries: top-performing, high-CTR but low-ranking, low-CTR and low-ranking, and high-ranking but low-CTR, offering optimization strategies for each.\u003c/p\u003e\n"],["\u003cp\u003eOptimization tips include improving title tags, meta descriptions, headings, structured data, and keyword research using tools like Keyword Planner and Google Trends.\u003c/p\u003e\n"],["\u003cp\u003eUsers can leverage a provided Data Studio template to connect to their Search Console data and customize the analysis according to their needs.\u003c/p\u003e\n"]]],["This blog post explains how to use a bubble chart to analyze Google Search performance data. The chart visualizes query performance, with average position on the y-axis, CTR on the x-axis, click volume as bubble size, and device category as bubble color. Users can customize the data with filters like date range, query, country, and device. The chart identifies four query performance groups to target for optimization: high or low position and CTR. Optimization tips include improving titles, descriptions, structured data, and keyword research.\n"],null,["# Optimizing website performance with a Search Console bubble chart\n\nWednesday, April 06, 2022\n| It's been a while since we published this blog post. Some of the information may be outdated (for example, some images may be missing, and some links may not work anymore). Check out the new documentation on [improving SEO with a Search Console bubble chart](/search/docs/monitor-debug/bubble-chart-analysis).\n\n\nAnalyzing Search performance data is always a challenge, but even more so when you have plenty of long-tail queries,\nwhich are harder to visualize and understand. In this post, we'll provide tips to help you uncover opportunities to\noptimize your site's Google Search performance.\n\n\nIf you haven't read our recent posts on [connecting Search Console to Data Studio](/search/blog/2022/03/connecting-data-studio)\nand [monitoring Search traffic with Data Studio](/search/blog/2022/03/monitoring-dashboard),\nconsider checking them out to understand more about what you can do with Search Console in Data Studio.\n\n\nToday we'll discuss a [bubble chart](https://support.google.com/datastudio/answer/7207785)\nthat can help you understand which queries are performing well for your site, and which could be improved. We'll first\nexplain the main elements in the chart, describing specific settings and how they influence the data. Then we'll provide\nsome pointers on what to look for when analyzing the data.\n\n\nStarting with the good news: you don't need to build the chart from scratch, you can use\n[this template](https://datastudio.google.com/reporting/1e5b5f6a-38d7-4547-a54b-69594681a09b/page/xFbeC/preview), connect to your data,\nand tweak any settings you want.\n\n\n*Without further ado...*\n\nUnderstanding the chart\n-----------------------\n\n\nA **bubble chart** is a great visualization when you have multiple metrics and dimensions because it enables you to see\nrelationships and patterns in your data more effectively. In the example shown here, you can see traffic attributes\n(click-through rate (CTR), [average position](https://support.google.com/webmasters/answer/7042828#position))\nand volume (total [clicks](https://support.google.com/webmasters/answer/7042828#click)) for different dimensions (query, device) at the same time.\n\n\nWe'll go through some of the chart elements to clarify what it shows, and what it doesn't.\n\n### Data source\n\n\nFor this chart, we're using the **Site Impression** table available through the [Search Console data source](https://support.google.com/datastudio/answer/7314895), which includes [Search\nperformance data](https://support.google.com/webmasters/answer/7576553) aggregated by site and queries.\n\n### Filters and data controls\n\n\nIn order to make it easy for you to control your data effectively, we included five customization options in the chart:\n\n1. **[Data control](https://support.google.com/datastudio/answer/7415591)**: Choose the Search Console property you'd like to analyze.\n2. **Date range**: Choose the date range you'd like to see in the report; by default you'll see the last 28 days.\n3. **Query** : Include or exclude queries to focus on. You can [use regular\n expressions](/search/blog/2021/06/regex-negative-match) similar to the way you use them in Search Console.\n4. **Country**: Include or exclude countries.\n5. **Device**: Include or exclude device categories.\n\n### Axes\n\n\nThe axes in the chart are **Average position** (y-axis) and **Site CTR** (x-axis), but we made three significant transformations\nto make the chart more insightful:\n\n- **Reverse y-axis direction**: Since the y-axis shows average position, inverting it means that 1 is at the top. For most business charts, the best position is in the top right corner, so it is more intuitive to invert the y-axis when using it to display average position.\n- **Log scale** : A [logarithmic scale](https://en.wikipedia.org/wiki/Logarithmic_scale) is \"a way of displaying numerical data over a very wide range of values in a compact way (...) moving a unit of distance along the scale means the number has been multiplied by 10\". Using log scale for both axes enables you to have a better understanding of queries that are in the extremities of the chart (very low CTR, average position, or both).\n- **[Reference lines](https://support.google.com/datastudio/answer/9921462)**: The reference line is very helpful to highlight values that are above or below a certain threshold. Looking at the average, median, or a certain percentile can call attention to deviations from the pattern.\n\n### Bubbles\n\n\nEach bubble in the chart represents a single query, and in order to make the chart more useful, we used two\n[style properties](https://support.google.com/datastudio/answer/7207785#style-properties):\n\n- **Size**: Using the number of clicks as the bubble size helps you see in a glance which queries are driving the bulk of the traffic --- the larger the bubble the more traffic the query generates.\n- **Color**: Using the device category as the bubble color helps you understand the differences between mobile and desktop Search performance. You can use any dimension as the color, but as the number of values increases, the harder it is to recognize patterns.\n\nAnalyzing the data\n------------------\n\n\nThe goal of this visualization is to help surface query optimization opportunities. The chart shows query performance, where\nthe y-axis represents **average position** , the x-axis represents **CTR** , the bubble size represents total number of\n**clicks** , and the bubble color represents **device category**.\n\n\nThe red reference lines show the average for each of the axes, which split the chart into quadrants, showing four types of\nquery performance. Your quadrants are likely to look different than the one shared in this post; they'll depend on how your\nsite queries are distributed.\n\n\nIn general, the chart will show four groups you can analyze to help you decide where to invest your time when optimizing your query performance.\n\n1. **Top position, high CTR**: There's not much you need to do for those; you're doing a great job already.\n2. **Low position, high CTR** : Those queries seem relevant to users; they get a high CTR even when ranking lower than the average query on your website. They could represent a significant contribution if their position goes up --- *invest in optimizing them!*\n3. **Low position, low CTR** : When looking at queries with low CTR (this and the next bullet), it's especially interesting to look at the bubble sizes to understand which queries have a low CTR but are still driving significant traffic. While the queries in this quadrant might seem unworthy of your effort, they can be divided into two main groups:\n - *Related queries*: If the query in question is important to you, it's a good start to have it appearing in Search already. Prioritize these queries over queries that are not appearing in Search results at all, as they'll be easier to optimize.\n - *Unrelated queries*: If the query is unrelated to your site, maybe it's a good opportunity to fine-tune your content to focus on queries that will bring relevant traffic.\n4. **Top position, low CTR** : Those queries might have a low CTR for various reasons. You should check the largest bubbles to find signs of the following:\n - Your competitors may have structured data markup and are showing up with rich results, which might attract users to click their results instead of yours. Consider [enabling Search result\n features for your site](/search/docs/appearance/search-result-features).\n - You may have optimized, or be \"accidentally\" ranking, for a query that users are not interested in relation to your site.\n - Users may have already found the information they needed, for example your company's opening hours, address, or phone number.\n\nOptimizing your website performance\n-----------------------------------\n\n\nOnce you find queries that are worth the time and effort, make sure to optimize for them with the help of the\n[SEO starter guide](/search/docs/fundamentals/seo-starter-guide). Here are some tips:\n\n- Ensure that your [`title`](/search/docs/appearance/title-link#page-titles) elements, [description `meta` tags](/search/docs/appearance/snippet#meta-descriptions), and `alt` attributes are descriptive, specific, and accurate.\n- Use heading elements to emphasize important text and help create a hierarchical structure for your content, making it easier for users and search engines to navigate through your document.\n- Add [structured data markup](/search/docs/appearance/structured-data/intro-structured-data) to describe your content to search engines and be eligible to display your content in useful (and eye-catching) ways in search results.\n- Think about the words that a user might search for to find a piece of your content. You can use the [Keyword Planner](https://ads.google.com/home/tools/keyword-planner/) provided by Google Ads to help you discover new keyword variations and see the approximate search volume for each keyword. You can also use [Google Trends](https://trends.google.com/trends/) to find ideas from rising topics and queries related to your website.\n\nFeedback\n--------\n\n\nAs always, let us know if you have any questions through the [Google\nSearch Central Community](https://support.google.com/webmasters/threads?thread_filter=(category:search_console)) or the [Data Studio Community](https://support.google.com/datastudio/threads?thread_filter=(category:connect_to_data)).\nAlso, if you're on Twitter, make sure to [follow us](https://twitter.com/googlesearchc), as we'll announce future posts over there.\n\nPosted by [Daniel Waisberg](https://www.danielwaisberg.com), Search Advocate"]]