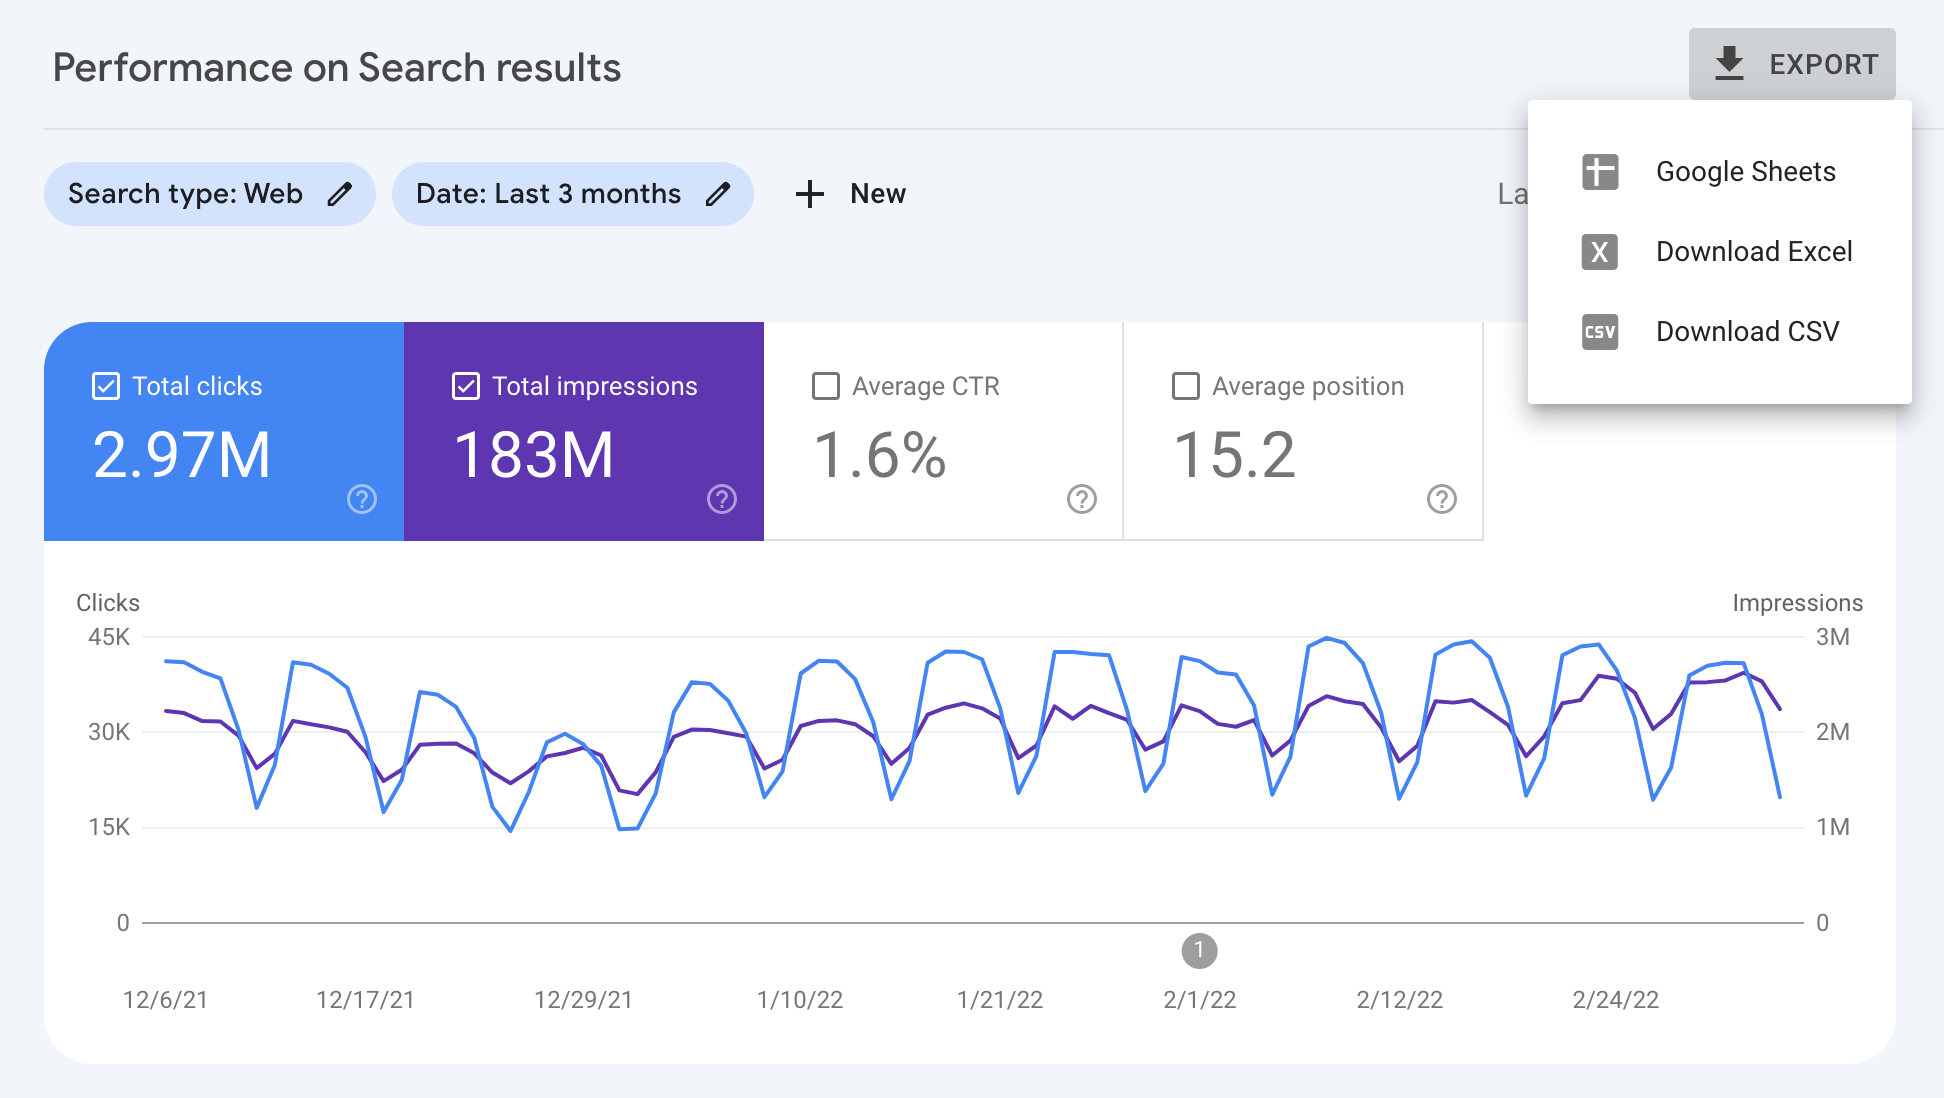
Google Search Console 能讓您深入分析網站在 Google 搜尋中的成效,但理解這些資料可能並不容易。如果您在自訂資訊主頁中設定顯示對您有用的資料圖表,這可能可以協助您運用資料提升決策品質。本文是一系列文章的第一篇,這系列文章的重點在於如何使用 Google 數據分析匯出、強化及視覺化 Search Console 資料。
今天這篇文章會說明如何將 Search Console 資料導入到 Google 數據分析。我們會提供範例,說明如何將 Search Console 資料下載至 Google 試算表、搭配地理區域強化資料,以及將試算表連結至數據分析。
我們會在日後貼文中說明如何建立資料圖表,協助您監控及分析資料。
準備資料並連結至數據分析
如要將 Search Console 資料匯入到數據分析,可以採用以下兩種做法:
如果您希望在這裡顯示與 Search Console 中相同的資料,建議使用 Google 數據分析資料連接器。做法很簡單:請前往連接器資料庫,選擇 Search Console,然後找到要連結的資源。您可在數據分析說明中心找到連接器指南。
如要強化 Search Console 提供的資料 (例如將國家/地區分成多個區域),請先從網頁介面或透過 API 匯出資料。接著您可以透過 Google 試算表或 BigQuery 處理資料,並將其連結至數據分析。
[[["容易理解","easyToUnderstand","thumb-up"],["確實解決了我的問題","solvedMyProblem","thumb-up"],["其他","otherUp","thumb-up"]],[["缺少我需要的資訊","missingTheInformationINeed","thumb-down"],["過於複雜/步驟過多","tooComplicatedTooManySteps","thumb-down"],["過時","outOfDate","thumb-down"],["翻譯問題","translationIssue","thumb-down"],["示例/程式碼問題","samplesCodeIssue","thumb-down"],["其他","otherDown","thumb-down"]],[],[[["\u003cp\u003eThis post explains how to export, enhance, and visualize Search Console data using Google Data Studio for better website performance analysis.\u003c/p\u003e\n"],["\u003cp\u003eYou can directly connect Search Console to Data Studio or enhance the data by exporting it to Google Sheets for adding custom information like geographical regions.\u003c/p\u003e\n"],["\u003cp\u003eThis post focuses on enhancing Search Console data in Google Sheets by adding geographical regions using IMPORTDATA and VLOOKUP functions and then connecting it to Data Studio.\u003c/p\u003e\n"],["\u003cp\u003eFuture posts will cover creating data visualizations in Data Studio for monitoring and analyzing your website's search traffic data.\u003c/p\u003e\n"],["\u003cp\u003eEngage with the Google Search Central or Data Studio communities for questions and follow Google Search Central on Twitter for future updates.\u003c/p\u003e\n"]]],["This guide details how to enhance and visualize Google Search Console data in Google Data Studio. It outlines two methods for importing data: directly via the Data Studio connector or by first exporting and manipulating the data. The preferred method involves exporting Search Console data to Google Sheets, enriching it (e.g., adding geographical regions using the `IMPORTDATA` and `VLOOKUP` functions), and then connecting the enhanced spreadsheet to Data Studio for custom visualizations. The next steps include monitoring the data using Data studio.\n"],null,["# Connecting Search Console to Data Studio\n\nTuesday, March 08, 2022\n\n\n[Google Search Console](https://goo.gle/searchconsole) gives you insight into your website performance in Google Search,\nbut understanding your data can be a challenge. If you set up a custom dashboard with data visualizations that work for **you** , it might help you\nmake better decisions that are supported by data. This post is the first in a series of posts that will focus on exporting, enhancing, and visualizing\nSearch Console data using [Google Data Studio](https://support.google.com/datastudio/answer/6283323).\n\n\nIn today's post, we'll discuss how to bring your Search Console data into Google Data Studio. We'll show an example where we download Search Console data\ninto Google Sheets, enhance the data with geographical regions, and connect the spreadsheet to Data Studio.\n\n\nIn future posts, we'll discuss how to create data visualizations to help you monitor and analyze your data.\n\nPrepare the data and connect to Data Studio\n-------------------------------------------\n\n\nIn order to import Search Console data into Data Studio, there are two roads you can take:\n\n- If you are happy to see the same data as you see in Search Console, you should use the Google Data Studio data connector. This option is straightforward: visit the [connector gallery](https://datastudio.google.com/data), choose Search Console, and find the property you'd like to connect. You can find a guide to the connector in the [Data Studio Help Center](https://support.google.com/datastudio/answer/7314895).\n- If you'd like to enhance the data provided by Search Console (for example, clustering countries into regions), you should first export the data from the web interface or through the API. Then, you can manipulate the data with Google Sheets or BigQuery and connect it to Data Studio.\n\n\nIn this post we'll discuss the second option, since it requires more steps and offers more customization opportunities. There are three main steps you need to take:\n\n1. Export Search Console data.\n2. Add your own data on top of it.\n3. Import it into Data Studio.\n\n### Export Search Console data\n\n\nIn order to export your data, visit the Search Console [Performance report](https://search.google.com/search-console/performance/search-analytics),\nchoose a date range, click **Export** , and choose Google Sheets. This will create a new spreadsheet, which we'll enhance in the next step. You can also use\nthe [Search Analytics API](/webmaster-tools/v1/searchanalytics/query) for a more automated solution, but that's\nout of scope for this post.\n\n\nYou can read more about the dimensions and metrics that will be available to you in the [Performance\nreport help documentation](https://support.google.com/webmasters/answer/7576553#dimensions).\n\n### Enhance Search Console data\n\n\nTo show how to enhance your Search Console data, we'll use a neat Google Sheets function, [IMPORTDATA](https://support.google.com/docs/answer/3093335),\nwhich can import data from a URL. In our example, we're importing the\n[ISO 3166 countries by region](https://gist.githubusercontent.com/richjenks/15b75f1960bc3321e295/raw/62749882ed0e9dffa3edd7a9a44a7be59df8402c/countries.md) table.\n\n\nAdd a new sheet to the data you exported from Search Console and enter the following code to the first cell: \n\n```text\n=IMPORTDATA(\"https://gist.githubusercontent.com/richjenks/15b75f1960bc3321e295/raw/62749882ed0e9dffa3edd7a9a44a7be59df8402c/countries.md\", \"|\")\n```\n\n\nIn the Search Console sheet, create a column for **Region** and use the [VLOOKUP](https://support.google.com/docs/answer/3093318)\nfunction to match the regions to the countries.\n\n\nHere is a [sample sheet](https://docs.google.com/spreadsheets/d/1WoyovWWCLq9uaYfnsICL4uMQMApaoNhjMf8U4nl0ZHQ/) showing how the final table would look.\n\n\n*Embedded: Table showing Search Console data enhanced with country regions*\n\n\nEven though we're using an example to enhance the geographical data, you can use the same process to add any type of information. For example, if you have a query classification,\nyou could use that to group queries into categories.\n\n### Connect Google Sheets to Data Studio\n\n\nFinally, connect your Google Sheets to Data Studio. To do this, visit the [connector gallery](https://datastudio.google.com/data),\nchoose Google Sheets, and find your newly created spreadsheet; but make sure to choose the right sheet.\n\n\nOnce the data is in Data Studio, the visualization work begins...\n\nNext\n----\n\n\nIn the next post in this series, [Monitoring Search traffic (and more!) with Data Studio](/search/blog/2022/03/monitoring-dashboard), we'll discuss different types of dashboards and provide step-by-step examples for you to follow along.\n\n\nAs always, let us know if you have any questions through the [Google\nSearch Central Community](https://support.google.com/webmasters/threads?thread_filter=(category:search_console)) or the [Data Studio Community](https://support.google.com/datastudio/threads?thread_filter=(category:connect_to_data)).\nAlso, if you're on Twitter, make sure to [follow us](https://twitter.com/googlesearchc); we'll announce future posts over there - *stay tuned!*\n\nPosted by [Daniel Waisberg](https://www.danielwaisberg.com), Search Advocate"]]