شرح تفصيلي حول فلترة بيانات الأداء في Search Console والقيود المطبّقة عليها
تنظيم صفحاتك في مجموعات
يمكنك حفظ المحتوى وتصنيفه حسب إعداداتك المفضّلة.
الأربعاء 19 تشرين الأول (أكتوبر) 2022
إنّ بيانات أداء "بحث Google" هي الأكثر استخدامًا في Search Console من خلال كل من
تقرير الأداء
وSearch Analytics API.
تشرح هذه المشاركة بالتفصيل البيانات المتوفّرة وطريقة Google في معالجتها، بما في ذلك فلاتر
حماية الخصوصية وقيود أخرى متعلقة بوقت استجابة العرض وسعة التخزين وموارد المعالجة.
هل تساءلت يومًا عن آلية عمل هذه الأنظمة؟ في ما يلي شرح تفصيلي
عنها.
يتضمّن تقرير الأداء أربعة مقاييس تُظهر كيفية تغيُّر عدد الزيارات إلى موقعك الإلكتروني بمرور الوقت.
وقد أعددنا مقالة تصف آلية احتساب كل مقياس،
وفي ما يلي ملخَّص عن ذلك:
النقرات: عدد نقرات المستخدمين من نتائج بحث Google التي أدّت إلى الانتقال إلى موقعك الإلكتروني
مرّات الظهور: عدد المرات التي رأى فيها المستخدمون موقعك الإلكتروني في نتائج البحث على Google
نسبة النقر إلى الظهور (CTR): عدد النقرات مقسومًا على عدد مرّات الظهور
الترتيب: متوسط موضع عنوان URL أو طلب البحث أو الموقع الإلكتروني بشكل عام في نتائج البحث
يمكن تحليل كل من هذه المقاييس لمعرفة أداء سمات مختلفة. ويمكنك الاطّلاع على أداء كل من طلبات البحث
أو الصفحات أو البلدان أو الأجهزة أو أشكال الظهور في البحث التي تجذب الزيارات إلى موقعك الإلكتروني.
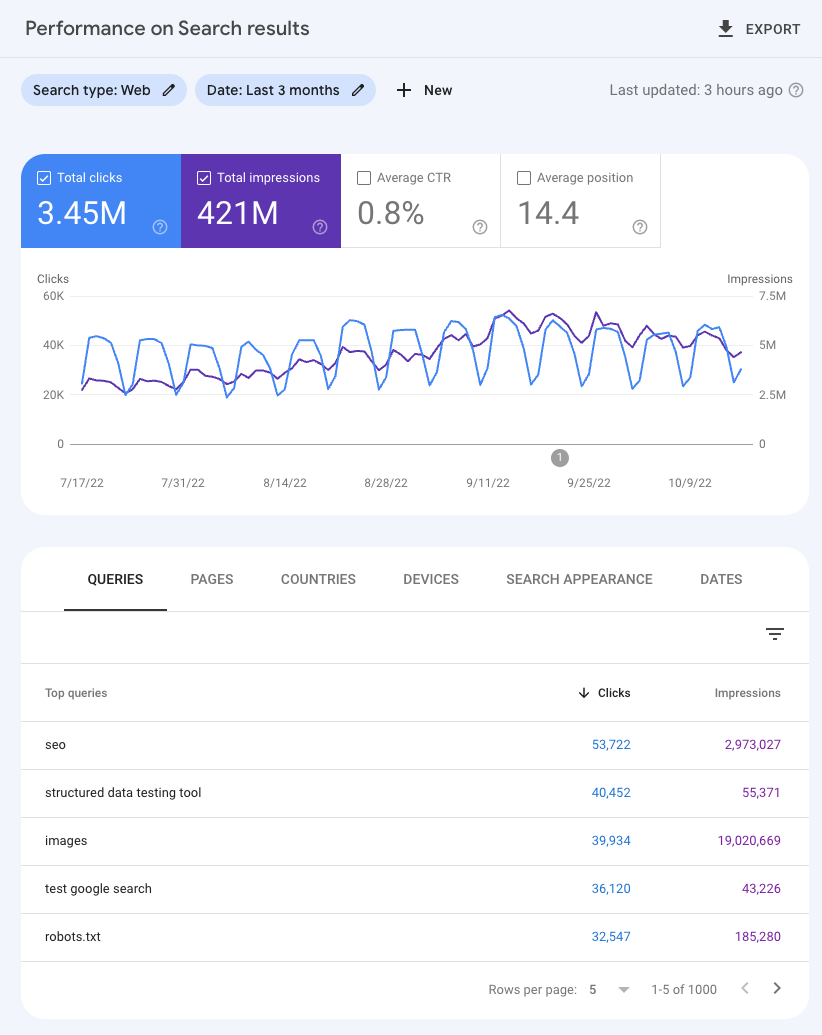
إذا كنت تستخدم واجهة المنتج، تتوفّر السمات من خلال الفلاتر
أو من خلال جداول السمات التي تلي الرسم البياني، كما هو موضّح في الصورة أدناه.
يمكن استخدام هذه البيانات للعثور على طرق تساعد في تعزيز ظهور موقعك الإلكتروني، وبالتالي زيادة عدد الزيارات الواردة
من نتائج البحث على Google. يمكنك الاطّلاع على هذا النموذج من الرسم البياني لتحسين الأداء
لمعرفة نوع التحليل الذي يمكنك إجراؤه.
فلترة البيانات والقيود المطبّقة عليها
يتم تجميع البيانات وفلترتها بطرق مختلفة في كل من
واجهة التقرير والبيانات المصدَّرة. يمكنك الاطّلاع أدناه على قيدَين رئيسيَين يتم تطبيقهما على البيانات، وهما فلاتر حماية الخصوصية والحد الأقصى لصفوف البيانات اليومية.
فلاتر حماية الخصوصية
لا يتم تضمين بعض طلبات البحث (المُشار إليها بطلبات البحث المخفية الهوية) ضمن البيانات في Search Console لحماية
خصوصية المستخدم الذي يُجري طلب البحث.
إنّ طلبات البحث المخفية الهوية هي تلك التي لا تصدر عن أكثر من بضع عشراتٍ من المستخدمين
على مدار شهرين أو ثلاثة أشهر. ولحماية الخصوصية، لن تظهر طلبات البحث الفعلية ضمن بيانات الأداء في "بحث Google".
ولهذا السبب، نشير إليها باسم "طلبات البحث المخفية الهوية". بالرغم من أنّ طلبات البحث المخفية الهوية تُحذَف دائمًا من الجداول،
إلا أنّها تُحتسَب ضمن القيم الإجمالية في الرسم البياني، إلا إذا أجريت فلترة حسب طلب البحث.
سيوضّح لك المثال التالي هذا الموضوع. جدير بالذكر أنّ هذا المثال التوضيحي يأخذ في الاعتبار فقط
فلاتر حماية الخصوصية، ولكن قد يؤدي الحد الأقصى لصفوف البيانات اليومية دورًا أيضًا في تلك البيانات. تتم مناقشة هذا الحد في القسم التالي،
لذا ننصحك بمواصلة القراءة لمعرفة المزيد من المعلومات. لنفترض أنّ الجدول أدناه يُظهر كل الزيارات الخاصة بطلبات البحث لموقعك الإلكتروني،
ويعرض تقسيمًا لعدد الزيارات من طلبات البحث غير المخفية الهوية. عادةً، يكون للموقع الإلكتروني
أكثر من أربعة تقسيمات لطلبات البحث غير المخفية الهوية بالطبع، ولكن لأغراض هذا المثال،
سنفترض أنّ للموقع الإلكتروني فقط أربعة طلبات بحث مقسّمة.
طلبات البحث
النقرات
أدب كلاسيكي
150
شِعر
125
خيال علمي
100
أدب غير خيالي
75
إجمالي طلبات البحث المقسّمة
450
الإجمالي الكلي
550
عند جمع كل طلبات البحث المقسّمة، كما هو موضّح في الرسم البياني، سيتبيّن أنّ هناك 450 نقرة. ويبلغ أيضًا
إجمالي عدد النقرات الكلي على الموقع الإلكتروني 550 نقرة. هذا الرقم هو أعلى لأنّه يشمل كل النقرات المقسّمة
بالإضافة إلى النقرات من طلبات البحث المخفية الهوية غير المدرجة ضمن القائمة.
من الناحية العملية، قد تلاحظ عند استخدام تقارير Search Console هذا النوع من الفروقات بطريقتَين رئيسيتَين.
ليس هناك صف لطلبات البحث المخفية الهوية في جدول التقرير أو واجهة برمجة التطبيقات (التي تمت إضافتها
هنا لأغراض توضيحية)، لذا عند جمع كل أعداد النقرات في كل الصفوف، لن تساوي النتيجة عدد
النقرات نفسه المبيّن في القيم الإجمالية للرسم البياني. على سبيل المثال، سترى في الحالة الموضّحة هنا نتيجة 450 نقرة عند جمع كل الصفوف، ولكن سيظهر إجمالي
550 نقرة في القيم الإجمالية للرسم البياني.
يتم حذف طلبات البحث المخفية الهوية عندما يتم تطبيق فلتر، لذا سيكون هناك فرق
عند مقارنة مجموع النقرات في القيم الإجمالية للرسم البياني بمجموع النقرات التي تتضمّن some_string
ولا تتضمّن some_string. في هذه الحالة، عند استخدام فلاتر لتضمين طلبات بحث تتضمّن كلمة "خيال" فقط،
سترى 175 نقرة، وعند استثناء الطلبات التي تحتوي على كلمة "خيال"، سترى 275 نقرة، وسيكون المجموع 450 نقرة،
بينما يكون المجموع في الرسم البياني 550 نقرة.
الحد الأقصى لصفوف البيانات اليومية
بسبب القيود المتعلقة بوقت استجابة العرض وسعة التخزين وموارد المعالجة وغير ذلك،
هناك حد لمقدار البيانات التي يمكن عرضها أو تصديرها في Search Console. لا تؤثّر هذه الحدود في
غالبية المواقع الإلكترونية في Search Console. قد يتأثّر عدد قليل من المواقع الإلكترونية الكبيرة جدًا بهذه الحدود،
ولكن حتى بالنسبة إلى هذه المواقع، نرى أنّ حجم البيانات المتبقية سيكون كبيرًا بشكل يكفي لإنشاء عيّنة تمثيلية من البيانات.
الحد الأقصى لعدد الصفوف الذي يمكنك تصديره من خلال واجهة المستخدم في Search Console هو 1,000 صف.
وفي الوقت الحالي، الحد الأقصى للبيانات التي يمكن تصديرها من خلال Search Analytics API
(ومن خلال أداة Looker Studio لربط البيانات)
هو 50,000 صف في اليوم للموقع الإلكتروني الواحد لكل نوع بحث، وهو حد قد لا يتم بلوغه في كل الأحوال. والعدد التلقائي
الذي سيُعرض من خلال واجهة برمجة التطبيقات سيكون 1,000 صف، ولكن يمكنك استخدام rowLimit لزيادة هذا العدد إلى 25,000، ويمكنك
استخدام startRow لسحب صفوف البيانات من 25,001 إلى 50,000 من خلال عملية تقسيم البيانات على عدّة صفحات. يمكنك الاطّلاع على هذا الدليل
لمعرفة كيفية الحصول على البيانات المتاحة.
بالنسبة إلى الطلبات التي لا تتضمّن سماتٍ لطلبات البحث أو عناوين URL، مثل البلدان والأجهزة وأشكال الظهور
في البحث، ستعرض Search Console كل البيانات وتصدّرها.
المراجع والملاحظات
إذا أردت معرفة المزيد من المعلومات عن هذا الموضوع، ننصحك بقراءة مستند تقرير الأداء
الذي يوفّر شرحًا تفصيليًا حول البيانات المتاحة وكيفية استخدام تقرير الأداء،
بالإضافة إلى تفاصيل إضافية حول أنواع الفروقات التي قد تصادفها في الرسومات البيانية.
[[["يسهُل فهم المحتوى.","easyToUnderstand","thumb-up"],["ساعَدني المحتوى في حلّ مشكلتي.","solvedMyProblem","thumb-up"],["غير ذلك","otherUp","thumb-up"]],[["لا يحتوي على المعلومات التي أحتاج إليها.","missingTheInformationINeed","thumb-down"],["الخطوات معقدة للغاية / كثيرة جدًا.","tooComplicatedTooManySteps","thumb-down"],["المحتوى قديم.","outOfDate","thumb-down"],["ثمة مشكلة في الترجمة.","translationIssue","thumb-down"],["مشكلة في العيّنات / التعليمات البرمجية","samplesCodeIssue","thumb-down"],["غير ذلك","otherDown","thumb-down"]],[],[[["\u003cp\u003eGoogle Search Console's Performance report provides data on clicks, impressions, CTR, and position to analyze website search traffic.\u003c/p\u003e\n"],["\u003cp\u003eSearch performance data can be accessed via the product interface, Search Analytics API, Looker Studio Connector, and manual spreadsheet downloads.\u003c/p\u003e\n"],["\u003cp\u003eData is subject to privacy filtering, meaning some queries are anonymized to protect user privacy and may lead to discrepancies in total click counts.\u003c/p\u003e\n"],["\u003cp\u003eA daily data row limit exists for exported data, capped at 1,000 rows via the user interface and 50,000 via the API or Looker Studio Connector.\u003c/p\u003e\n"],["\u003cp\u003eComprehensive resources and support are available through Google Search Central Community and Twitter for further assistance.\u003c/p\u003e\n"]]],["Google Search Console's Performance report provides data on clicks, impressions, CTR, and position, which can be analyzed across queries, pages, countries, devices, and search appearances. Access is available through the interface, API, Looker Studio, and spreadsheets. Data is filtered for user privacy, omitting anonymized queries from tables but including them in totals, and has limits of 1,000 rows via the interface or up to 50,000 via API per day.\n"],null,["# A deep dive into Search Console performance data filtering and limits\n\nWednesday, October 19, 2022\n\n\nGoogle Search performance data is the most widely used data in Search Console, both through the\n[Performance report](https://support.google.com/webmasters/answer/7576553)\nand the [Search Analytics API](/webmaster-tools/v1/searchanalytics/query).\nThis post explains in detail the data available and how Google processes it, including privacy\nfiltering and other limitations related to serving latency, storage, and processing resources.\nEver wonder how these systems work? Let's do a deep dive\ninto them.\n\n\nIf you're new to Search Console, check out the [introduction to Performance reports](https://support.google.com/webmasters/answer/10268906).\n\nSearch performance basics\n-------------------------\n\n\nThe Performance report contains four metrics that show how your search traffic changes over time.\nWe have an article describing [how each metric is calculated](https://support.google.com/webmasters/answer/7042828),\nand here's a summary:\n\n- Clicks: Count of user clicks from Google Search results to your property.\n- Impressions: Count of times users saw your property on Google search results.\n- CTR (Click-through rate): The click count divided by the impression count.\n- Position: The average position in search results for the URL, query, or for the website in general.\n\n\nEach of those metrics can be analyzed for different dimensions. You can check how each of the queries,\npages, countries, devices, or search appearances driving traffic to your website is performing.\n\n\nThere are many ways to access the Search performance data, including the\n[product interface](https://search.google.com/search-console/performance/search-analytics),\nthe [Search Analytics API](/webmaster-tools/v1/searchanalytics/query),\nthe [Looker Studio connector](/search/blog/2022/03/connecting-data-studio),\nand spreadsheets (requires manual download from the interface).\n\n\nIf you're using the product interface, the dimensions are available through the filters or through\nthe dimensions tables following the chart, as shown in the image below.\n\n\nThis data can be used to find ways to make your website more visible and ultimately get more traffic\nout of Google. For a sample of what type of analysis you can perform, check this\n[sample optimization chart](/search/blog/2022/04/performance-optimization-bubble-chart).\n\nData filtering and limits\n-------------------------\n\n\nBoth the data in the report interface and the data exported are aggregated and filtered in different\nways. Below are the two main limitations to the data: privacy filtering and daily data row limit.\n\n### Privacy filtering\n\n\nSome queries (called anonymized queries) are not included in Search Console data to protect the\nprivacy of the user making the query.\n\n\nAnonymized queries are those that aren't issued by more than a few dozen users over a two-to-three\nmonth period. To protect privacy, the actual queries won't be shown in the Search performance data.\nThis is why we refer to them as anonymized queries. While the actual anonymized queries are always\nomitted from the tables, they are included in chart totals, unless you filter by query.\n\n\nLet's look at an example to make it clearer - note that this is an illustration that takes into\naccount only privacy filtering, but daily data row limits, discussed in the next section, may also\nplay a role, read on to learn more. Let's say the table below shows all the traffic for queries to\nyour website, itemizing the traffic from non-anonymized queries. A typical website will generally\nhave more than four itemized non-anonymized queries, of course, but for purposes of this example,\nwe'll say it's just four that are itemized.\n\n|------------------------------|------------|\n| **Queries** | **Clicks** |\n| classic literature | 150 |\n| poetry | 125 |\n| science fiction | 100 |\n| non fiction | 75 |\n| *Total for itemized queries* | *450* |\n| *Total overall* | *550* |\n\n\nIf you add up all the itemized queries, as the chart shows, there were 450 clicks. There are also\n550 overall clicks to the site. That number is higher because it includes all the itemized clicks\nplus the clicks from anonymized queries, which aren't listed.\n\n\nIn practice, when using Search Console reporting, you may notice this type of discrepancy in two main ways.\n\n1. There is no row for anonymized queries in the report table or API (added here for illustration purposes), so if you sum up clicks for all the rows, you'll not find the same number of clicks as the chart totals. For example in this case you'd see 450 when you sum up the rows, but you'd see 550 in the chart totals.\n2. The anonymized queries are omitted whenever a filter is applied, so there will be a discrepancy if you compare the sum of clicks in the chart totals to the sum of clicks containing `some_string` and not containing `some_string`. In this case, if you use filters to include only queries that contain the word \"fiction\", you'll see 175 clicks, and if you exclude queries that contain the word \"fiction\", you'll see 275 clicks, summing up to 450 clicks, while in the chart total you'll see 550 clicks.\n\n### Daily data row limit\n\n\nDue to limitations related to serving latency, storage, processing resources, and others, Search\nConsole has a limit on the amount of data that can be displayed or exported. These limits won't affect\nthe majority of properties in Search Console. A few very large websites can be affected by this, but\neven for those we believe the remaining data will be large enough to create a representative sample of data.\n\n\nThe maximum you can export through the Search Console user interface is 1,000 rows of data.\nCurrently, the upper limit for the data exported through the [Search Analytics API](/webmaster-tools/v1/searchanalytics/query)\n(and through the [Looker Studio connector](/search/blog/2022/03/connecting-data-studio))\nis 50,000 rows per day per site per search type, which may not be reached in all cases. The default\nreturned by the API will be 1,000 rows, but you can use `rowLimit` to increase it to 25,000\nand `startRow` to pull the rows 25,001 to 50,000 using pagination. Check this guide to\nlearn [how to get the available data](/webmaster-tools/v1/how-tos/all-your-data).\n\n\nFor requests that don't involve query or URL dimensions, such as countries, devices, and Search\nAppearances, Search Console will display and export all the data.\n\nResources and feedback\n----------------------\n\n\nIf you'd like to learn more about the subject, read the [Performance documentation](https://support.google.com/webmasters/answer/7576553).\nYou'll find in-depth explanations about the available data, how to use the Performance report, and more\ndetails about discrepancies you may find in the charts.\n\n\nIf you have any questions or concerns, please reach out to us via the\n[Google Search Central Community](https://support.google.com/webmasters/threads?thread_filter=(category:search_console))\nor on [Twitter](https://twitter.com/googlesearchc).\n\nPosted by [Daniel Waisberg](https://www.danielwaisberg.com), Search Advocate"]]