تتبُّع عدد الزيارات الواردة من محرّك بحث Google (فضلاً عن مهام أخرى) باستخدام أداة "مركز البيانات"
تنظيم صفحاتك في مجموعات
يمكنك حفظ المحتوى وتصنيفه حسب إعداداتك المفضّلة.
الأربعاء 30 آذار (مارس) 2022
تعرض هذه المقالة كيفية إنشاء لوحة بيانات في أداة "مركز البيانات" لتتبُّع عدد الزيارات الواردة من محرّك بحث Google. تقدّم خدمة Search Console رسومات بيانية وإمكانات فلترة مبتكرة، لكنّ أداة "مركز البيانات" تتيح لك إمكانية تخصيص رسوماتك البيانية وعرضها جنبًا إلى جنب مع البيانات الأخرى، مثل بيانات "إعلانات Google" و"إحصاءات Google" وYouTube وBigQuery وغير ذلك. إذا فاتتك مقالتنا السابقة ضمن هذه السلسلة، يمكنك الاطّلاع عليها على صفحة ربط خدمة Search Console بأداة "مركز البيانات".
قبل الحديث بالتفصيل عن لوحات البيانات، لدينا أخبار سارة لمستخدمي أداة "مركز البيانات": اعتبارًا من اليوم، أصبحت أداة ربط البيانات في Search Console تتضمن بيانات حول عدد الزيارات الواردة من ميزة "اقتراحات" و"أخبار Google" مشابهة للبيانات التي تمت إضافتها
مؤخرًا إلى واجهة برمجة التطبيقات.
تتضمن مشاركتنا اليوم معلومات عن لوحة بيانات يمكنك استخدامها لفهم بياناتك الخاصة، وتسهّل لوحة البيانات هذه عملية التبديل بين المواقع الإلكترونية على Search Console وأنواع البيانات والأجهزة المختلفة وغير ذلك. يمكنك ربط بياناتك الخاصة بهذا النموذج لتتبُّع عدد الزيارات الواردة إلى موقعك الإلكتروني من محرّك بحث Google.
يُرجى متابعة القراءة للاطّلاع على مزيد من المعلومات حول لوحة البيانات.
كيفية استخدام لوحة البيانات والغرض منها
عند إنشاء لوحة بيانات، عليك دائمًا البدء بتحديد الغرض منها، ويمكن تصنيف غالبية الحالات ضمن أحد الخيارات الثلاثة التالية:
تتبُّع الأداء: يتيح لك ذلك رصد أي تغيير في البيانات سريعًا، على سبيل المثال تتبُّع عدد النقرات على عناوين URL ونسبة النقر إلى الظهور (CTR) للصفحات المهمة على موقعك الإلكتروني.
استكشاف البيانات: يتيح لك ذلك استخلاص الإحصاءات من البيانات، على سبيل المثال تحليل أنماط الأداء في البحث للبلدان أو الأجهزة أو أقسام الموقع الإلكتروني المختلفة.
توفير معلومات للمستخدمين: يتيح لك ذلك نشر مؤشرات وأنماط مثيرة للاهتمام، على سبيل المثال مشاركة بيانات مجمّعة تم تقسيمها حسب المجال.
اليوم، سنقدّم شرحًا حول لوحة بيانات مخصصة لتتبُّع الأداء من شأنها مساعدتك في اكتشاف المشاكل فور حدوثها. في العادة، يستخدم هذا النوع من لوحات البيانات تمثيلات بصرية بسيطة، على سبيل المثال رسومات بيانية خطية أو رسومات بيانية شريطية وجداول يمكن تفسيرها سريعًا. وعند حدوث مشكلة، بإمكان خبير تحسين محركات البحث أو المحلِّل الانتقال إلى مرحلة التعمّق في استكشاف البيانات (سنتناول هذا الموضوع في مشاركتنا القادمة).
لوحة البيانات الخاصة بتتبُّع عدد الزيارات الواردة من محرّك بحث Google
كما أشرنا، تحتوي هذه المشاركة على
نموذج
لتتبُّع الأداء في "بحث Google". في هذا القسم، نشرح كيفية عرض بيانات "بحث Google" في أداة "مركز البيانات"، ونحدد الوظائف والبيانات التي توفرها لوحة البيانات، كما نوضّح الأسباب التي دفعتنا لاتخاذ قرارات معيّنة بخصوص التصميم.
إعداد أداة ربط البيانات في Search Console
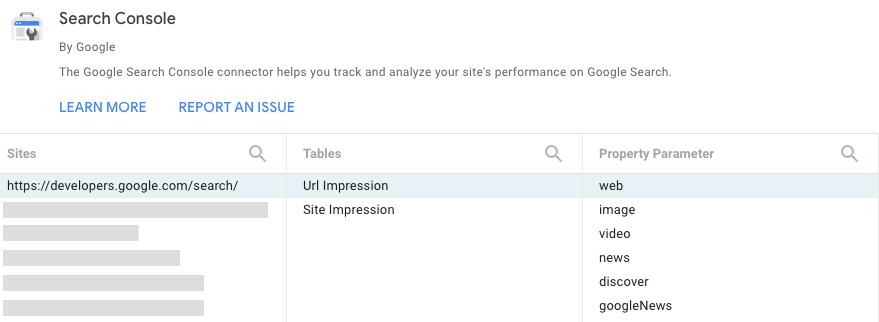
سجِّل الدخول إلى مركز البيانات وأنشِئ
مصدر بيانات من Search Console، ثم اختَر جدول
مرات الظهور لعنوان URL الذي يتضمن بيانات خاصة بالويب والصور والفيديوهات والأخبار وميزة "اقتراحات" و"أخبار Google" على مستوى عنوان URL.
ستكون معلَمة الموقع الإلكتروني التي تختارها هنا هي المعلَمة التلقائية في تقريرك، ولكن بإمكانك الوصول إلى المعلَمات الأخرى من خلال فلتر سنشرح المزيد عنه لاحقًا في هذه المشاركة. للاطّلاع على مزيد من المعلومات حول البيانات، يمكنك زيارة
صفحات المساعدة الخاصة بتقرير الأداء.
التحكم في البيانات باستخدام الفلاتر والتواريخ
يتضمّن عنوان التقرير عدة خيارات تتيح لك فلترة البيانات في الرسومات البيانية:
استخدِم عنصر التحكم في البيانات للتبديل بين
المواقع الإلكترونية المختلفة في Search Console التي بإمكانك الوصول إليها.
اختَر النطاق الزمني الذي تريد عرضه في التقرير. يتم تلقائيًا عرض المعلومات الخاصة بآخر 28 يومًا مقارنةً بالـ 28 يومًا التي سبقتها.
أنشِئ فلاتر للتوغّل في بياناتك:
الصفحة: استخدِم هذا الخيار لتضمين أو استبعاد صفحة واحدة أو أكثر من صفحات موقعك الإلكتروني. ملاحظة: يمكنك
استخدام التعابير العادية بطريقة مشابهة لكيفية استخدامها في خدمة Search Console.
النوع: استخدِم هذا الخيار لتحديد النوع المطلوب ضمن أنواع البيانات المختلفة (بما في ذلك ميزة "اقتراحات" و"أخبار Google"). يمكنك تحديد نوع واحد في كل مرة.
البلد: استخدِم هذا الخيار لإدراج أو استبعاد بلد واحد أو أكثر.
الجهاز: استخدِم هذا الخيار لتحديد فئة أجهزة واحدة أو أكثر.
تتبُّع عدد النقرات ونسبة النقر إلى الظهور بمرور الوقت
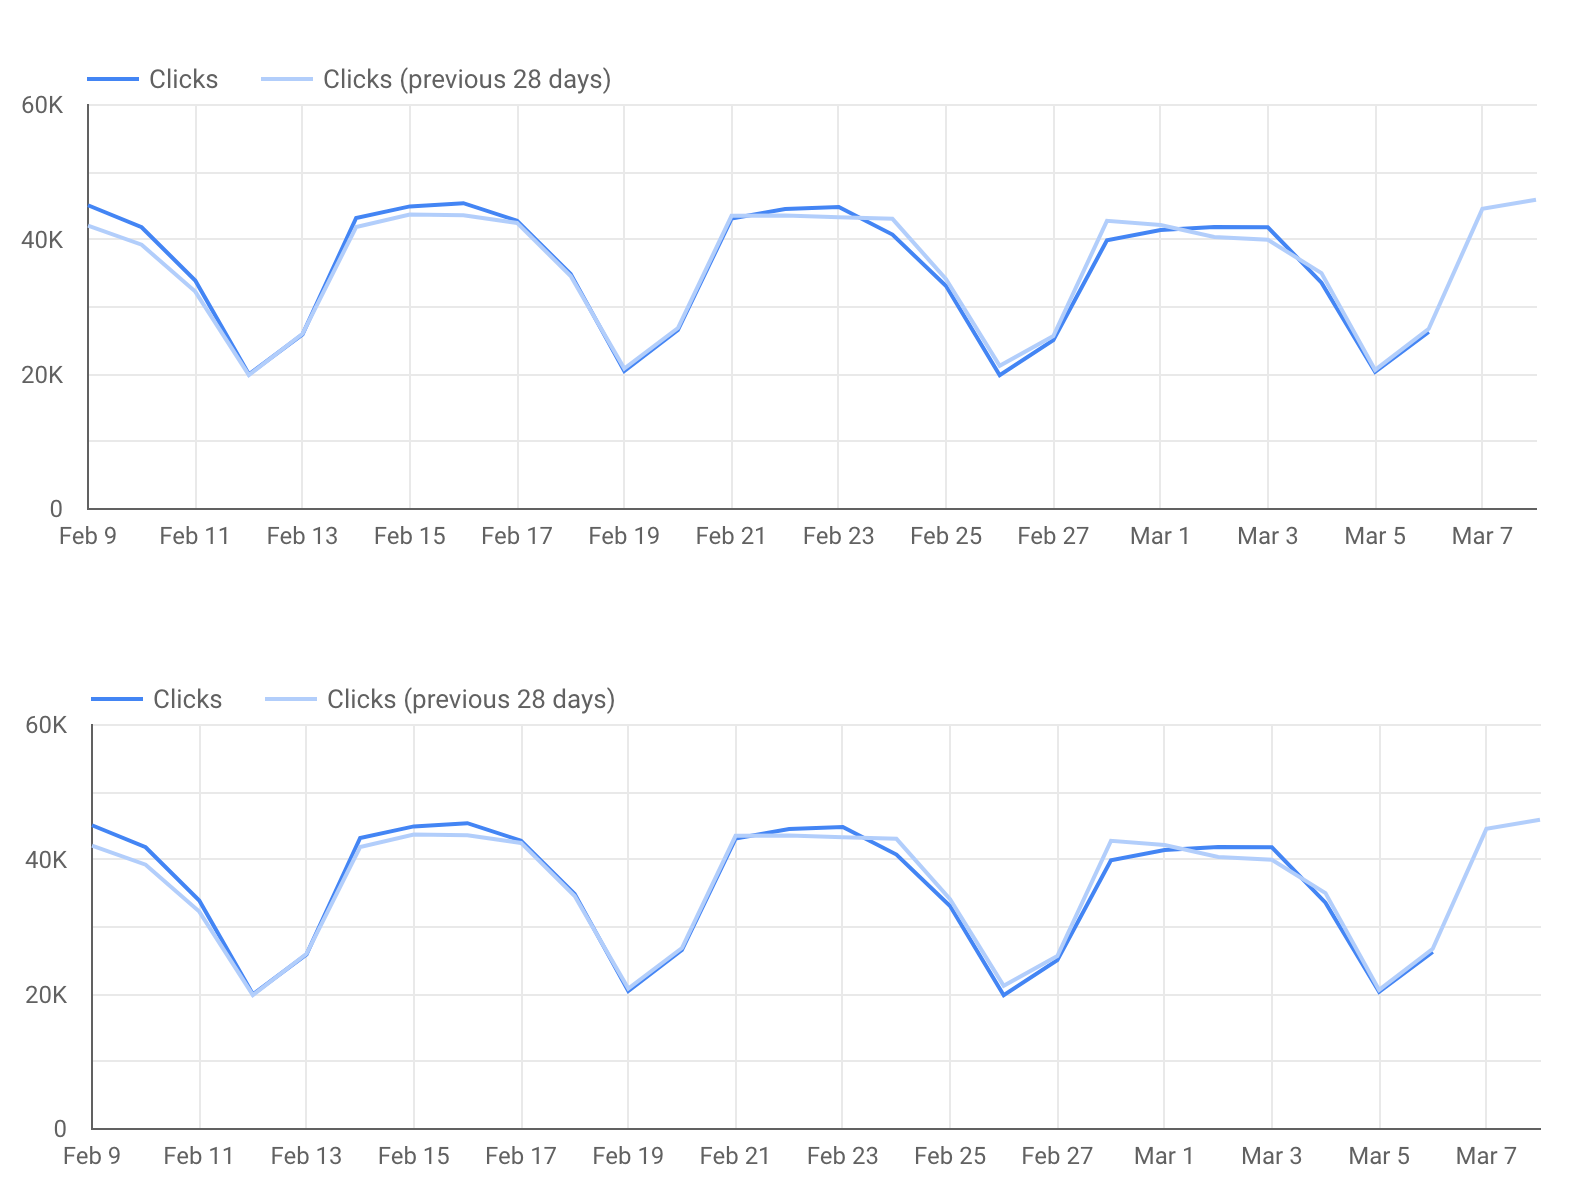
إنّ الرسم البياني الخطي هو التمثيل البصري الأكثر فعالية لعرض تغيُّر المقاييس بمرور الوقت. في هذه الحالة، اخترنا عرض كلٍّ من عدد النقرات ونسبة النقر إلى الظهور للموقع الإلكتروني. في صورة الرسم البياني الخطي، نلاحظ أنماطًا مختلفة لعطلات نهاية الأسبوع وأيام العمل (وهذا أحد الأسباب المهمة لاستخدام مضاعفات العدد 7 دائمًا في النطاق الزمني للرسومات البيانية الخطية). انتبِه للأيام التي تخالف هذا النمط.
هذه الصورة خاصة بموقع إلكتروني مرتبط بالعمل، وبالتالي يرتفع عدد الزيارات الواردة إليه خلال أيام العمل وينخفض في عطلات نهاية الأسبوع.
وقد يبدو مختلفًا تمامًا عن موقعك الإلكتروني.
لم نضمّن بيانات "إحصاءات Google" في هذا التقرير، ولكن قد يكون مفيدًا إدراج رسم بياني يعرض عدد الإحالات الناجحة التي حصل عليها الموقع الإلكتروني من نتائج البحث المجانية على Google. اطّلِع على كيفية ربط "إحصاءات Google" بأداة "مركز البيانات"، ما يساهم في الحصول على معلومات شاملة.
التوغّل في بيانات عناوين URL محددة (أو أقسام معيّنة من الموقع الإلكتروني)
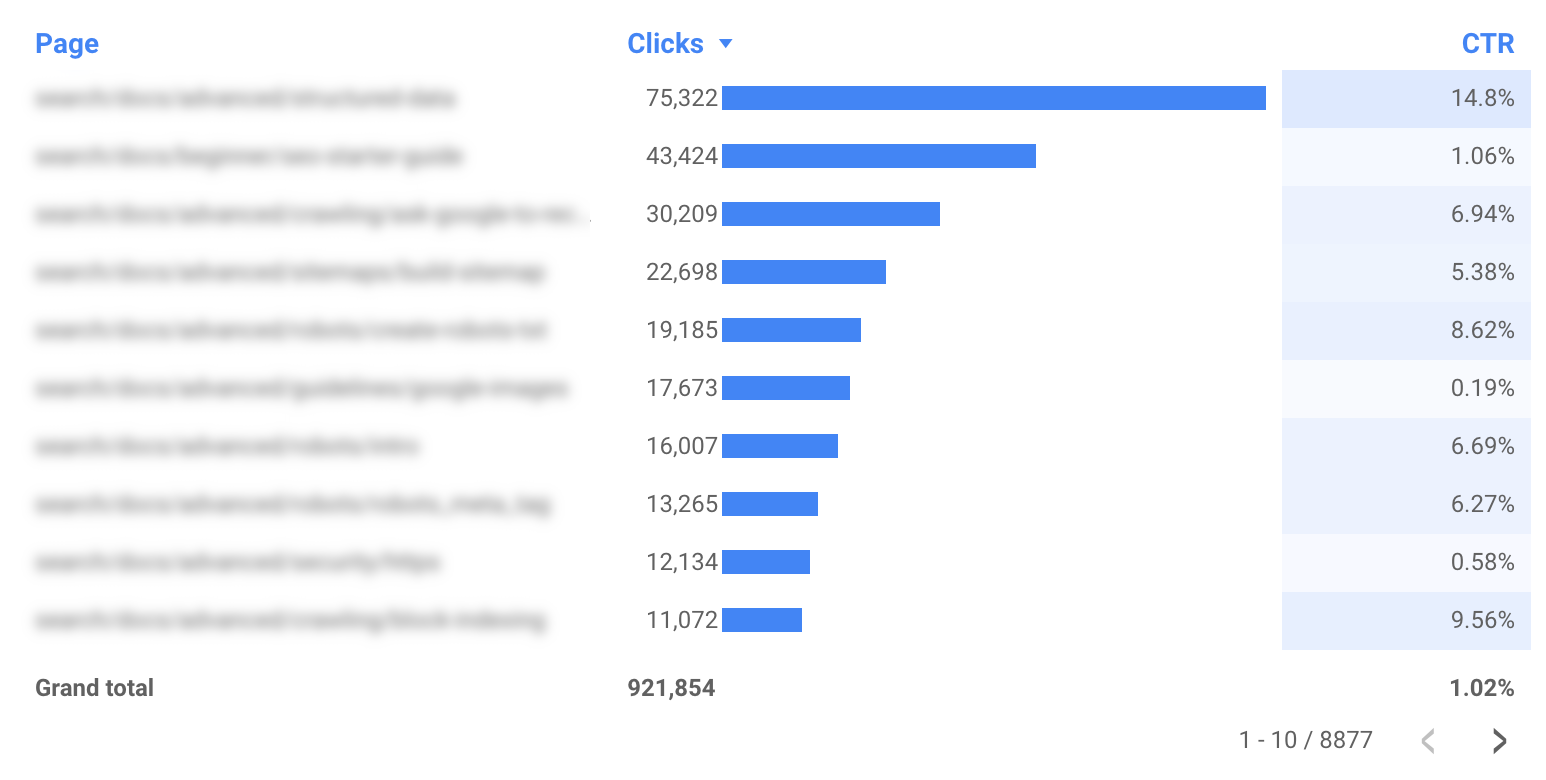
إذا أردت تحليل المؤشرات والأنماط، ستكون الرسومات البيانية أكثر فائدة لك، ولكن إذا أردت الغوص في التفاصيل، سيكون تحليل عناوين URL محددة (أو مجموعات منها) باستخدام جدول أكثر فعالية لك. مثلاً:
استخدِم فلتر الصفحات لتضمين أقسام محددة فقط من موقعك الإلكتروني.
استخدِم فلتر البلدان للاطّلاع على أداء صفحات مختلفة في البلدان التي تهمك.
استخدِم فلتر الأنواع لتحليل أداء كل نوع من أنواع البيانات على مستوى عنوان URL.
نصائح إضافية
النصيحة 1: اجعل لوحة بياناتك متوافقة مع الأجهزة الجوّالة
معظم لوحات البيانات لا تحتاج إلى أن تكون متوافقة مع الأجهزة الجوّالة، لأنّها تُستخدَم على جهاز كمبيوتر، إلا أنّ لوحة البيانات الخاصة بالتتبُّع يمكن استخدامها غالبًا أثناء الذهاب إلى العمل، لذا من المهم أن تكون متوافقة مع الأجهزة الجوّالة.
للحصول على تجربة استخدام جيّدة على الأجهزة الجوّالة للوحة البيانات الخاصة بالتتبُّع، اضبط "وضع العرض" على "ملاءمة مع العرض" (أسفل تنسيق التقرير والصفحات)، وسيؤدي ذلك إلى ضبط عرض لوحة البيانات بما يتوافق مع حجم الشاشة. إذا اخترت هذه الإعدادات، فتحقق من شكل ظهور التقرير على شاشات بأحجام مختلفة.
النصيحة 2: اختصِر سلاسل عناوين URL
إذا كان تقريرك يتضمّن نطاقًا واحدًا بدون نطاقات فرعية، ننصحك بإزالة اسم النطاق من تقريرك لكي تكون الجداول أكثر تنظيمًا. على سبيل المثال، إذا كنت تنشئ تقريرًا للنطاق example.com/cool-dashboards/search،
سترى فقط /cool-dashboards/search. لإجراء ذلك، يمكنك إنشاء
حقل محسوب لإزالة اسم النطاق من عنوان URL باستخدام تعبير عادي. على سبيل المثال، إذا كان اسم النطاق .com، يمكنك استخدام التعبير التالي:
REGEXP_EXTRACT(Landing Page, ".*\\.com/(.*)$")
المشاركة القادمة: رسم بياني متقدم لتحسين جهودك في "بحث Google"
[[["يسهُل فهم المحتوى.","easyToUnderstand","thumb-up"],["ساعَدني المحتوى في حلّ مشكلتي.","solvedMyProblem","thumb-up"],["غير ذلك","otherUp","thumb-up"]],[["لا يحتوي على المعلومات التي أحتاج إليها.","missingTheInformationINeed","thumb-down"],["الخطوات معقدة للغاية / كثيرة جدًا.","tooComplicatedTooManySteps","thumb-down"],["المحتوى قديم.","outOfDate","thumb-down"],["ثمة مشكلة في الترجمة.","translationIssue","thumb-down"],["مشكلة في العيّنات / التعليمات البرمجية","samplesCodeIssue","thumb-down"],["غير ذلك","otherDown","thumb-down"]],[],[[["\u003cp\u003eThis article explains how to build a Data Studio dashboard to monitor website search traffic, including clicks, CTR, and performance by page, country, device, and search type.\u003c/p\u003e\n"],["\u003cp\u003eThe provided dashboard template allows users to connect their own Search Console data for analysis and visualization.\u003c/p\u003e\n"],["\u003cp\u003eThe dashboard focuses on monitoring performance, enabling users to quickly identify and address changes in search traffic patterns.\u003c/p\u003e\n"],["\u003cp\u003eData Studio's Search Console connector now includes Discover and Google News traffic data, enhancing the scope of analysis.\u003c/p\u003e\n"],["\u003cp\u003eThe article also offers tips on making the dashboard mobile-friendly and shortening URL strings for improved readability.\u003c/p\u003e\n"]]],["This article details creating a Google Search traffic monitoring dashboard in Data Studio. It explains how to use a provided template to track Search Console data, including web, image, video, news, Discover, and Google News traffic. Key actions include setting up a Search Console connector, using filters (page, type, country, device), and analyzing clicks and click-through rates (CTR) over time via line charts. It also emphasizes mobile-friendly design and URL shortening tips. The core function of this dashboard is to monitor performance for quick issue detection.\n"],null,["# Monitoring Search traffic (and more!) with Data Studio\n\nWednesday, March 30, 2022\n\n\nThis article shows how to create a monitoring dashboard for your Search traffic on Data Studio. While Search Console provides\nout-of-the-box charts and filtering capabilities, Data Studio allows you to customize your own charts and view them side\nby side with other data, such as Google Ads, Analytics, YouTube, BigQuery, and others. If you missed our previous article\nin this series, check it out at [Connecting Search Console to Data Studio](/search/blog/2022/03/connecting-data-studio).\n\n\nBefore we dive into dashboarding, we have some good news for Data Studio users: *as of today, the Search Console connector includes\ndata for Discover and Google News traffic, similar to the data [recently\nadded](/search/blog/2021/10/search-analytics-discover-gnews) to the API*.\n\n\nIn today's post, we're sharing a dashboard for you to use with your own data; it makes it easy to toggle between different Search Console properties,\ndata types, devices, and more. You can link your own data to\n[this template](https://datastudio.google.com/reporting/7300a2df-97a2-408a-b10c-43acd2270fe6/page/6zXD/preview) to monitor\nyour site's Google Search traffic.\n\n\nKeep reading to learn more about the dashboard.\n\nHow and why you should use a dashboard\n--------------------------------------\n\n\nWhen you build a dashboard, you should always start by defining its purpose,\nand the majority of cases can be classified as one of three options:\n\n- **Monitoring performance**. Quickly discover a change in the data, for example monitoring URL clicks and click-through rate (CTR) for important pages on your site.\n- **Data exploration**. Uncover insights from data, for example analyzing search performance patterns across different countries, devices, or website sections.\n- **Informing the world**. Publishing interesting trends and patterns, for example sharing aggregate data segmented by industry.\n\n\nToday we'll discuss a monitoring performance dashboard, which should help you find out issues as they happen. Usually, this kind\nof dashboard uses simple visualizations such as line or bar charts, and tables --- those are quick to interpret. Then, if an issue\nis discovered, the SEO or analyst can proceed to a deeper data exploration (this will be covered in the next post).\n\nSearch traffic monitoring dashboard\n-----------------------------------\n\nAs mentioned, this post provides [a template](https://datastudio.google.com/reporting/7300a2df-97a2-408a-b10c-43acd2270fe6/page/6zXD/preview) to monitor Google Search performance. In this section, we discuss how to get your Search data into Data Studio, what functionality and data the dashboard provides, and why we made some of the design decisions.\n\n### Set up a Search Console connector\n\nSign in to [Data Studio](https://datastudio.google.com/), create a [Search Console data source](https://support.google.com/datastudio/answer/7314895), and choose the **URL Impression** table, which includes data for web, image, video, news, discover, and googleNews on a URL level basis. The **Property Parameter** you choose here will be the default one in your report, but you'll have access to the others through a filter, more about it later in the post. To learn more about the data visit the [Performance report help pages](https://support.google.com/webmasters/topic/9384513).\n\n\n### Control the data using filters and dates\n\n\nThe header of the report includes several options for you to filter the data in the charts:\n\n1. Use the [data control](https://support.google.com/datastudio/answer/7415591) to change between the Search Console properties you have access to.\n2. Choose the date range you'd like to see in the report. By default you'll see the last 28 days compared to the previous 28 days.\n3. Create filters to drill down on your data:\n - **Page** . Use this to include or exclude one or more pages from your website. Tip: you can [use regular expressions](/search/blog/2021/06/regex-negative-match) similar to the way you use it in Search Console.\n - **Type**. Use this to choose among the different data types (including Discover and Google News). You can only choose one at a time.\n - **Country**. Use this to include or exclude one or more countries.\n - **Device**. Use this to choose one or more device categories.\n\n\n### Monitor clicks and CTR over time\n\n\nA line chart is the most effective visualization to show how metrics change over time. In this case, we chose to look at both\nClicks and Site CTR. In the line chart image, weekends and weekdays have very different patterns (one of the reasons it's\nimportant to always use a multiple of 7 in your line charts date range) --- *keep your eyes on days that break that pattern!*\n\n\nNote that this image is for a website that is work oriented, hence the traffic is high on weekdays and low on weekends.\nIt might look very different for your site.\n\n\nWe have not included Google Analytics data in this report, but it might be interesting to include a chart showing how many conversions the\nwebsite got from organic Google Search. Learn how to [connect\nGoogle Analytics](https://support.google.com/datastudio/answer/6370352) to Data Studio; this would help closing the loop.\n\n### Drill down into specific URLs (or website sections)\n\n\nWhen you analyze trends and patterns, charts will be more helpful to you, but if you want to go deeper, it's more effective to analyze particular\nURLs (or groups of them) using a table. For example:\n\n- Use the page filter to include only specific sections of your website.\n- Use the country filter to check how different pages perform in countries you care about.\n- Use the type filter to analyze URL-level performance for each of the data types.\n\n\nBonus tips\n----------\n\n### Tip #1: Make your dashboard mobile-friendly\n\n\nMost dashboards don't need to be mobile friendly as people use them on their computer. But a monitoring dashboard can be often\nused while commuting to work, so it might be important for it to be mobile-friendly.\n\n\nIn order to create a good mobile experience for a monitoring dashboard, set \"Display mode\" to \"Fit to width\" (found under\n[report and page layout](https://support.google.com/datastudio/answer/7355651)) --- this will adjust the\ndashboard width to the screen size. If you choose this option, make sure to check how the report looks on different screen sizes.\n\n### Tip #2: Shorten URL strings\n\n\nIf your report includes a single domain with no subdomains, you might consider removing the domain name from your report\nto make the tables less cluttered. For example, if you're building a report for `example.com/cool-dashboards/search`,\nyou'd see only `/cool-dashboards/search`. To do so, you can create a\n[calculated field](https://support.google.com/datastudio/answer/6299685) to remove the domain name\nfrom the URL using a regular expression. For example, for a `.com` domain name you\ncould use the following expression: \n\n```scdoc\nREGEXP_EXTRACT(Landing Page, \".*\\\\.com/(.*)$\")\n```\n\nNext: An advanced chart for optimizing your Search efforts\n----------------------------------------------------------\n\n\nIn the next post, [Optimizing website performance with a Search Console bubble chart](/search/blog/2022/04/performance-optimization-bubble-chart), we'll discuss an advanced chart that may help you understand where to focus your attention when it comes to\noptimizing your Search efforts.\n\n\nAs always, let us know if you have any questions through the [Google\nSearch Central Community](https://support.google.com/webmasters/threads?thread_filter=(category:search_console)) or the [Data\nStudio Community](https://support.google.com/datastudio/threads?thread_filter=(category:connect_to_data)). Also, if you're on Twitter, make sure to [follow us](https://twitter.com/googlesearchc);\nwe'll announce future posts over there.\n\n\n*Happy dashboarding!*\n\nPosted by [Daniel Waisberg](https://www.danielwaisberg.com), Search Advocate"]]