วันพุธที่ 30 มีนาคม 2022
บทความนี้จะบอกวิธีสร้างหน้าแดชบอร์ดการตรวจสอบสำหรับการเข้าชมจาก Search ใน Data Studio แม้ว่า Search Console จะมีแผนภูมิและตัวกรองที่พร้อมใช้งานในตัว แต่ Data Studio ช่วยให้คุณสามารถปรับแต่งแผนภูมิของตนเอง รวมถึงดูแผนภูมิเหล่านั้นควบคู่กับข้อมูลอื่นๆ เช่น Google Ads, Analytics, YouTube, BigQuery เป็นต้น หากพลาดบทความก่อนหน้าในซีรีส์นี้ คุณสามารถอ่านได้ที่การเชื่อมต่อ Search Console กับ Data Studio
ก่อนที่เราจะเจาะลึกเรื่องหน้าแดชบอร์ด เรามีข่าวดีสำหรับผู้ใช้ Data Studio ตั้งแต่วันนี้เป็นต้นไป เครื่องมือเชื่อมต่อ Search Console จะรวมข้อมูลสำหรับการเข้าชมใน Discover และ Google News ซึ่งคล้ายกับข้อมูลที่เพิ่มเมื่อเร็วๆ นี้ไปยัง API
ในโพสต์วันนี้ เราจะมาแชร์หน้าแดชบอร์ดให้คุณนำไปใช้กับข้อมูลของตัวเอง ซึ่งจะช่วยให้การสลับระหว่างพร็อพเพอร์ตี้ Search Console, ประเภทข้อมูล อุปกรณ์ และอื่นๆ เป็นเรื่องง่าย คุณสามารถลิงก์ข้อมูลของตัวเองกับเทมเพลตนี้เพื่อตรวจสอบการเข้าชมจาก Google Search ของเว็บไซต์
โปรดอ่านต่อเพื่อดูข้อมูลเพิ่มเติมเกี่ยวกับหน้าแดชบอร์ด
วิธีใช้และเหตุผลที่ควรใช้หน้าแดชบอร์ด
เมื่อสร้างหน้าแดชบอร์ด คุณควรเริ่มด้วยการกำหนดวัตถุประสงค์ก่อนเสมอ และโดยส่วนใหญ่จะแบ่งออกเป็น 3 ตัวเลือกต่อไปนี้
- การตรวจสอบประสิทธิภาพ ค้นพบการเปลี่ยนแปลงในข้อมูลได้อย่างรวดเร็ว เช่น การตรวจสอบการคลิก URL และอัตราการคลิกผ่าน (CTR) ของหน้าที่สำคัญในเว็บไซต์
- การสำรวจข้อมูล ค้นพบข้อมูลเชิงลึกจากข้อมูล เช่น การวิเคราะห์รูปแบบประสิทธิภาพการค้นหาในประเทศต่างๆ อุปกรณ์ที่หลากหลาย หรือส่วนต่างๆ ของเว็บไซต์
- บอกข้อมูลให้โลกรู้ การเผยแพร่เทรนด์และรูปแบบที่น่าสนใจ เช่น การแชร์ข้อมูลรวมที่แบ่งกลุ่มแยกตามอุตสาหกรรม
วันนี้เราจะพูดถึงหน้าแดชบอร์ดการตรวจสอบประสิทธิภาพซึ่งจะช่วยให้คุณพบปัญหาที่เกิดขึ้นได้ทันที โดยปกติแล้ว หน้าแดชบอร์ดประเภทนี้จะใช้การแสดงภาพง่ายๆ เช่น แผนภูมิเส้นหรือแผนภูมิแท่ง รวมถึงตาราง ซึ่งช่วยให้ตีความได้อย่างรวดเร็ว และเมื่อเกิดปัญหาขึ้น SEO หรือนักวิเคราะห์จะดูข้อมูลที่ลึกขึ้นได้ (รายละเอียดจะอยู่ในโพสต์ถัดไป)
หน้าแดชบอร์ดการตรวจสอบการเข้าชมจาก Search
ตามที่ได้กล่าวไว้ โพสต์นี้จะมีเทมเพลตในการตรวจสอบประสิทธิภาพของ Google Search ในส่วนนี้ เราจะกล่าวถึงวิธีการนำข้อมูลจาก Search ไปใช้ใน Data Studio รวมถึงฟังก์ชันการทำงานและข้อมูลที่หน้าแดชบอร์ดแสดง ตลอดจนเหตุผลสำหรับการตัดสินใจเกี่ยวกับการออกแบบบางอย่างตั้งค่าเครื่องมือเชื่อมต่อ Search Console
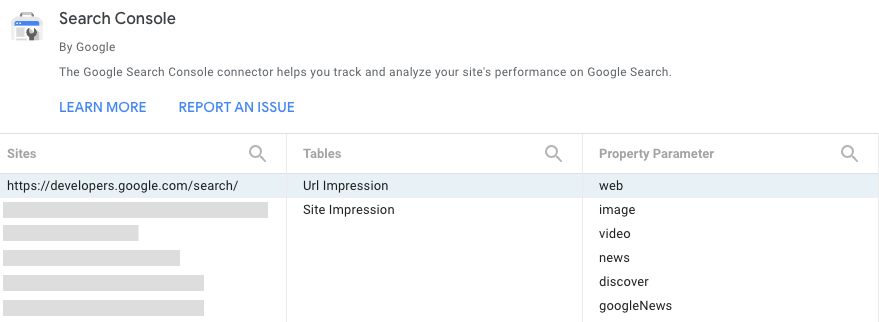
ลงชื่อเข้าใช้ Data Studio สร้างแหล่งข้อมูล Search Console และเลือกตารางการแสดงผล URL ซึ่งมีข้อมูลสำหรับเว็บ รูปภาพ วิดีโอ ข่าว Discover และ Google News ในระดับ URL พารามิเตอร์พร็อพเพอร์ตี้ที่คุณเลือกที่นี่จะเป็นค่าเริ่มต้นในรายงาน แต่คุณจะมีสิทธิ์เข้าถึงพารามิเตอร์อื่นๆ ผ่านทางตัวกรอง ซึ่งจะมีข้อมูลเพิ่มเติมอยู่ในโพสต์นี้ สำหรับรายละเอียดเกี่ยวกับข้อมูล ให้ไปที่หน้าความช่วยเหลือเกี่ยวกับรายงานประสิทธิภาพ

ควบคุมข้อมูลโดยใช้ตัวกรองและวันที่
ส่วนหัวของรายงานจะมีตัวเลือกมากมายเพื่อให้คุณกรองข้อมูลในแผนภูมิได้ ดังนี้
- ใช้การควบคุมข้อมูลเพื่อเปลี่ยนพร็อพเพอร์ตี้ Search Console ที่คุณเข้าถึงได้
- เลือกช่วงวันที่ที่ต้องการดูในรายงาน โดยค่าเริ่มต้น คุณจะเห็นรายงานของช่วง 28 วันที่ผ่านมาเทียบกับ 28 วันก่อนหน้า
- สร้างตัวกรองเพื่อเจาะลึกข้อมูลดังนี้
- หน้า ใช้เพื่อรวมหรือยกเว้นหน้าอย่างน้อย 1 หน้าจากเว็บไซต์ เคล็ดลับ: คุณใช้นิพจน์ทั่วไปได้เช่นเดียวกับที่ใช้ใน Search Console
- ประเภท ใช้เพื่อเลือกข้อมูลประเภทต่างๆ (รวมถึง Discover และ Google News) คุณเลือกได้ครั้งละ 1 รายการเท่านั้น
- ประเทศ ใช้เพื่อรวมหรือยกเว้นประเทศอย่างน้อย 1 ประเทศ
- อุปกรณ์ ใช้เพื่อเลือกหมวดหมู่อุปกรณ์อย่างน้อย 1 หมวดหมู่

ตรวจสอบการคลิกและ CTR ในช่วงที่ผ่านมา
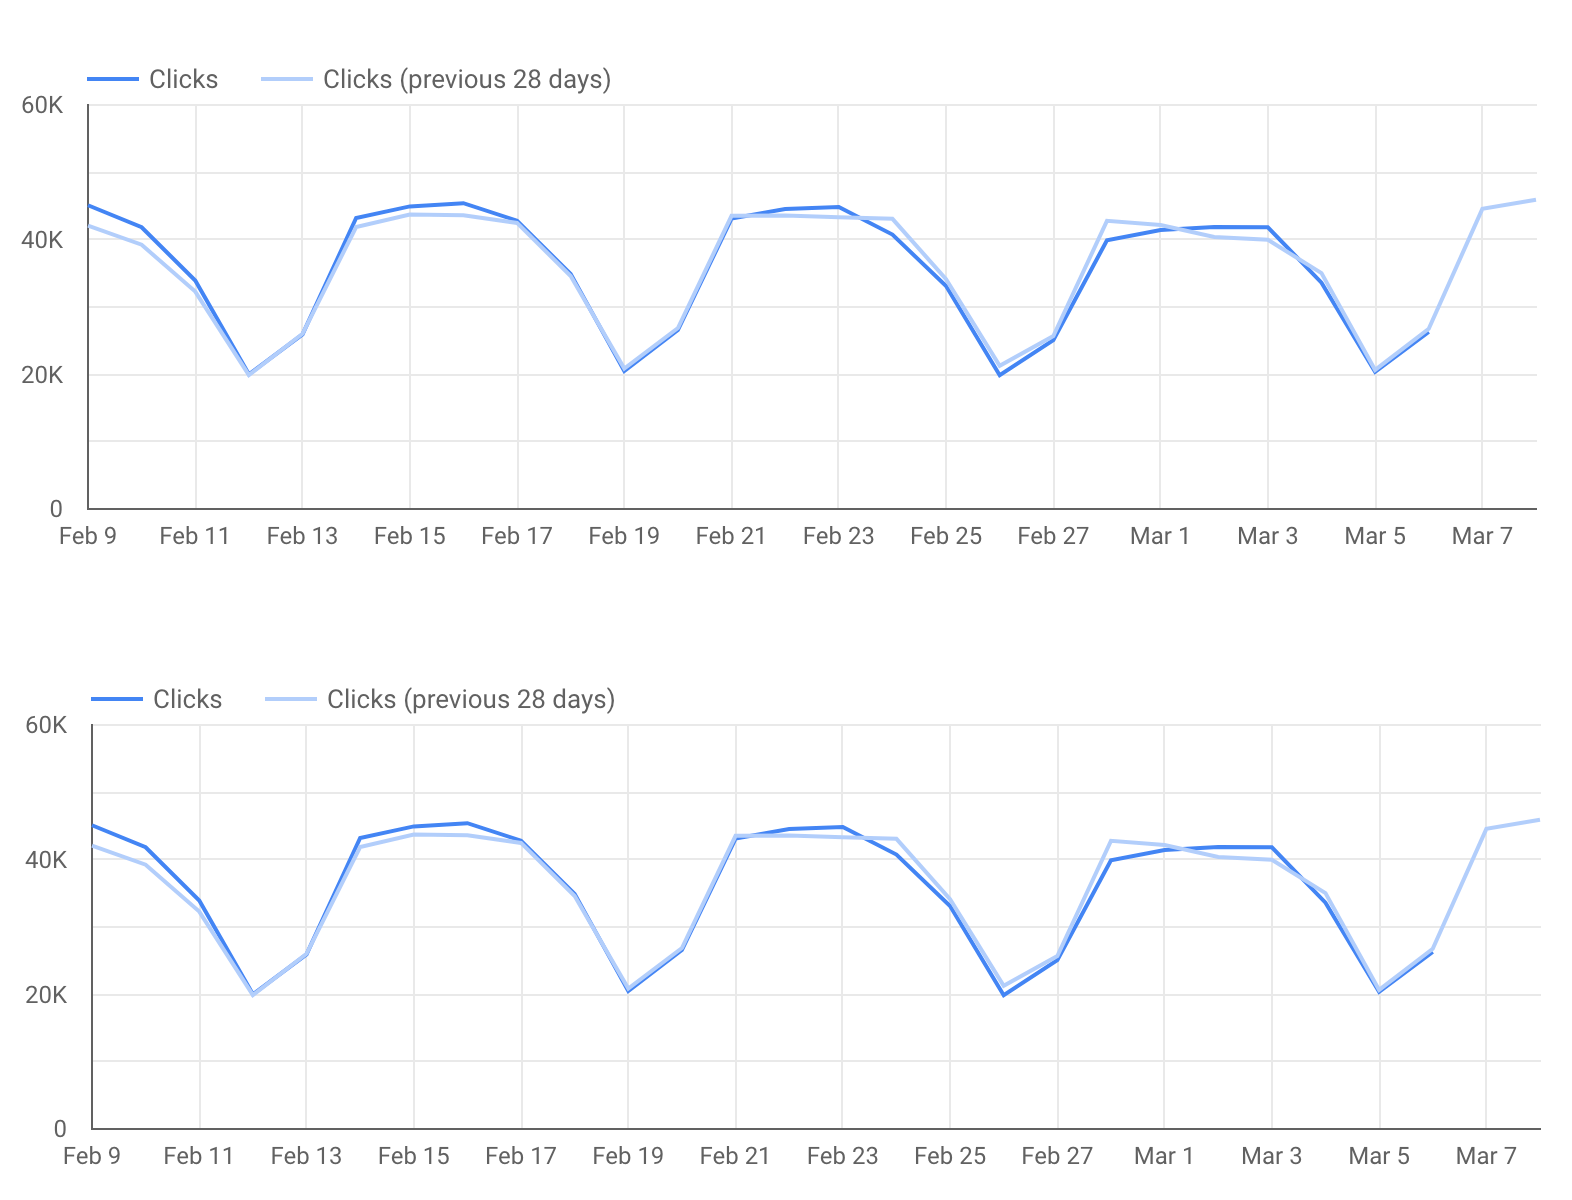
แผนภูมิเส้นเป็นการแสดงภาพที่มีประสิทธิภาพมากที่สุดในการแสดงการเปลี่ยนแปลงของเมตริกในช่วงเวลาที่ระบุ ในกรณีนี้ เราจะดูทั้งการคลิกและ CTR ของเว็บไซต์ ในรูปภาพแผนภูมิเส้น วันสุดสัปดาห์และวันธรรมดาจะมีรูปแบบต่างกันมาก (ซึ่งเป็นเหตุผลหนึ่งว่าเหตุใดจึงควรจะใช้พหุคูณของ 7 ในช่วงวันที่ของแผนภูมิเส้นเสมอ) — คอยสังเกตวันที่ต่างไปจากรูปแบบนั้น
โปรดทราบว่ารูปภาพนี้มีไว้สำหรับเว็บไซต์ที่เน้นเวลาทำงานเป็นหลัก ดังนั้นการเข้าชมจึงสูงในช่วงวันธรรมดาและต่ำในวันสุดสัปดาห์ โดยรูปแบบของเว็บไซต์ของคุณอาจต่างออกไปมาก

เราไม่ได้รวมข้อมูล Google Analytics ไว้ในรายงานนี้ แต่อาจเป็นประโยชน์หากจะแสดงแผนภูมิที่แสดงจำนวน Conversion ที่เว็บไซต์ได้รับจาก Google Search ที่เกิดขึ้นเอง ดูวิธีเชื่อมต่อ Google Analytics กับ Data Studio วิธีนี้จะช่วยแสดงข้อมูลที่สมบูรณ์
เจาะลึก URL (หรือส่วนของเว็บไซต์) ที่เจาะจง
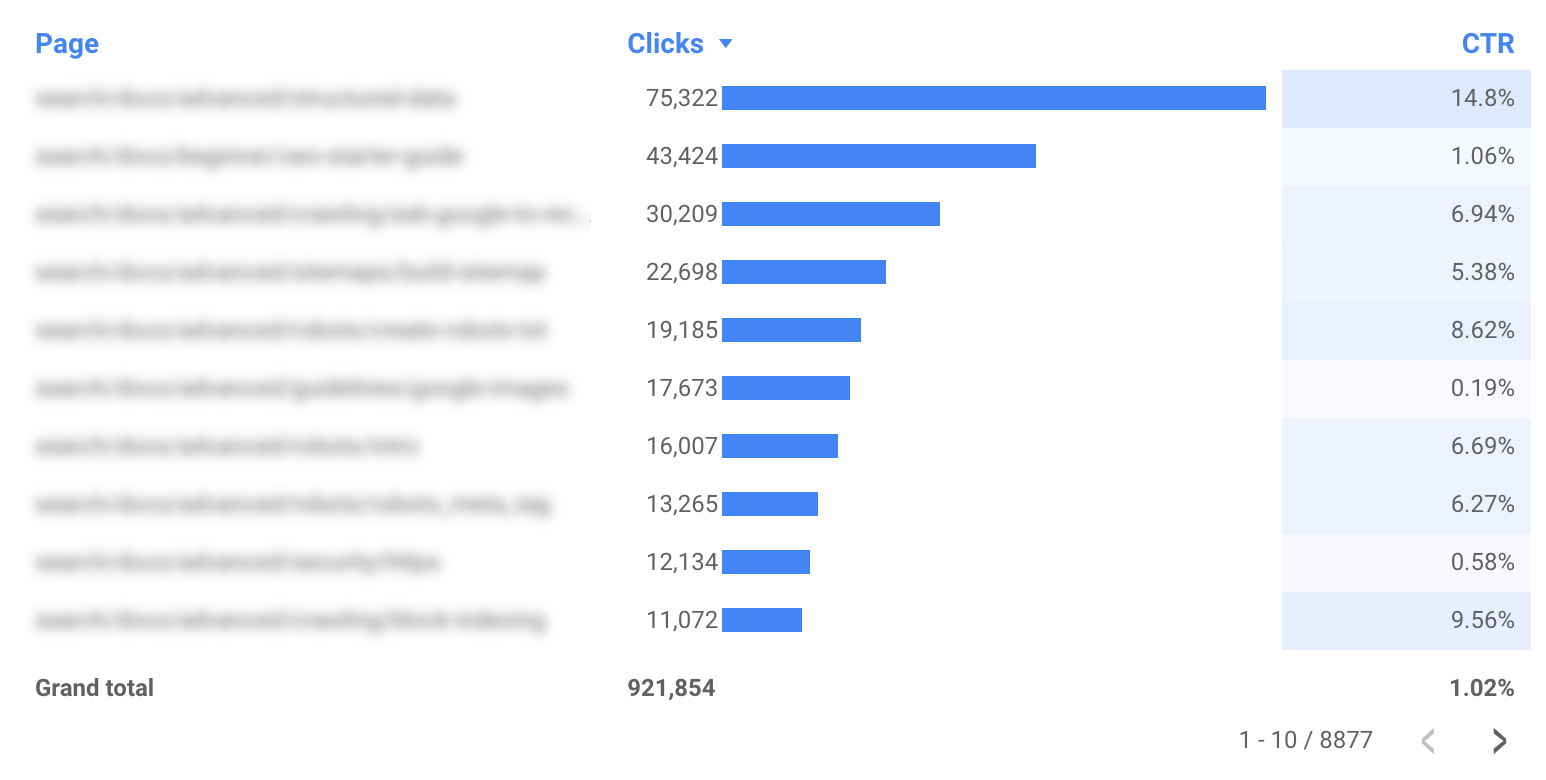
แผนภูมิจะมีประโยชน์ต่อคุณมากขึ้นเมื่อคุณวิเคราะห์เทรนด์และรูปแบบ แต่หากคุณต้องการข้อมูลที่เจาะลึกยิ่งขึ้น คุณควรวิเคราะห์ URL (หรือกลุ่ม URL) ที่เฉพาะเจาะจงโดยใช้ตารางแทน เช่น
- ใช้ตัวกรองหน้าเพื่อรวมเฉพาะบางส่วนของเว็บไซต์
- ใช้ตัวกรองประเทศเพื่อตรวจสอบประสิทธิภาพของหน้าเว็บต่างๆ ในประเทศที่คุณสนใจ
- ใช้ตัวกรองประเภทเพื่อวิเคราะห์ประสิทธิภาพระดับ URL สำหรับข้อมูลแต่ละประเภท

เคล็ดลับพิเศษ
เคล็ดลับ #1: ทำให้หน้าแดชบอร์ดเหมาะกับอุปกรณ์เคลื่อนที่
หน้าแดชบอร์ดส่วนใหญ่ไม่จำเป็นต้องเหมาะกับอุปกรณ์เคลื่อนที่ เนื่องจากผู้คนใช้แดชบอร์ดในคอมพิวเตอร์ แต่ผู้คนมักใช้หน้าแดชบอร์ดการตรวจสอบขณะเดินทางไปทำงาน ดังนั้นจึงควรทำให้หน้าแดชบอร์ดประเภทนี้เหมาะกับอุปกรณ์เคลื่อนที่
เพื่อมอบประสบการณ์การใช้งานที่ดีบนอุปกรณ์เคลื่อนที่สำหรับหน้าแดชบอร์ดการตรวจสอบ ให้ตั้งค่า "โหมดการแสดงผล" เป็น "พอดีกับความกว้าง" (อยู่ในเลย์เอาต์รายงานและหน้าเว็บ) ซึ่งจะปรับความกว้างของหน้าแดชบอร์ดให้พอดีกับขนาดหน้าจอ หากเลือกตัวเลือกนี้ อย่าลืมตรวจสอบให้รายงานปรากฏอย่างเหมาะสมในหน้าจอขนาดต่างๆ
เคล็ดลับ #2: ทำให้สตริง URL สั้นลง
หากรายงานมีโดเมนเดียวโดยไม่มีโดเมนย่อย คุณอาจลองนำชื่อโดเมนออกจากรายงานเพื่อให้ตารางเป็นระเบียบมากขึ้น เช่น หากสร้างรายงานสำหรับ example.com/cool-dashboards/search คุณจะเห็นเฉพาะ /cool-dashboards/search หากต้องการทำเช่นนั้น ให้สร้างช่องที่คำนวณเพื่อนำชื่อโดเมนออกจาก URL โดยใช้นิพจน์ทั่วไป เช่น สําหรับชื่อโดเมน .com คุณจะใช้นิพจน์ต่อไปนี้ได้
REGEXP_EXTRACT(Landing Page, ".*\\.com/(.*)$")
ถัดไป: แผนภูมิขั้นสูงที่ช่วยให้ความพยายามปรับปรุง Search ของคุณมีประสิทธิภาพมากขึ้น
ในโพสต์ถัดไปซึ่งก็คือการเพิ่มประสิทธิภาพเว็บไซต์ด้วยแผนภูมิฟองอากาศของ Search Console เราจะพูดถึงแผนภูมิขั้นสูงที่อาจช่วยให้คุณเข้าใจว่าควรให้ความสําคัญกับเรื่องใดเมื่อต้องการใช้งาน Search อย่างมีประสิทธิภาพมากขึ้น
และเช่นเคย หากมีข้อสงสัยใดๆ โปรดแจ้งให้เราทราบผ่านชุมชน Google Search Central หรือชุมชน Data Studio นอกจากนี้ หากใช้ Twitter อยู่ อย่าลืมติดตามเรา เราจะแจ้งให้ทราบเมื่อมีโพสต์ใหม่ๆ โปรดคอยติดตาม
ขอให้มีความสุขกับการดูหน้าแดชบอร์ด
