이 게시물에서는 데이터 스튜디오에서 Google 검색 트래픽의 모니터링 대시보드를 만드는 방법을 설명합니다. Search Console에서는 즉시 사용할 수 있는 차트와 필터링 기능을 제공하지만 데이터 스튜디오를 사용하면 나만의 차트를 맞춤설정하여 Google Ads, 애널리틱스, YouTube, BigQuery 등 다른 데이터와 나란히 확인해 볼 수 있습니다. 이 시리즈의 이전 도움말을 보지 못했다면 Search Console을 데이터 스튜디오에 연결에서 확인하세요.
대시보드를 만들기에 앞서 데이터 스튜디오 사용자에게 유용한 소식을 알려 드립니다. 현재 Search Console 커넥터에는 API에 최근 추가된 데이터와 유사한 디스커버 및 Google 뉴스 트래픽 관련 데이터가 포함되어 있습니다.
이 게시물에서는 자체 데이터에 사용할 수 있는 대시보드를 공유합니다. 대시보드를 통해 다양한 Search Console 속성, 데이터 유형, 기기 간에 쉽게 전환할 수 있습니다. 자체 데이터를 이 템플릿에 연결하여 사이트의 Google 검색 트래픽을 모니터링할 수도 있습니다.
계속 읽으면서 대시보드에 관해 자세히 알아보세요.
대시보드 사용 방법 및 이유
대시보드를 빌드할 때는 항상 용도를 정의하는 것으로 시작해야 합니다. 대부분의 사례는 다음 세 가지 용도 중 하나로 분류됩니다.
실적 모니터링. 데이터 변경사항을 신속하게 확인합니다. 예를 들어 사이트에 있는 중요 페이지의 URL 클릭수 및 클릭률(CTR)을 모니터링할 수 있습니다.
데이터 탐색 분석. 데이터에서 유용한 정보를 찾아냅니다. 예를 들어 여러 국가, 기기 또는 웹사이트 섹션에서 검색 실적 패턴을 분석할 수 있습니다.
전 세계에 정보 제공. 흥미로운 추세 및 패턴을 게시합니다. 예를 들어 업종별로 분류된 합산 데이터를 공유할 수 있습니다.
오늘은 문제가 발생하면 확인할 수 있는 실적 모니터링 대시보드에 관해 알아보겠습니다. 일반적으로 이러한 종류의 대시보드에서는 해석하기 쉽고 간단한 시각 자료(예: 선 또는 막대 그래프, 표)를 사용합니다. 문제가 발견되면 검색엔진 최적화 전문가나 분석가가 데이터를 더 심층적으로 탐색 분석할 수 있습니다. 관련 내용은 다음 게시물에서 소개하겠습니다.
Google 검색 트래픽 모니터링 대시보드
앞서 언급했듯이 이 게시물에서는 Google 검색 실적을 모니터링하기 위한 템플릿을 제공합니다. 이 섹션에서는 Google 검색 데이터를 데이터 스튜디오로 가져오는 방법과 대시보드에서 제공하는 기능 및 데이터를 살펴보고 몇 가지 디자인을 왜 그렇게 결정했는지 소개하겠습니다.
Search Console 커넥터 설정
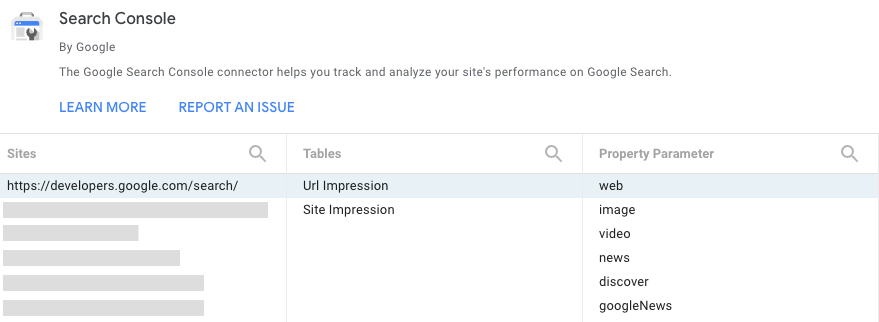
데이터 스튜디오에 로그인하여 Search Console 데이터 소스를 만들고 URL 노출 표를 선택합니다. 이 표에는 URL 수준에 따른 web, image, video, news, discover, googleNews 관련 데이터가 포함되어 있습니다.
여기서 선택한 속성 매개변수가 보고서의 기본 매개변수가 되지만, 필터를 통해 다른 매개변수를 사용할 수 있습니다. 이 내용은 뒷부분에서 자세히 다룹니다. 데이터에 관한 자세한 내용은 실적 보고서 도움말 페이지를 참고하세요.
필터 및 날짜를 사용하여 데이터 제어
보고서 헤더에는 차트의 데이터를 필터링할 수 있는 옵션이 있습니다.
액세스 권한이 있는 다른 Search Console 속성으로 변경하려면 데이터 컨트롤을 사용합니다.
보고서에 표시할 기간을 선택합니다. 기본적으로 이전 28일과 비교하여 최근 28일을 표시합니다.
데이터를 상세히 살펴보려면 필터를 만듭니다.
페이지. 웹사이트에서 페이지를 하나 이상 포함하거나 제외하는 데 사용합니다. 도움말: Search Console에서와 유사한 방식으로 정규 표현식을 사용할 수 있습니다.
유형. 디스커버 및 Google 뉴스 등 다양한 데이터 유형 중에서 선택하는 데 사용합니다. 한 번에 하나의 유형만 선택할 수 있습니다.
국가. 국가를 하나 이상 포함하거나 제외하는 데 사용합니다.
기기. 기기 카테고리를 하나 이상 선택하는 데 사용합니다.
시간 경과에 따른 클릭수 및 CTR 모니터링
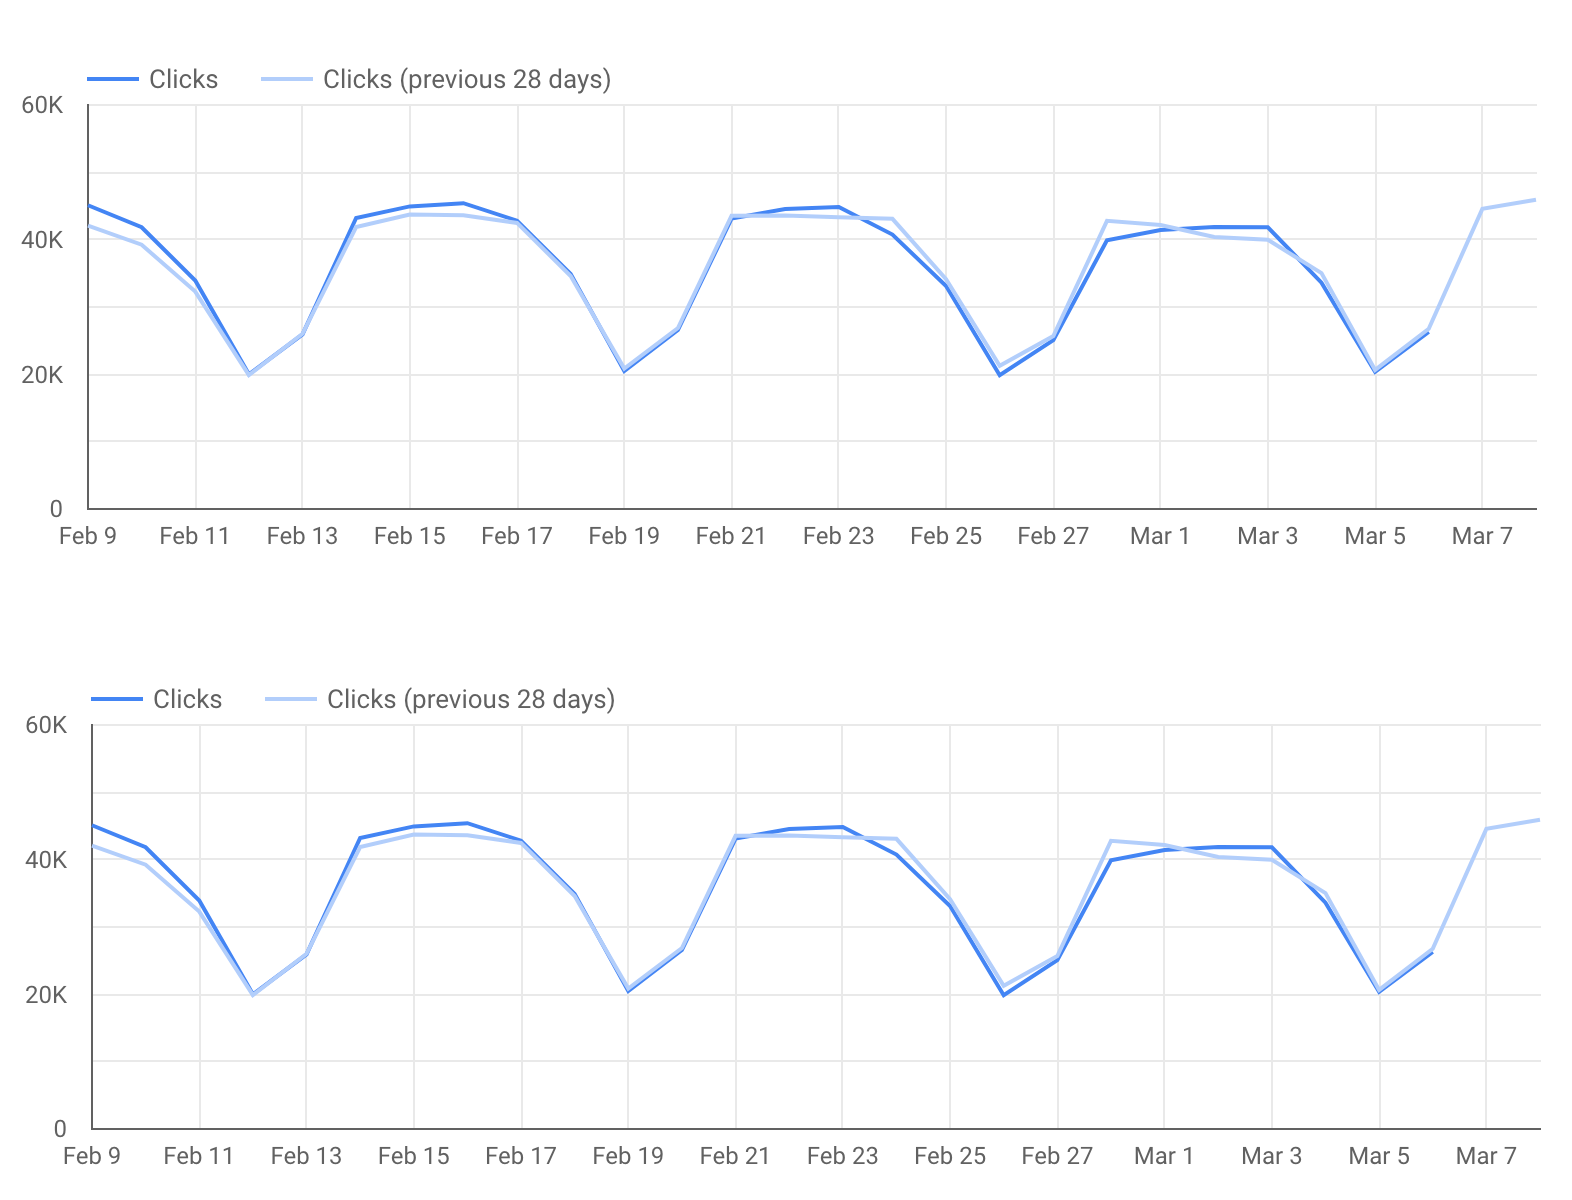
선 차트는 시간 경과에 따른 측정항목의 변화를 가장 효과적으로 보여주는 시각 자료입니다. 여기서는 클릭수와 사이트 CTR을 모두 살펴보겠습니다. 아래의 선 차트 이미지에서는 주말과 평일의 패턴이 매우 다릅니다. 이것이 바로 선 차트 기간에 항상 7의 배수를 사용해야 하는 이유 중 하나입니다. 이러한 패턴을 따르지 않는 날에 주의하세요.
이 이미지는 업무 중심 웹사이트를 위한 것이기 때문에 평일에는 트래픽이 많고 주말에는 트래픽이 적습니다.
사이트에 따라 매우 다르게 표시될 수도 있습니다.
이 보고서에는 Google 애널리틱스 데이터가 포함되어 있지 않지만, 웹사이트가 자연 Google 검색으로 얻은 전환수를 보여주는 차트를 보고서에 포함하면 흥미로울 것입니다. 데이터 스튜디오에 Google 애널리틱스를 연결하는 방법을 알아보세요. 자세한 정보를 확인할 수 있습니다.
특정 URL(또는 웹사이트 섹션) 상세히 살펴보기
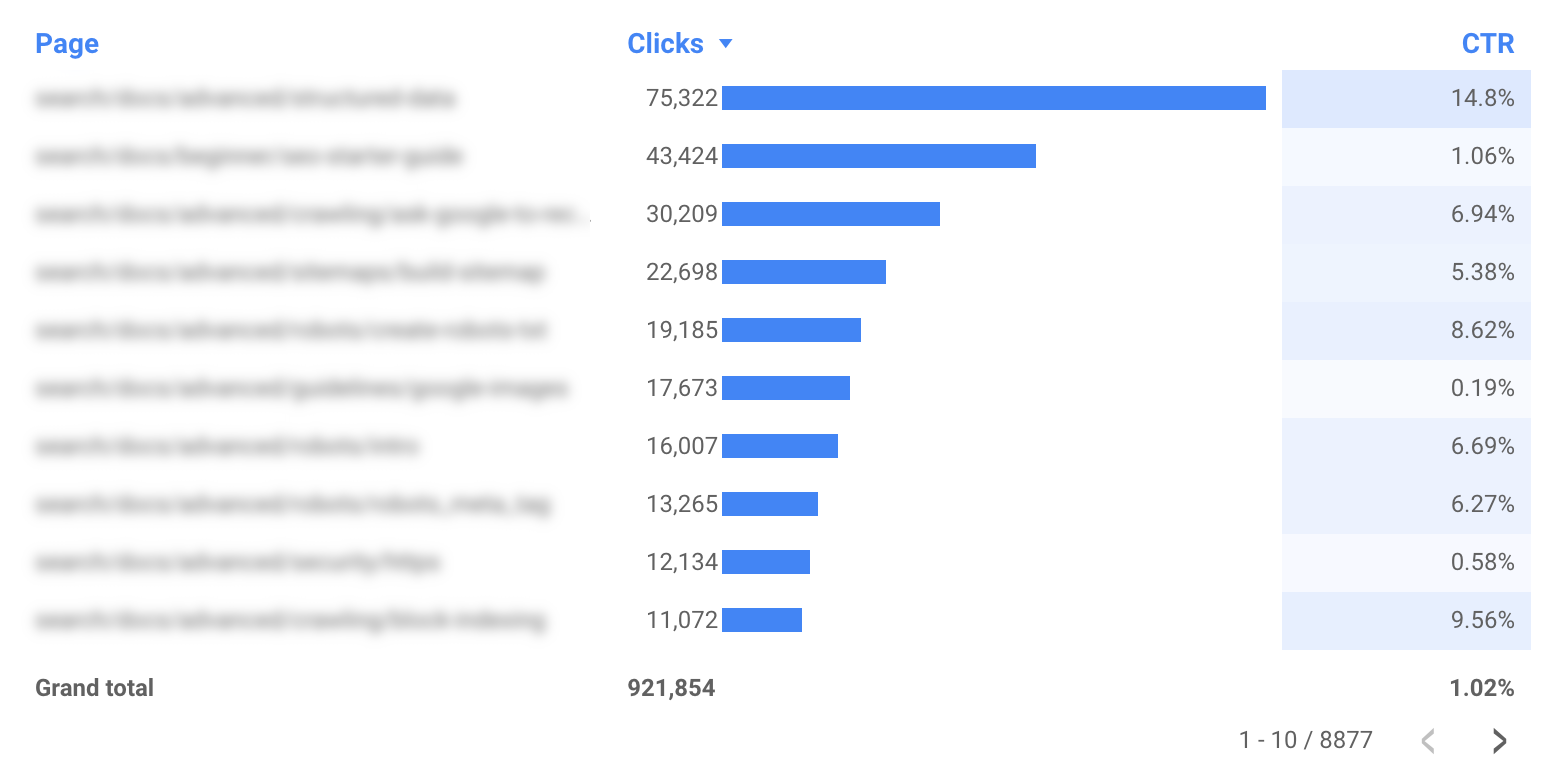
추세와 패턴을 분석할 때는 차트가 더 도움이 되지만 보다 세부적으로 분석하고 싶다면 표를 사용하여 특정 URL(또는 URL 그룹)을 분석하는 것이 더 효과적입니다. 예를 들면 다음과 같습니다.
페이지 필터를 사용하여 웹사이트의 특정 섹션만 포함합니다.
국가 필터를 사용하여 관심 있는 국가의 다양한 페이지 실적을 확인합니다.
유형 필터를 사용하여 각 데이터 유형의 URL 수준 실적을 분석합니다.
추가 도움말
도움말 1: 모바일 친화적인 대시보드 만들기
대부분의 대시보드는 컴퓨터에서 사용되므로 모바일 친화적이지 않아도 됩니다. 하지만 모니터링 대시보드는 출퇴근 길에 사용하는 경우가 많으므로 모바일 친화적으로 만들어야 할 수도 있습니다.
모니터링 대시보드에 적합한 모바일 환경을 만들려면 보고서 및 페이지 레이아웃에서 '디스플레이 모드'를 '너비에 맞춤'으로 설정합니다. 그러면 대시보드 너비가 화면 크기에 맞춰 조정됩니다. 이 옵션을 선택하는 경우 다양한 화면 크기에서 보고서가 어떻게 표시되는지 확인하세요.
도움말 2: URL 문자열 단축
보고서에 하위 도메인이 없는 단일 도메인이 포함되어 있으면 보고서에서 도메인 이름을 삭제하여 표를 깔끔하게 만드는 것이 좋습니다. 예를 들어 example.com/cool-dashboards/search 보고서를 작성할 경우 /cool-dashboards/search만 표시되게 합니다. 이렇게 하려면 계산된 필드를 만들고 정규 표현식을 사용하여 URL에서 도메인 이름을 삭제하면 됩니다. 예를 들어 .com 도메인 이름의 경우 다음과 같은 표현식을 사용할 수 있습니다.
[[["이해하기 쉬움","easyToUnderstand","thumb-up"],["문제가 해결됨","solvedMyProblem","thumb-up"],["기타","otherUp","thumb-up"]],[["필요한 정보가 없음","missingTheInformationINeed","thumb-down"],["너무 복잡함/단계 수가 너무 많음","tooComplicatedTooManySteps","thumb-down"],["오래됨","outOfDate","thumb-down"],["번역 문제","translationIssue","thumb-down"],["샘플/코드 문제","samplesCodeIssue","thumb-down"],["기타","otherDown","thumb-down"]],[],[[["\u003cp\u003eThis article explains how to build a Data Studio dashboard to monitor website search traffic, including clicks, CTR, and performance by page, country, device, and search type.\u003c/p\u003e\n"],["\u003cp\u003eThe provided dashboard template allows users to connect their own Search Console data for analysis and visualization.\u003c/p\u003e\n"],["\u003cp\u003eThe dashboard focuses on monitoring performance, enabling users to quickly identify and address changes in search traffic patterns.\u003c/p\u003e\n"],["\u003cp\u003eData Studio's Search Console connector now includes Discover and Google News traffic data, enhancing the scope of analysis.\u003c/p\u003e\n"],["\u003cp\u003eThe article also offers tips on making the dashboard mobile-friendly and shortening URL strings for improved readability.\u003c/p\u003e\n"]]],["This article details creating a Google Search traffic monitoring dashboard in Data Studio. It explains how to use a provided template to track Search Console data, including web, image, video, news, Discover, and Google News traffic. Key actions include setting up a Search Console connector, using filters (page, type, country, device), and analyzing clicks and click-through rates (CTR) over time via line charts. It also emphasizes mobile-friendly design and URL shortening tips. The core function of this dashboard is to monitor performance for quick issue detection.\n"],null,["# Monitoring Search traffic (and more!) with Data Studio\n\nWednesday, March 30, 2022\n\n\nThis article shows how to create a monitoring dashboard for your Search traffic on Data Studio. While Search Console provides\nout-of-the-box charts and filtering capabilities, Data Studio allows you to customize your own charts and view them side\nby side with other data, such as Google Ads, Analytics, YouTube, BigQuery, and others. If you missed our previous article\nin this series, check it out at [Connecting Search Console to Data Studio](/search/blog/2022/03/connecting-data-studio).\n\n\nBefore we dive into dashboarding, we have some good news for Data Studio users: *as of today, the Search Console connector includes\ndata for Discover and Google News traffic, similar to the data [recently\nadded](/search/blog/2021/10/search-analytics-discover-gnews) to the API*.\n\n\nIn today's post, we're sharing a dashboard for you to use with your own data; it makes it easy to toggle between different Search Console properties,\ndata types, devices, and more. You can link your own data to\n[this template](https://datastudio.google.com/reporting/7300a2df-97a2-408a-b10c-43acd2270fe6/page/6zXD/preview) to monitor\nyour site's Google Search traffic.\n\n\nKeep reading to learn more about the dashboard.\n\nHow and why you should use a dashboard\n--------------------------------------\n\n\nWhen you build a dashboard, you should always start by defining its purpose,\nand the majority of cases can be classified as one of three options:\n\n- **Monitoring performance**. Quickly discover a change in the data, for example monitoring URL clicks and click-through rate (CTR) for important pages on your site.\n- **Data exploration**. Uncover insights from data, for example analyzing search performance patterns across different countries, devices, or website sections.\n- **Informing the world**. Publishing interesting trends and patterns, for example sharing aggregate data segmented by industry.\n\n\nToday we'll discuss a monitoring performance dashboard, which should help you find out issues as they happen. Usually, this kind\nof dashboard uses simple visualizations such as line or bar charts, and tables --- those are quick to interpret. Then, if an issue\nis discovered, the SEO or analyst can proceed to a deeper data exploration (this will be covered in the next post).\n\nSearch traffic monitoring dashboard\n-----------------------------------\n\nAs mentioned, this post provides [a template](https://datastudio.google.com/reporting/7300a2df-97a2-408a-b10c-43acd2270fe6/page/6zXD/preview) to monitor Google Search performance. In this section, we discuss how to get your Search data into Data Studio, what functionality and data the dashboard provides, and why we made some of the design decisions.\n\n### Set up a Search Console connector\n\nSign in to [Data Studio](https://datastudio.google.com/), create a [Search Console data source](https://support.google.com/datastudio/answer/7314895), and choose the **URL Impression** table, which includes data for web, image, video, news, discover, and googleNews on a URL level basis. The **Property Parameter** you choose here will be the default one in your report, but you'll have access to the others through a filter, more about it later in the post. To learn more about the data visit the [Performance report help pages](https://support.google.com/webmasters/topic/9384513).\n\n\n### Control the data using filters and dates\n\n\nThe header of the report includes several options for you to filter the data in the charts:\n\n1. Use the [data control](https://support.google.com/datastudio/answer/7415591) to change between the Search Console properties you have access to.\n2. Choose the date range you'd like to see in the report. By default you'll see the last 28 days compared to the previous 28 days.\n3. Create filters to drill down on your data:\n - **Page** . Use this to include or exclude one or more pages from your website. Tip: you can [use regular expressions](/search/blog/2021/06/regex-negative-match) similar to the way you use it in Search Console.\n - **Type**. Use this to choose among the different data types (including Discover and Google News). You can only choose one at a time.\n - **Country**. Use this to include or exclude one or more countries.\n - **Device**. Use this to choose one or more device categories.\n\n\n### Monitor clicks and CTR over time\n\n\nA line chart is the most effective visualization to show how metrics change over time. In this case, we chose to look at both\nClicks and Site CTR. In the line chart image, weekends and weekdays have very different patterns (one of the reasons it's\nimportant to always use a multiple of 7 in your line charts date range) --- *keep your eyes on days that break that pattern!*\n\n\nNote that this image is for a website that is work oriented, hence the traffic is high on weekdays and low on weekends.\nIt might look very different for your site.\n\n\nWe have not included Google Analytics data in this report, but it might be interesting to include a chart showing how many conversions the\nwebsite got from organic Google Search. Learn how to [connect\nGoogle Analytics](https://support.google.com/datastudio/answer/6370352) to Data Studio; this would help closing the loop.\n\n### Drill down into specific URLs (or website sections)\n\n\nWhen you analyze trends and patterns, charts will be more helpful to you, but if you want to go deeper, it's more effective to analyze particular\nURLs (or groups of them) using a table. For example:\n\n- Use the page filter to include only specific sections of your website.\n- Use the country filter to check how different pages perform in countries you care about.\n- Use the type filter to analyze URL-level performance for each of the data types.\n\n\nBonus tips\n----------\n\n### Tip #1: Make your dashboard mobile-friendly\n\n\nMost dashboards don't need to be mobile friendly as people use them on their computer. But a monitoring dashboard can be often\nused while commuting to work, so it might be important for it to be mobile-friendly.\n\n\nIn order to create a good mobile experience for a monitoring dashboard, set \"Display mode\" to \"Fit to width\" (found under\n[report and page layout](https://support.google.com/datastudio/answer/7355651)) --- this will adjust the\ndashboard width to the screen size. If you choose this option, make sure to check how the report looks on different screen sizes.\n\n### Tip #2: Shorten URL strings\n\n\nIf your report includes a single domain with no subdomains, you might consider removing the domain name from your report\nto make the tables less cluttered. For example, if you're building a report for `example.com/cool-dashboards/search`,\nyou'd see only `/cool-dashboards/search`. To do so, you can create a\n[calculated field](https://support.google.com/datastudio/answer/6299685) to remove the domain name\nfrom the URL using a regular expression. For example, for a `.com` domain name you\ncould use the following expression: \n\n```scdoc\nREGEXP_EXTRACT(Landing Page, \".*\\\\.com/(.*)$\")\n```\n\nNext: An advanced chart for optimizing your Search efforts\n----------------------------------------------------------\n\n\nIn the next post, [Optimizing website performance with a Search Console bubble chart](/search/blog/2022/04/performance-optimization-bubble-chart), we'll discuss an advanced chart that may help you understand where to focus your attention when it comes to\noptimizing your Search efforts.\n\n\nAs always, let us know if you have any questions through the [Google\nSearch Central Community](https://support.google.com/webmasters/threads?thread_filter=(category:search_console)) or the [Data\nStudio Community](https://support.google.com/datastudio/threads?thread_filter=(category:connect_to_data)). Also, if you're on Twitter, make sure to [follow us](https://twitter.com/googlesearchc);\nwe'll announce future posts over there.\n\n\n*Happy dashboarding!*\n\nPosted by [Daniel Waisberg](https://www.danielwaisberg.com), Search Advocate"]]