
Performance optimization starts with identifying key metrics, usually related to latency and throughput. The addition of monitoring to capture and track these metrics exposes weak points in the application. With metrics, optimization can be undertaken to improve performance metrics.
Additionally, many monitoring tools let you set up alerts for your metrics, so that you are notified when a certain threshold is met. For example, you might set up an alert to notify you when the percentage of failed requests increases by more than x % of the normal levels. Monitoring tools can help you identify what normal performance looks like and identify unusual spikes in latency, error quantities, and other key metrics. The ability to monitor these metrics is especially important during business critical timeframes, or after new code has been pushed to production.
Определение показателей задержки
Ensure that you keep your UI as responsive as you can, noting that users expect even higher standards from mobile apps . Latency should also be measured and tracked for backend services, particularly since it can lead to throughput issues if left unchecked.
В качестве показателей для отслеживания предлагаются следующие:
- Продолжительность запроса
- Продолжительность запроса на уровне подсистемы (например, вызовы API)
- Продолжительность работы
Определите показатели пропускной способности
Throughput is a measure of the total number of requests served over a given period of time. Throughput can be affected by latency of subsystems, so you might need to optimize for latency to improve throughput.
Вот несколько рекомендуемых показателей для отслеживания:
- Запросов в секунду
- Объем передаваемых данных в секунду
- Количество операций ввода-вывода в секунду
- Использование ресурсов, таких как процессор или память.
- Размер очереди обработки, например, по модели публикации/подписки или по количеству потоков.
Не только среднее значение
A common mistake in measuring performance is only looking at the mean (average) case. While this is useful, it doesn't provide insight into the distribution of latency. A better metric to track is the performance percentiles, for example the 50th/75th/90th/99th percentile for a metric.
Generally, optimizing can be done in two steps. First, optimize for 90th percentile latency. Then, consider the 99th percentile—also known as tail latency: the small portion of requests which take much longer to complete.
Мониторинг на стороне сервера для получения подробных результатов.
Server-side profiling is generally preferred for tracking metrics. The server side is usually much easier to instrument, allows access to more granular data, and is less subject to perturbation from connectivity issues.
Мониторинг браузера для обеспечения сквозной видимости.
Browser profiling can provide additional insights into the end user experience. It can show which pages have slow requests, which you can then correlate to server-side monitoring for further analysis.
Google Analytics provides out-of-the-box monitoring for page load times in the page timings report . This provides several useful views for understanding the user experience on your site, in particular:
- время загрузки страниц
- Перенаправление времени загрузки
- время отклика сервера
Мониторинг в облаке
There are many tools you can use to capture and monitor performance metrics for your application. For example, you can use Google Cloud Logging to log performance metrics to your Google Cloud Project , then set up dashboards in Google Cloud Monitoring to monitor and segment the logged metrics.
Check out the Logging guide for an example of logging to Google Cloud Logging from a custom interceptor in the Python client library. With that data available in Google Cloud, you can build metrics on top of the logged data to gain visibility into your application through Google Cloud Monitoring. Follow the guide for user-defined log-based metrics to build metrics using the logs sent to Google Cloud Logging.
В качестве альтернативы вы можете использовать клиентские библиотеки мониторинга для определения метрик в вашем коде и отправки их непосредственно в систему мониторинга, отдельно от логов.
Пример метрик на основе логов
Предположим, вы хотите отслеживать значение is_fault , чтобы лучше понимать частоту ошибок в вашем приложении. Вы можете извлечь значение is_fault из логов и преобразовать его в новую метрику-счетчик ErrorCount .
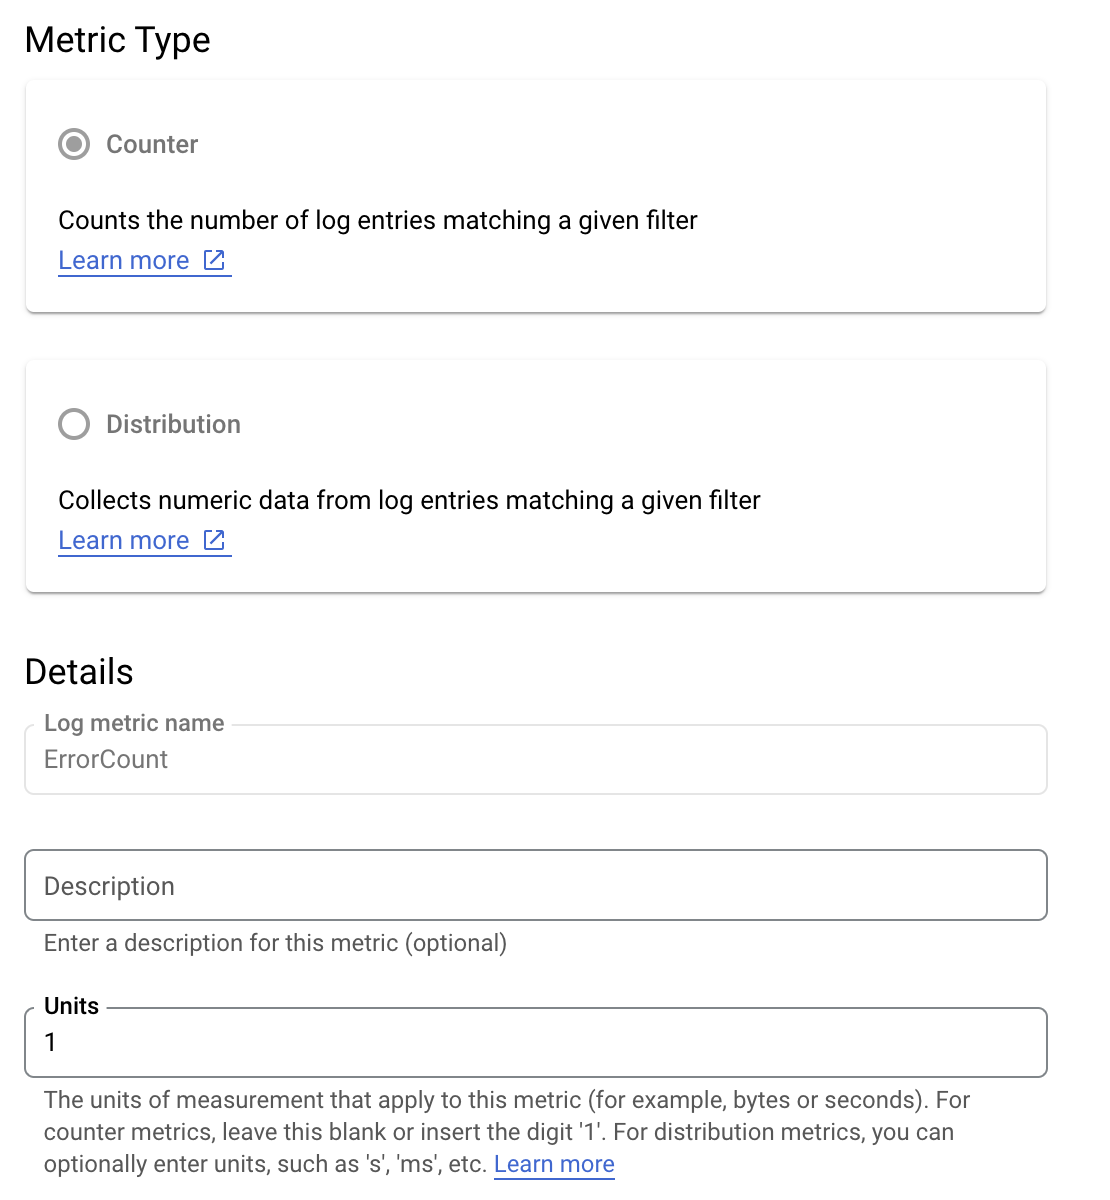
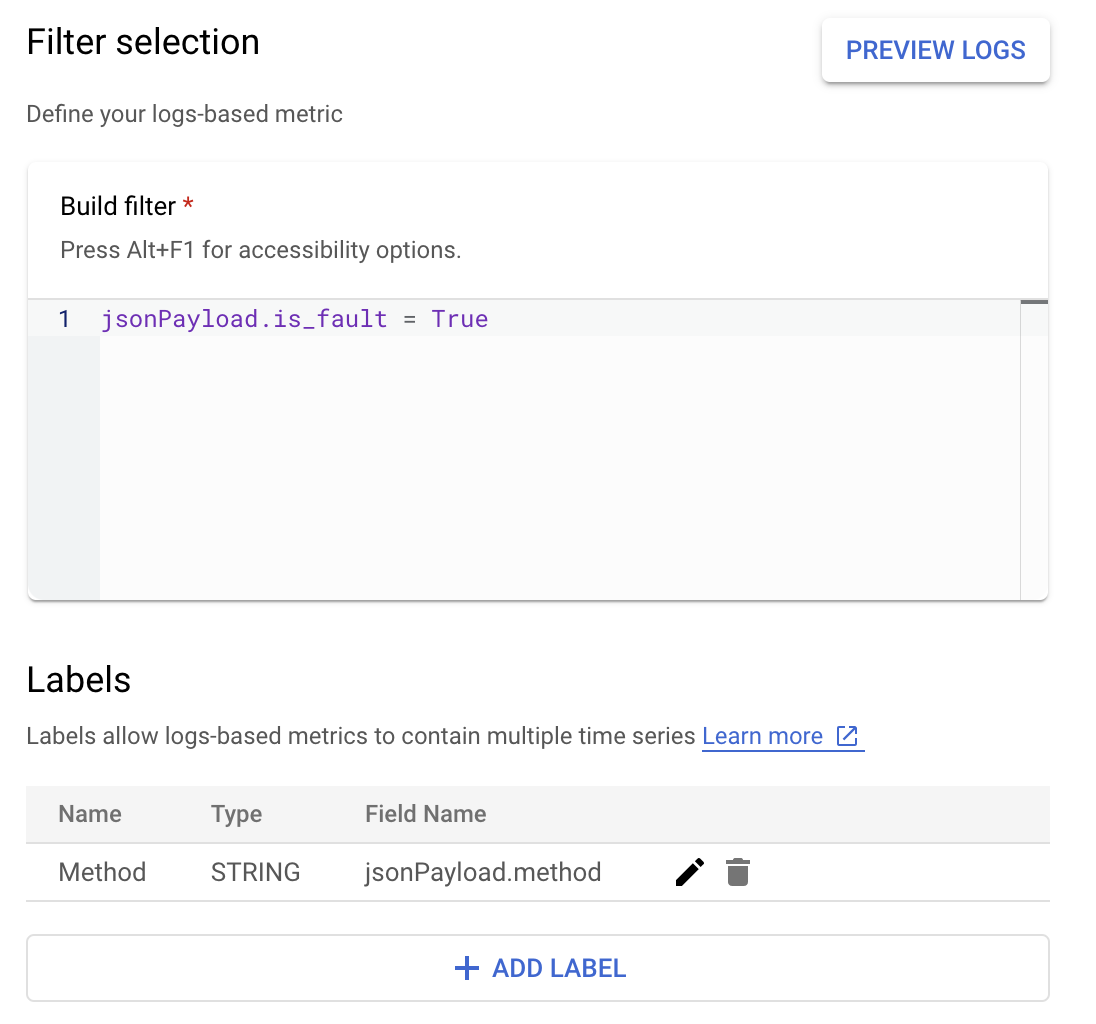
In Cloud Logging, labels let you group your metrics into categories based on other data in the logs. You can configure a label for the method field sent to Cloud Logging in order to look at how the error count is broken down by the Google Ads API method.
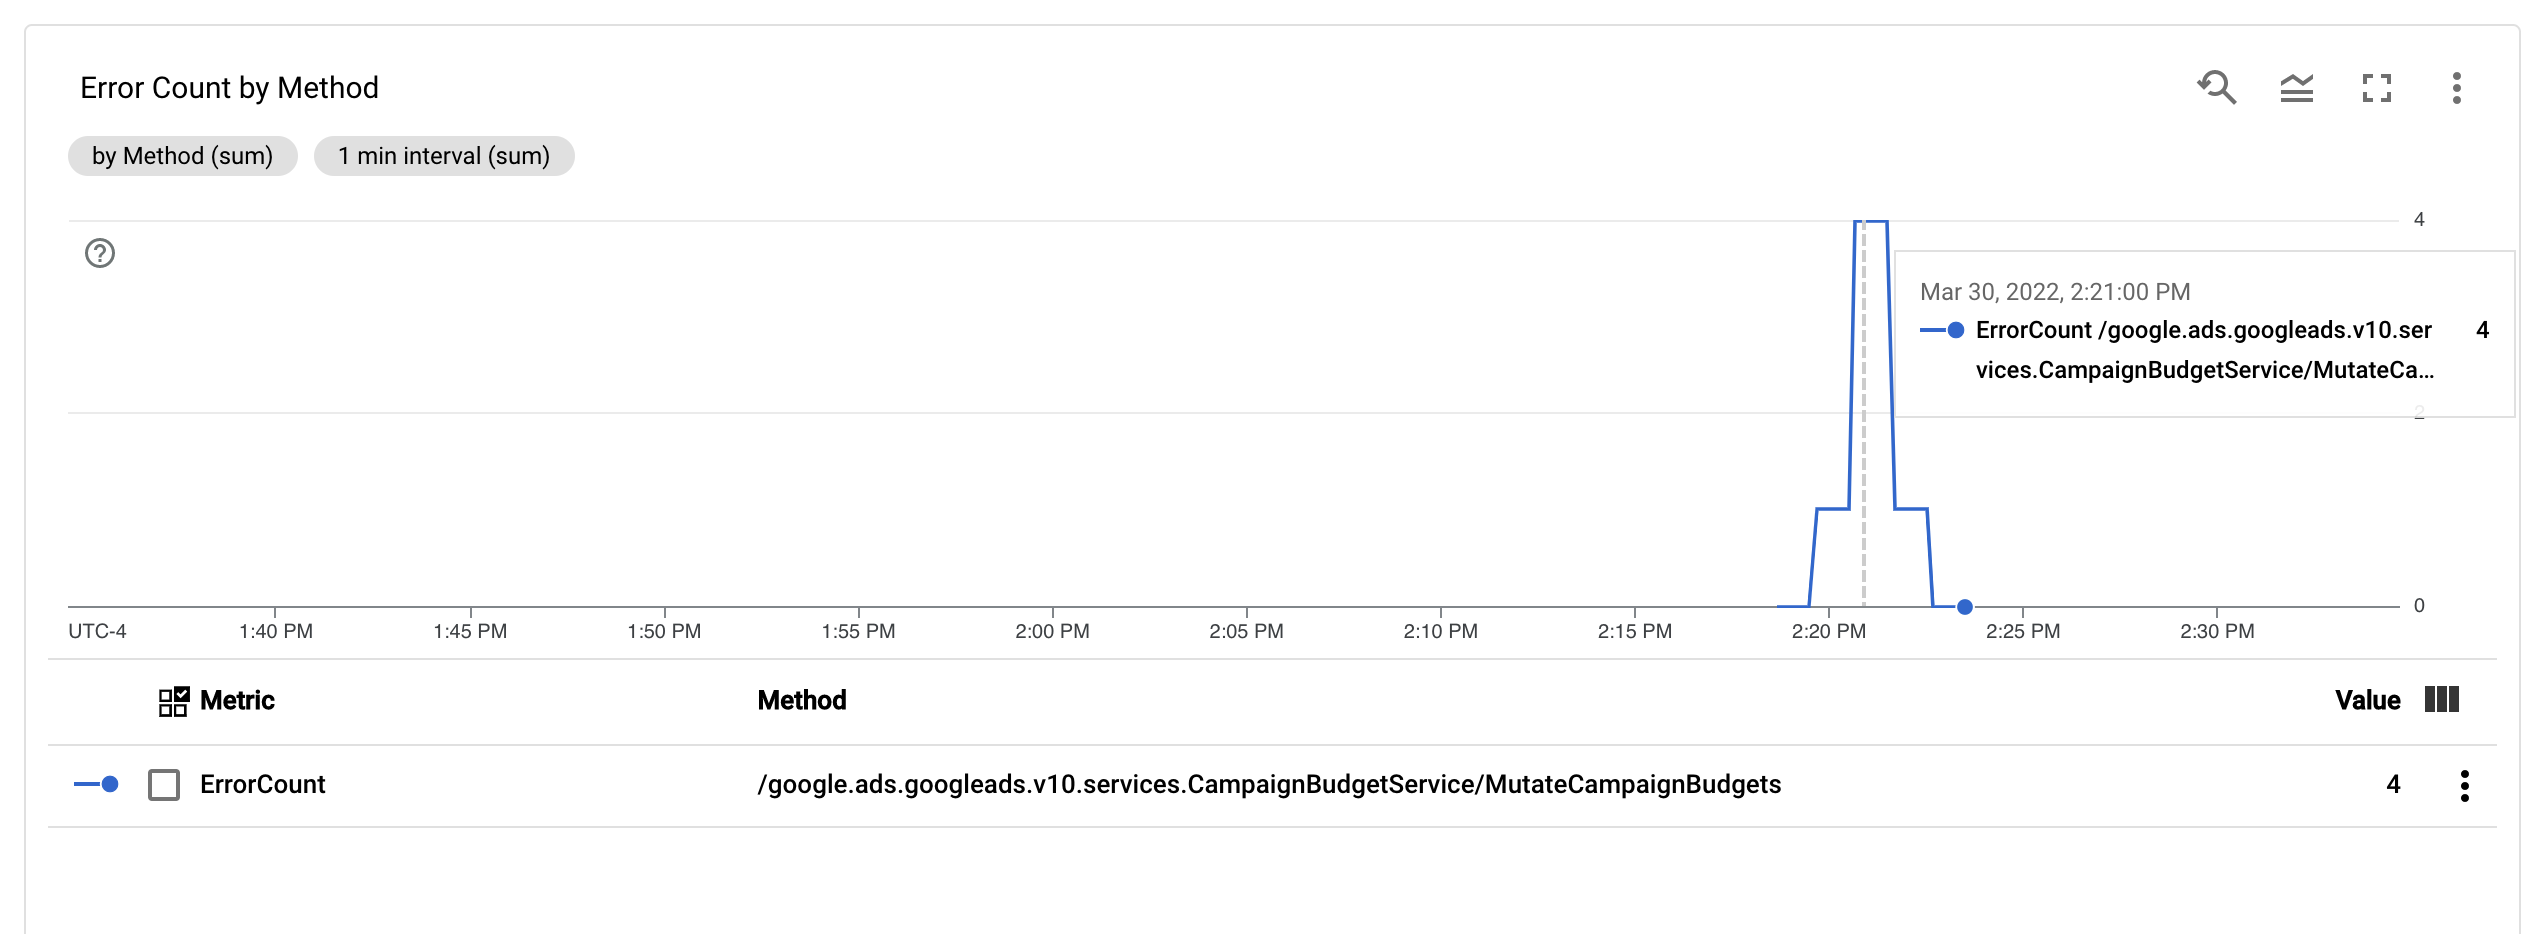
Настроив метрику ErrorCount и метку Method , вы можете создать новый график на панели мониторинга для отслеживания ErrorCount , сгруппированный по Method .
Оповещения
It's possible in Cloud Monitoring and in other tools to configure alert policies that specify when and how alerts should be triggered by your metrics. For instructions on setting up Cloud Monitoring alerts, follow the alerts guide .