
最佳化效能的第一步是找出重要指標,通常與延遲和輸送量有關。新增監控功能來擷取及追蹤這些指標,可找出應用程式的弱點。有了指標,您就能進行最佳化,進而提升成效指標。
此外,許多監控工具可讓您為指標設定快訊,在達到特定門檻時收到通知。舉例來說,您可以設定快訊,在失敗要求百分比比正常水準增加超過 x% 時收到通知。監控工具可協助您瞭解正常效能,並找出延遲時間、錯誤數量和其他重要指標的異常尖峰。在業務關鍵時間範圍內,或將新程式碼推送至正式環境後,監控這些指標的能力就顯得格外重要。
找出延遲指標
請盡可能確保 UI 保持回應性,並注意使用者對行動應用程式的標準更高。此外,也應測量及追蹤後端服務的延遲時間,因為如果未檢查,可能會導致輸送量問題。
建議追蹤的指標包括:
- 要求時間長度
- 以子系統精細度 (例如 API 呼叫) 顯示的要求時間長度
- 工作時間長度
找出輸送量指標
處理量是指在指定時間內處理的要求總數。子系統的延遲可能會影響總處理量,因此您可能需要針對延遲進行最佳化,以提升總處理量。
建議追蹤的指標包括:
- 每秒查詢次數
- 每秒傳輸的資料大小
- 每秒的 I/O 作業數
- 資源使用率,例如 CPU 或記憶體用量
- 待處理工作量大小,例如 Pub/Sub 或執行緒數量
不只是平均值
評估成效時,常見的錯誤是只查看平均值。雖然這項資訊很有用,但無法深入瞭解延遲時間的分布情形。建議您追蹤成效百分位數,例如指標的第 50/75/90/99 個百分位數。
一般來說,最佳化作業可分為兩個步驟。首先,請針對第 90 個百分位數的延遲時間進行最佳化。接著,請考慮第 99 個百分位數,也就是尾延遲:一小部分要求需要較長時間才能完成。
伺服器端監控,可取得詳細結果
一般來說,追蹤指標時最好使用伺服器端剖析。伺服器端通常更容易進行儀表化,可存取更精細的資料,且較不受連線問題干擾。
瀏覽器監控功能,提供端對端可觀測性
瀏覽器剖析可提供有關使用者體驗的額外深入分析。這項功能會顯示要求速度緩慢的網頁,方便您與伺服器端監控建立關聯,進一步分析。
Google Analytics 提供網頁載入時間的即時監控功能,您可以在網頁計時報表中查看相關資訊。這項功能提供多種實用檢視畫面,可協助您瞭解網站的使用者體驗,特別是:
- 網頁載入時間
- 重新導向載入時間
- 伺服器回應時間
雲端監控
您可以使用多種工具擷取及監控應用程式的效能指標。舉例來說,您可以使用 Google Cloud Logging 將效能指標記錄到 Google Cloud 專案,然後在 Google Cloud Monitoring 中設定資訊主頁,監控及區隔記錄的指標。
如需從 Python 用戶端程式庫的自訂攔截器記錄到 Google Cloud Logging 的範例,請參閱記錄指南。在 Google Cloud 中取得這些資料後,您就能根據記錄的資料建立指標,透過 Google Cloud Monitoring 掌握應用程式的狀況。請按照使用者定義記錄指標的指南操作,使用傳送至 Google Cloud Logging 的記錄建立指標。
或者,您也可以使用 Monitoring 用戶端程式庫在程式碼中定義指標,並將指標直接傳送至 Monitoring,與記錄分開。
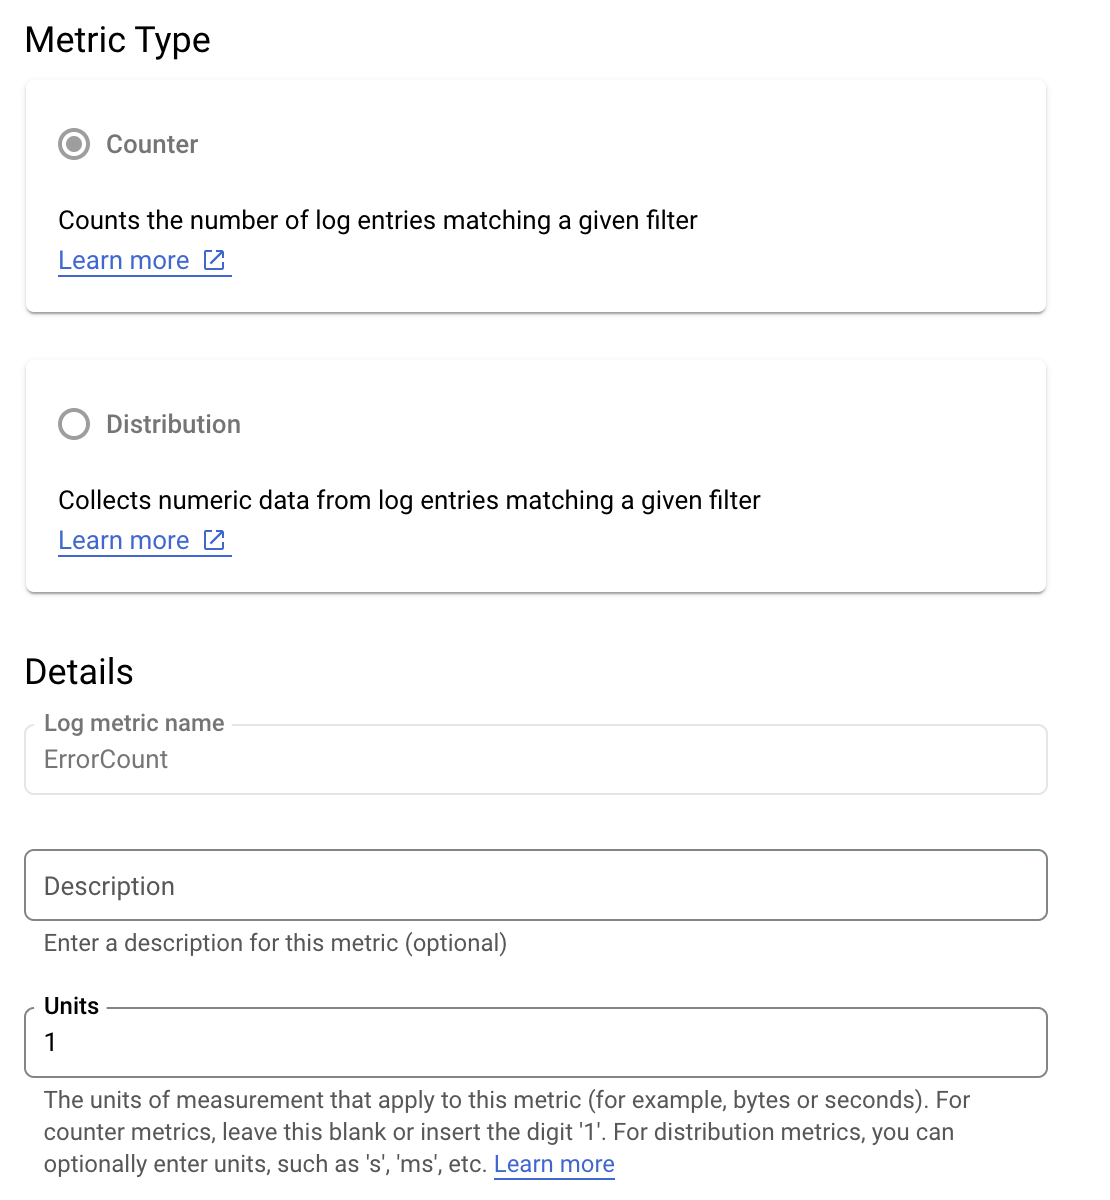
記錄指標範例
假設您想監控 is_fault 值,以便更瞭解應用程式中的錯誤率。您可以從記錄中將 is_fault 值擷取到新的計數器指標 ErrorCount。
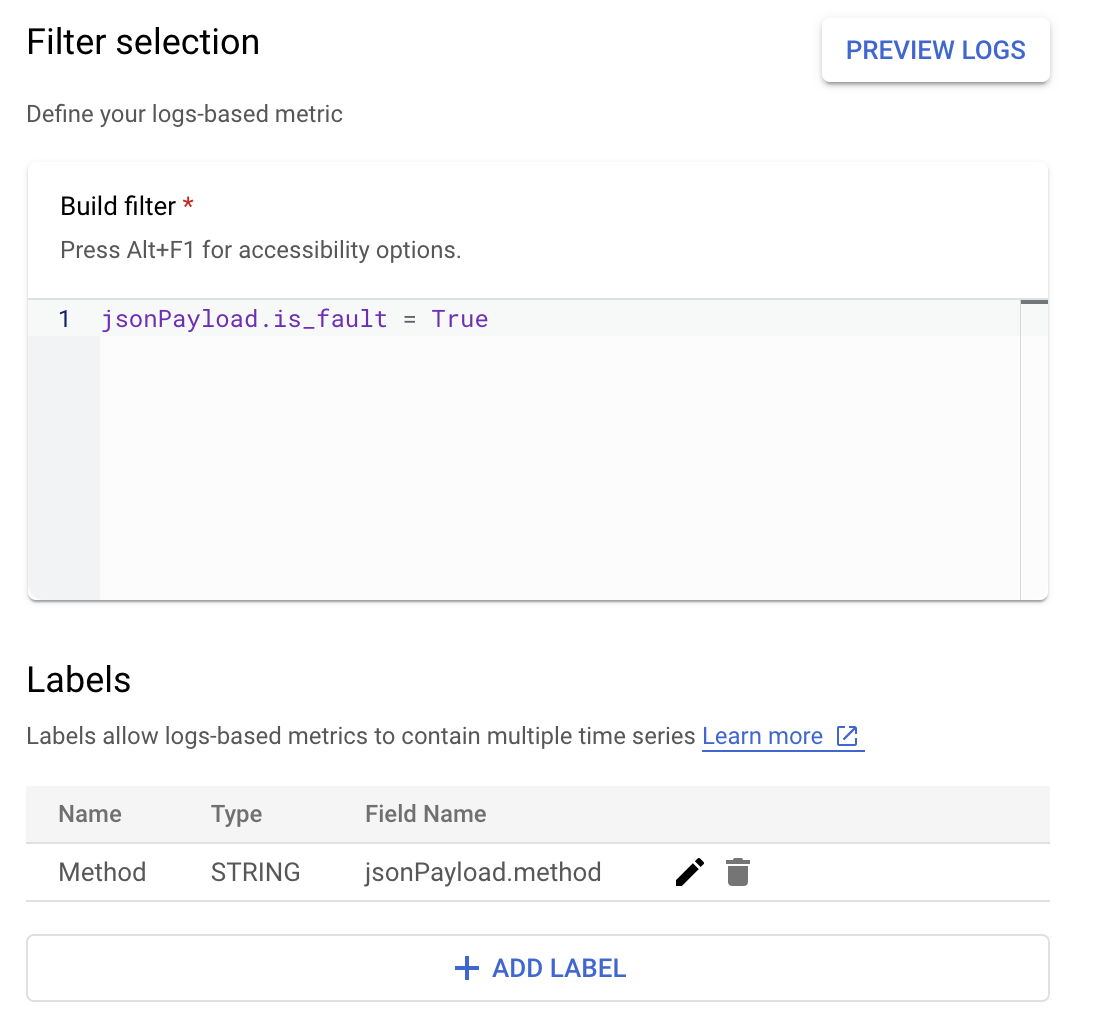
在 Cloud Logging 中,標籤可讓您根據記錄檔中的其他資料,將指標分組為不同類別。您可以為傳送至 Cloud Logging 的 method 欄位設定標籤,查看 Google Ads API 方法的錯誤計數細目。
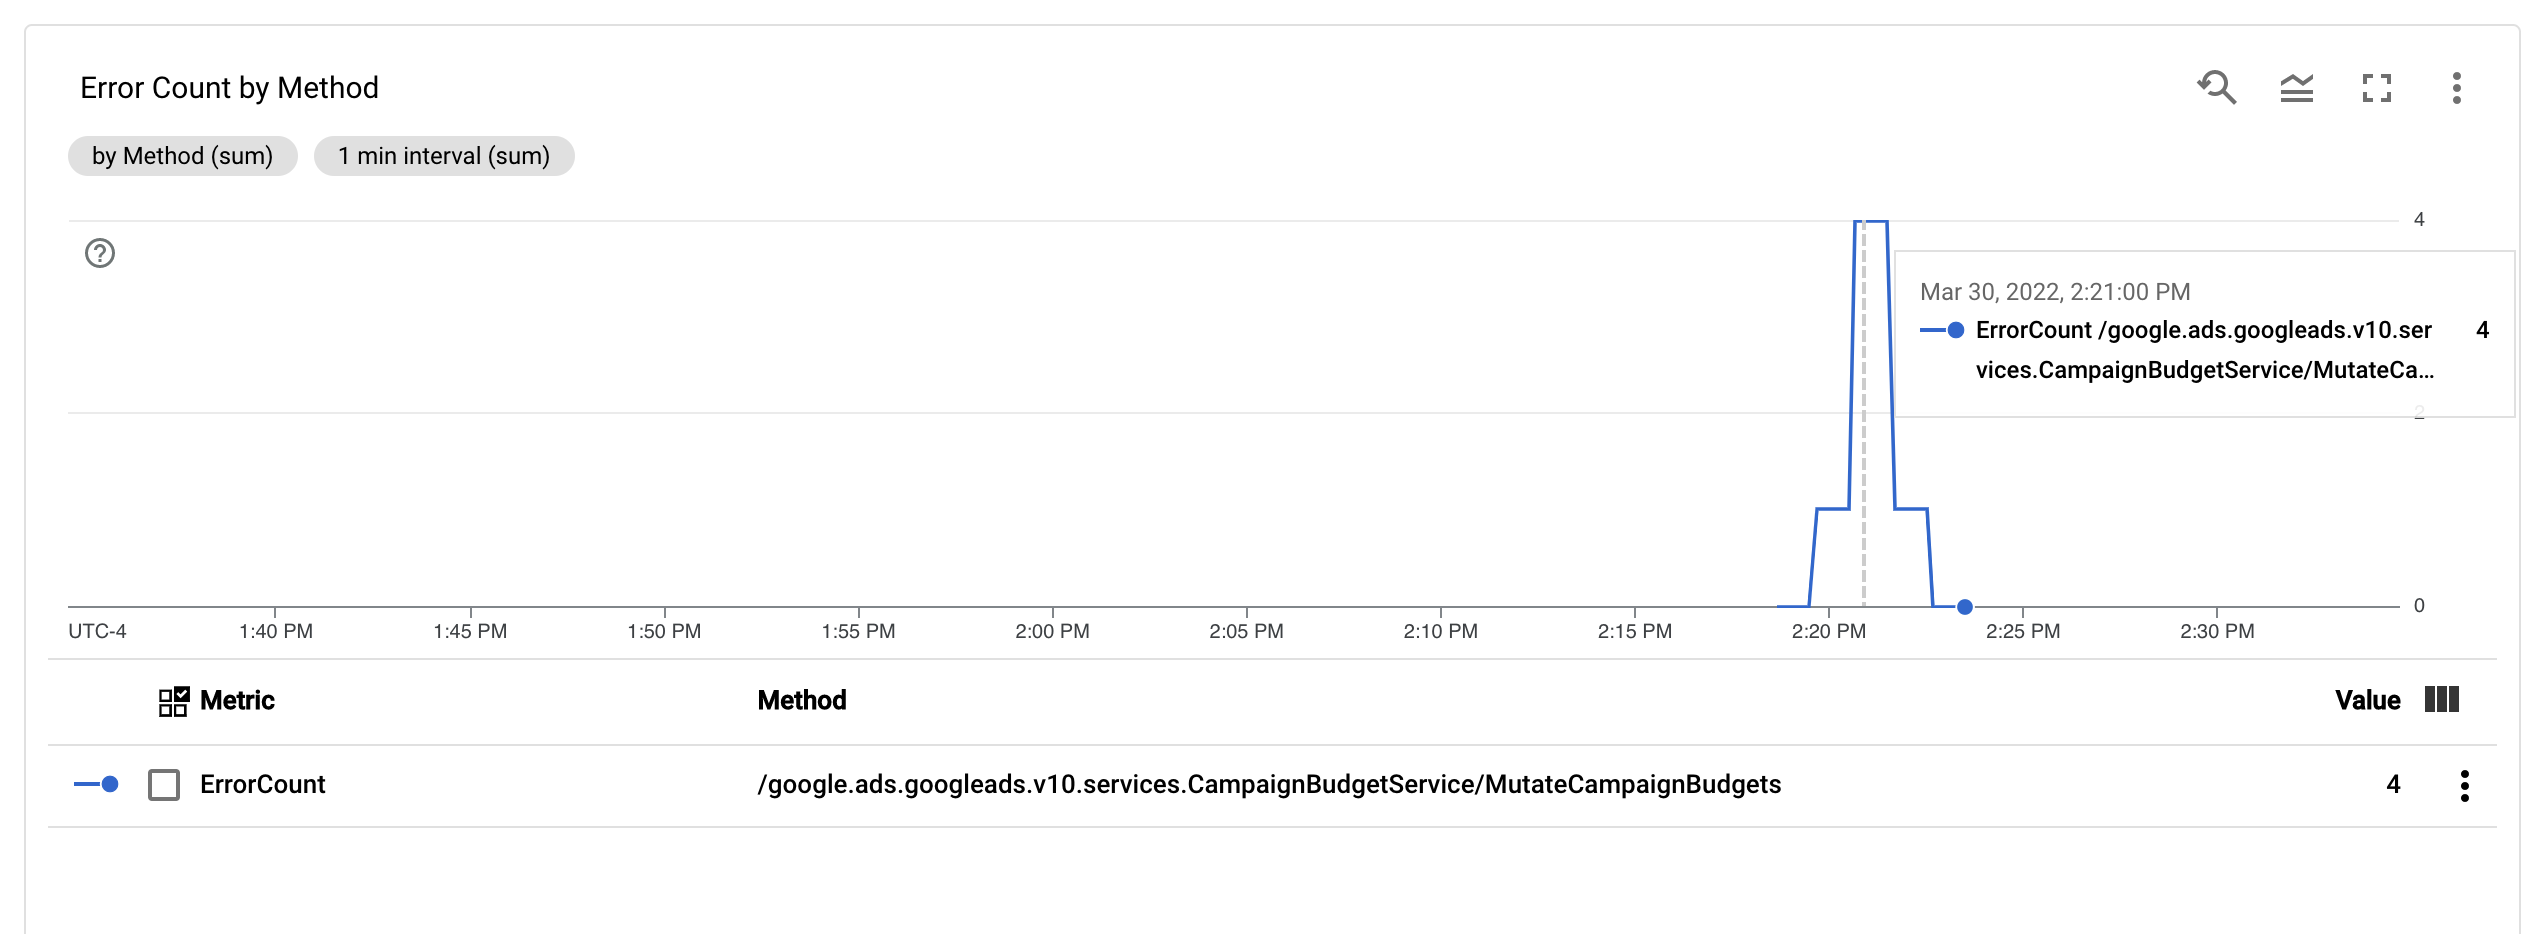
設定 ErrorCount 指標和 Method 標籤後,您可以在 Monitoring 資訊主頁中建立新圖表,監控依 Method 分組的 ErrorCount。
快訊
您可以在 Cloud Monitoring 和其他工具中設定警示政策,指定指標應在何時及如何觸發警示。如需設定 Cloud Monitoring 快訊的操作說明,請參閱快訊指南。