
성능 최적화는 일반적으로 지연 시간 및 처리량과 관련된 주요 측정항목을 식별하는 것에서 시작됩니다. 이러한 측정항목을 캡처하고 추적하기 위해 모니터링을 추가하면 애플리케이션의 취약점이 노출됩니다. 측정항목을 사용하면 최적화를 통해 성능 측정항목을 개선할 수 있습니다.
또한 많은 모니터링 도구를 사용하면 특정 기준점에 도달하면 알림을 받을 수 있도록 측정항목에 대한 알림을 설정할 수 있습니다. 예를 들어 실패한 요청의 비율이 정상 수준의 x% 이상 증가할 때 알림을 보내도록 설정할 수 있습니다. 모니터링 도구를 사용하면 정상적인 성능을 확인하고 지연 시간, 오류 수량, 기타 주요 측정항목의 비정상적인 급증을 식별할 수 있습니다. 이러한 측정항목을 모니터링하는 기능은 비즈니스에 중요한 기간 동안이나 새 코드가 프로덕션에 푸시된 후에 특히 중요합니다.
지연 시간 측정항목 식별
사용자는 모바일 앱에서 훨씬 더 높은 표준을 기대한다는 점을 고려하여 UI의 응답성을 최대한 유지해야 합니다. 백엔드 서비스의 지연 시간도 측정 및 추적해야 합니다. 선택하지 않으면 처리량 문제가 발생할 수 있기 때문입니다.
추적할 추천 측정항목은 다음과 같습니다.
- 요청 기간
- 하위 시스템 세부사항의 요청 기간 (예: API 호출)
- 작업 기간
처리량 측정항목 식별
처리량은 지정된 기간 동안 제공된 총 요청 수를 측정합니다. 처리량은 하위 시스템의 지연 시간의 영향을 받을 수 있으므로 처리량을 개선하려면 지연 시간을 최적화해야 할 수 있습니다.
다음은 추적할 만한 몇 가지 추천 측정항목입니다.
- 초당 쿼리 수
- 초당 전송 데이터 크기
- 초당 I/O 작업 수
- CPU 또는 메모리 사용량과 같은 리소스 사용률
- Pub/Sub 또는 스레드 수와 같은 처리 백로그 크기
평균값뿐만 아니라
성능을 측정할 때 흔히 발생하는 실수는 평균적인 사례만 살펴보는 것입니다. 이 방법은 유용하지만 지연 시간 분포에 관한 유용한 정보는 제공하지 않습니다. 추적하기에 더 좋은 측정항목은 성능 백분위수입니다(예: 측정항목의 50번째/75번째/90/99번째 백분위수).
일반적으로 최적화는 두 단계로 수행할 수 있습니다. 먼저 90번째 백분위수 지연 시간에 맞게 최적화합니다 그런 다음 꼬리 지연 시간이라고도 하는 99번째 백분위수, 즉 완료하는 데 훨씬 더 오래 걸리는 요청의 작은 부분을 고려합니다.
자세한 결과를 위한 서버 측 모니터링
측정항목 추적에는 일반적으로 서버 측 프로파일링이 선호됩니다. 서버 측은 일반적으로 훨씬 쉽게 계측하고 더 세분화된 데이터에 액세스할 수 있으며 연결 문제로 인한 변동을 덜 받습니다.
엔드 투 엔드 가시성을 위한 브라우저 모니터링
브라우저 프로파일링을 통해 최종 사용자 환경에 대한 유용한 정보를 추가로 얻을 수 있습니다. 요청이 느린 페이지를 표시할 수 있으며, 이를 서버 측 모니터링과 연관시켜 추가 분석을 수행할 수 있습니다.
Google 애널리틱스는 페이지 시간 보고서에서 즉시 페이지 로드 시간을 모니터링할 수 있는 기능을 제공합니다. 이는 특히 사이트의 사용자 환경을 이해하는 데 유용한 여러 뷰를 제공합니다.
- 페이지 로드 시간
- 리디렉션 로드 시간
- 서버 응답 시간
클라우드에서 모니터링
애플리케이션의 성능 측정항목을 캡처하고 모니터링하는 데 사용할 수 있는 도구가 많이 있습니다. 예를 들어 Google Cloud Logging을 사용하여 Google Cloud 프로젝트에 성능 측정항목을 로깅한 다음 Google Cloud Monitoring에서 대시보드를 설정하여 로깅된 측정항목을 모니터링하고 분류할 수 있습니다.
Python 클라이언트 라이브러리의 커스텀 인터셉터에서 Google Cloud Logging에 로깅하는 예시는 로깅 가이드를 참조하세요. Google Cloud에서 제공되는 해당 데이터를 통해 로깅된 데이터 위에 측정항목을 빌드하여 Google Cloud Monitoring을 통해 애플리케이션에 대한 가시성을 확보할 수 있습니다. Google Cloud Logging에 전송된 로그를 사용하여 측정항목을 빌드하려면 사용자 정의 로그 기반 측정항목 가이드를 따르세요.
또는 Monitoring 클라이언트 라이브러리를 사용하여 코드에서 측정항목을 정의하고 로그와 별도로 Monitoring에 직접 전송할 수 있습니다.
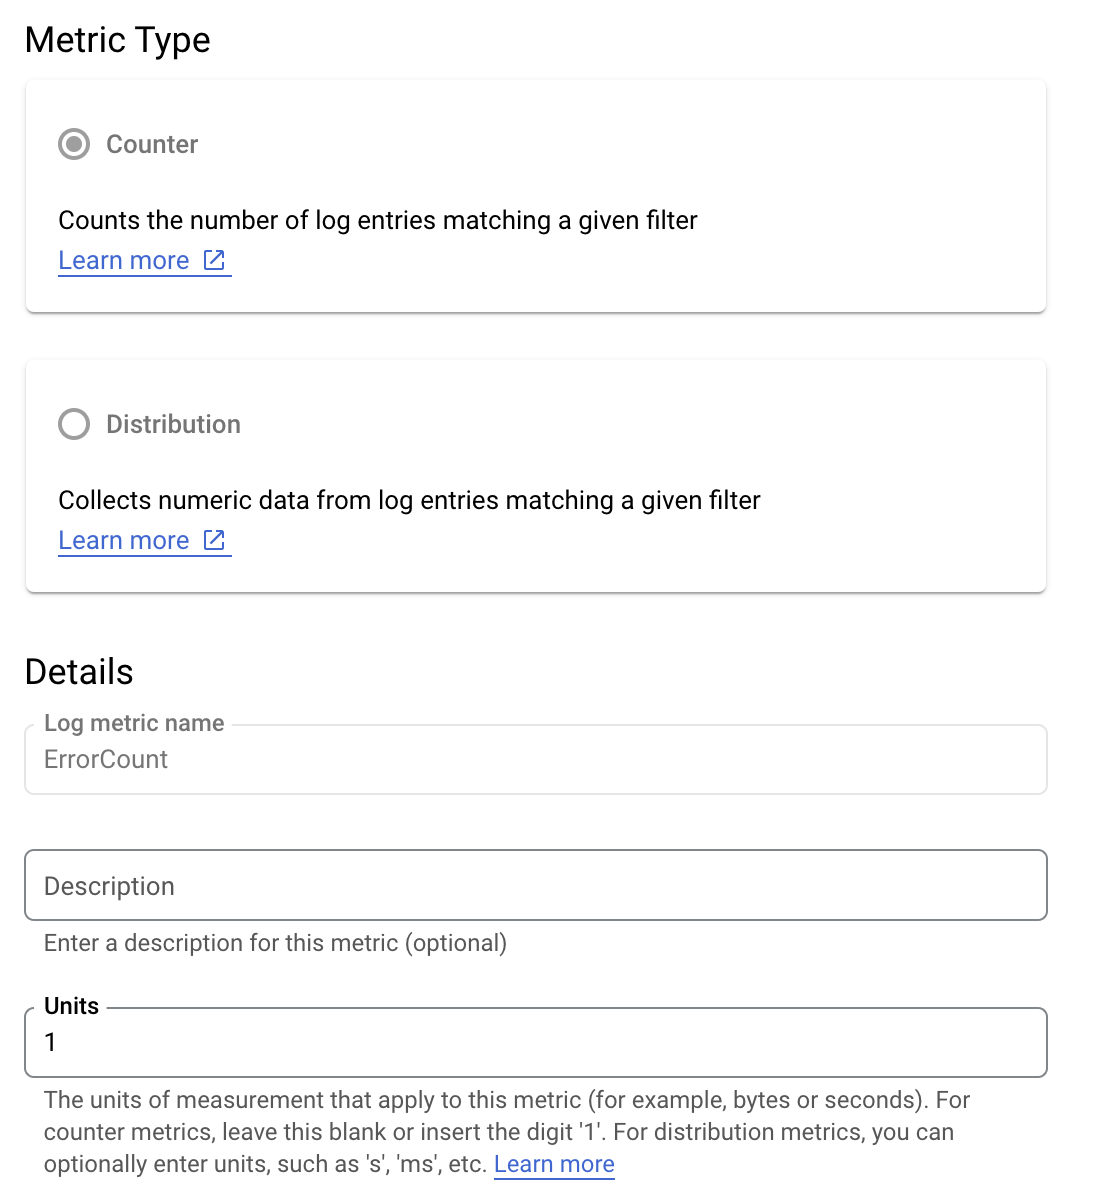
로그 기반 측정항목 예시
애플리케이션의 오류율을 보다 잘 이해하기 위해 is_fault 값을 모니터링한다고 가정해 보겠습니다. 로그에서 is_fault 값을 새로운 카운터 측정항목인 ErrorCount로 추출할 수 있습니다.
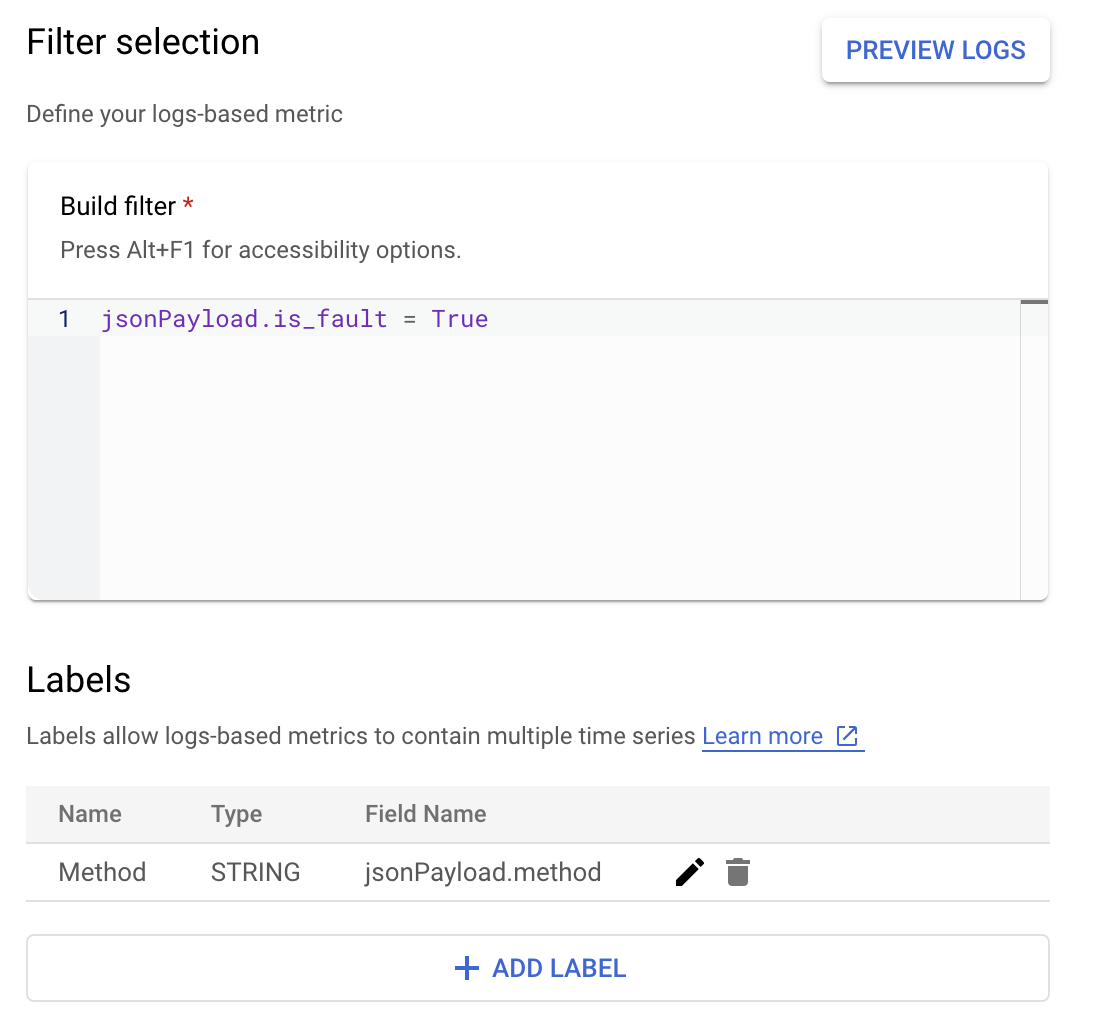
Cloud Logging에서 라벨을 사용하면 로그의 다른 데이터를 기반으로 측정항목을 카테고리로 그룹화할 수 있습니다. Cloud Logging으로 전송되는 method 필드의 라벨을 구성하여 Google Ads API 메서드가 오류 수를 어떻게 세분화하는지 살펴볼 수 있습니다.
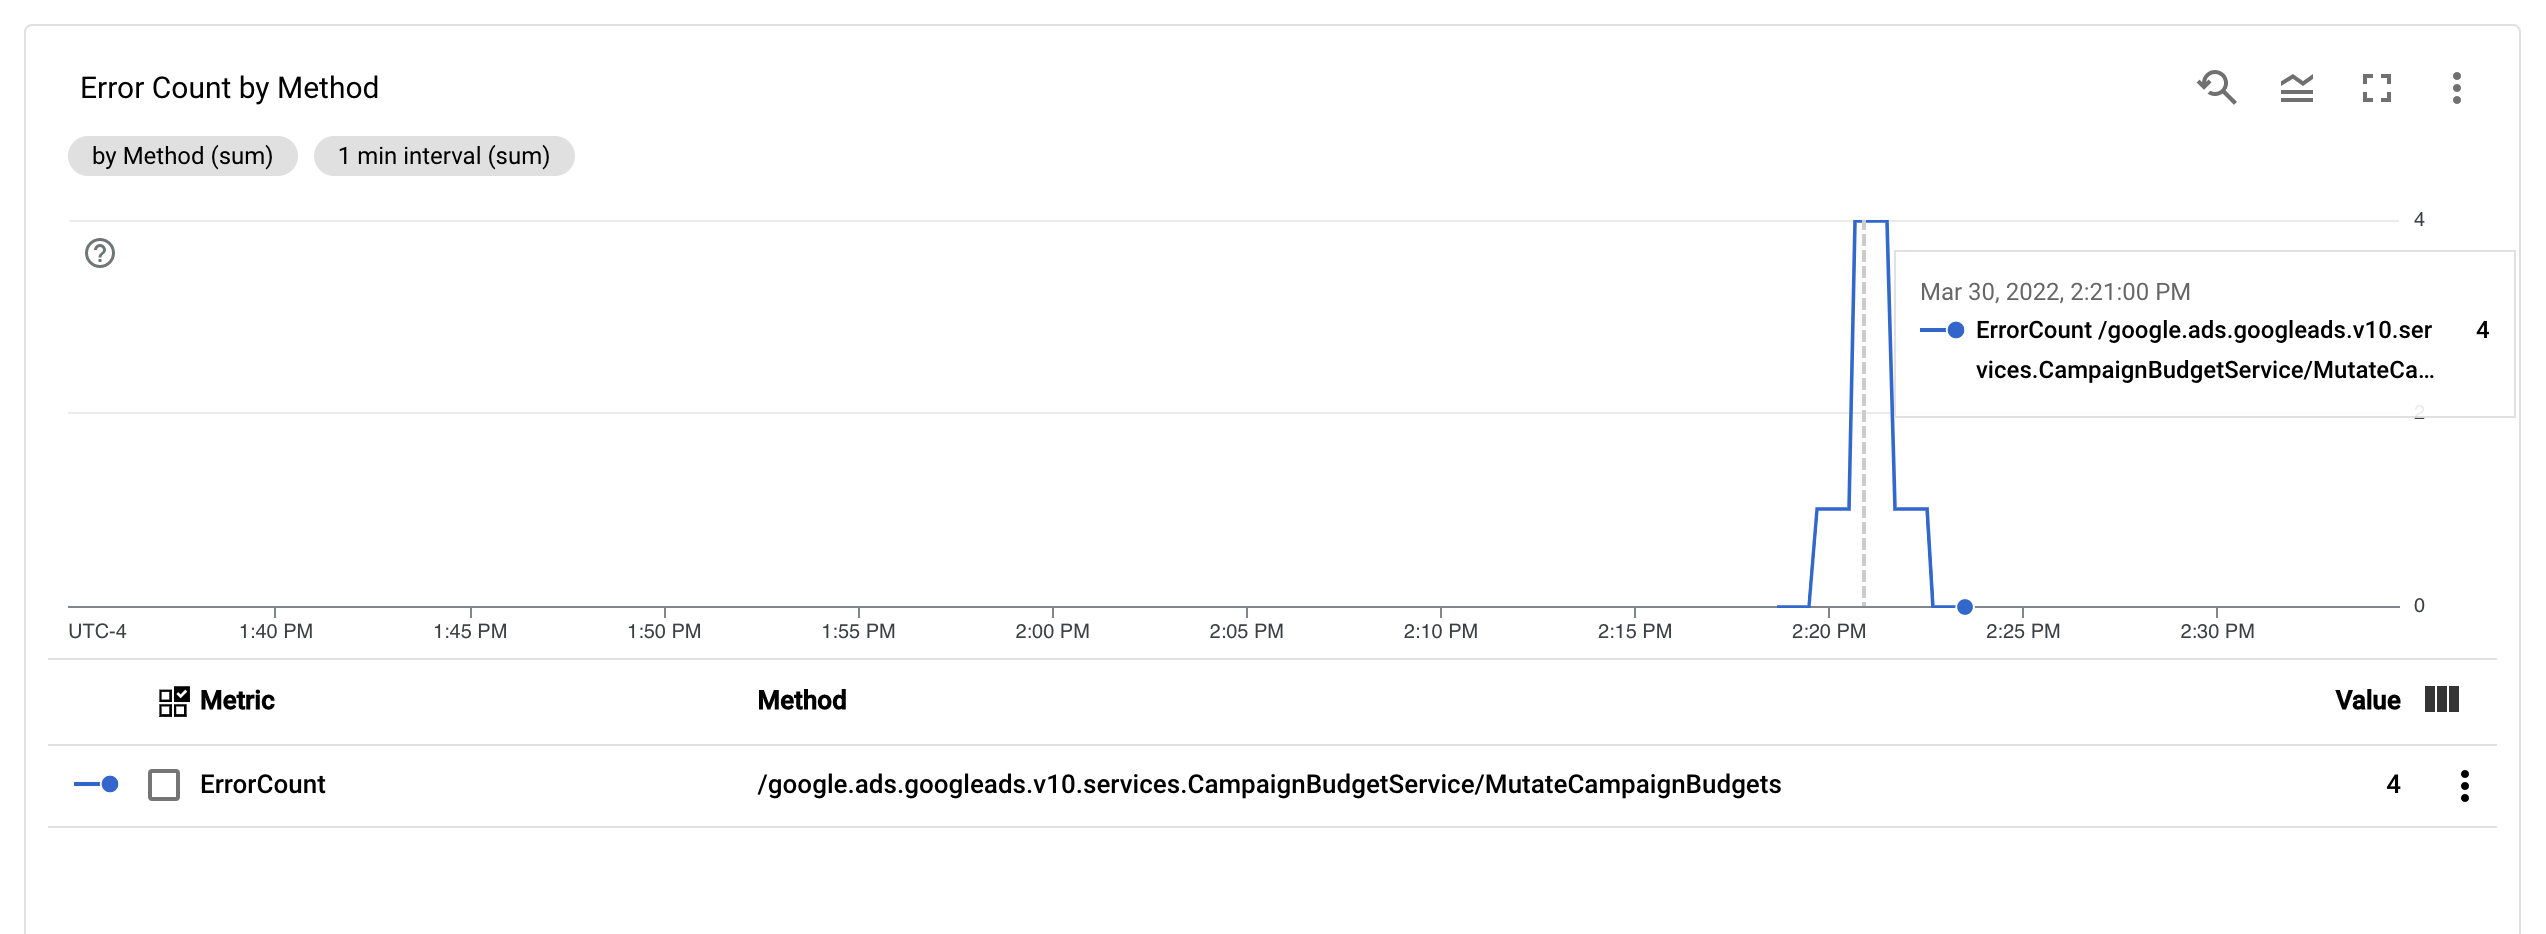
ErrorCount 측정항목과 Method 라벨을 구성하면 Monitoring 대시보드에 새 차트를 만들어 Method별로 그룹화된 ErrorCount를 모니터링할 수 있습니다.
알림
Cloud Monitoring 및 다른 도구에서 측정항목이 언제 어떻게 알림을 트리거할지 지정하는 알림 정책을 구성할 수 있습니다. Cloud Monitoring 알림 설정에 대한 안내는 알림 가이드를 참조하세요.