
Page Summary
-
Performance optimization involves identifying and tracking key metrics like latency and throughput to expose weak points in applications.
-
Measuring performance should go beyond the average, including performance percentiles like the 90th and 99th percentile.
-
Server-side and browser monitoring provide different but valuable insights into application and end-user performance.
-
Cloud tools like Google Cloud Logging and Monitoring can be used to capture, track, and alert on performance metrics.
Performance optimization starts with identifying key metrics, usually related to latency and throughput. The addition of monitoring to capture and track these metrics exposes weak points in the application. With metrics, optimization can be undertaken to improve performance metrics.
Additionally, many monitoring tools let you set up alerts for your metrics, so that you are notified when a certain threshold is met. For example, you might set up an alert to notify you when the percentage of failed requests increases by more than x% of the normal levels. Monitoring tools can help you identify what normal performance looks like and identify unusual spikes in latency, error quantities, and other key metrics. The ability to monitor these metrics is especially important during business critical timeframes, or after new code has been pushed to production.
Identify latency metrics
Ensure that you keep your UI as responsive as you can, noting that users expect even higher standards from mobile apps. Latency should also be measured and tracked for backend services, particularly since it can lead to throughput issues if left unchecked.
Suggested metrics to track include the following:
- Request duration
- Request duration at subsystem granularity (such as API calls)
- Job duration
Identify throughput metrics
Throughput is a measure of the total number of requests served over a given period of time. Throughput can be affected by latency of subsystems, so you might need to optimize for latency to improve throughput.
Here are some suggested metrics to track:
- Queries per second
- Size of data transferred per second
- Number of I/O operations per second
- Resource utilization, such as CPU or memory usage
- Size of processing backlog, such as pub/sub or number of threads
Not just the mean
A common mistake in measuring performance is only looking at the mean (average) case. While this is useful, it doesn't provide insight into the distribution of latency. A better metric to track is the performance percentiles, for example the 50th/75th/90th/99th percentile for a metric.
Generally, optimizing can be done in two steps. First, optimize for 90th percentile latency. Then, consider the 99th percentile—also known as tail latency: the small portion of requests which take much longer to complete.
Server-side monitoring for detailed results
Server-side profiling is generally preferred for tracking metrics. The server side is usually much easier to instrument, allows access to more granular data, and is less subject to perturbation from connectivity issues.
Browser monitoring for end-to-end visibility
Browser profiling can provide additional insights into the end user experience. It can show which pages have slow requests, which you can then correlate to server-side monitoring for further analysis.
Google Analytics provides out-of-the-box monitoring for page load times in the page timings report. This provides several useful views for understanding the user experience on your site, in particular:
- Page load times
- Redirect load times
- Server response times
Monitoring in the cloud
There are many tools you can use to capture and monitor performance metrics for your application. For example, you can use Google Cloud Logging to log performance metrics to your Google Cloud Project, then set up dashboards in Google Cloud Monitoring to monitor and segment the logged metrics.
Check out the Logging guide for an example of logging to Google Cloud Logging from a custom interceptor in the Python client library. With that data available in Google Cloud, you can build metrics on top of the logged data to gain visibility into your application through Google Cloud Monitoring. Follow the guide for user-defined log-based metrics to build metrics using the logs sent to Google Cloud Logging.
Alternatively, you could use the Monitoring client libraries to define metrics in your code and send them directly to Monitoring, separate from the logs.
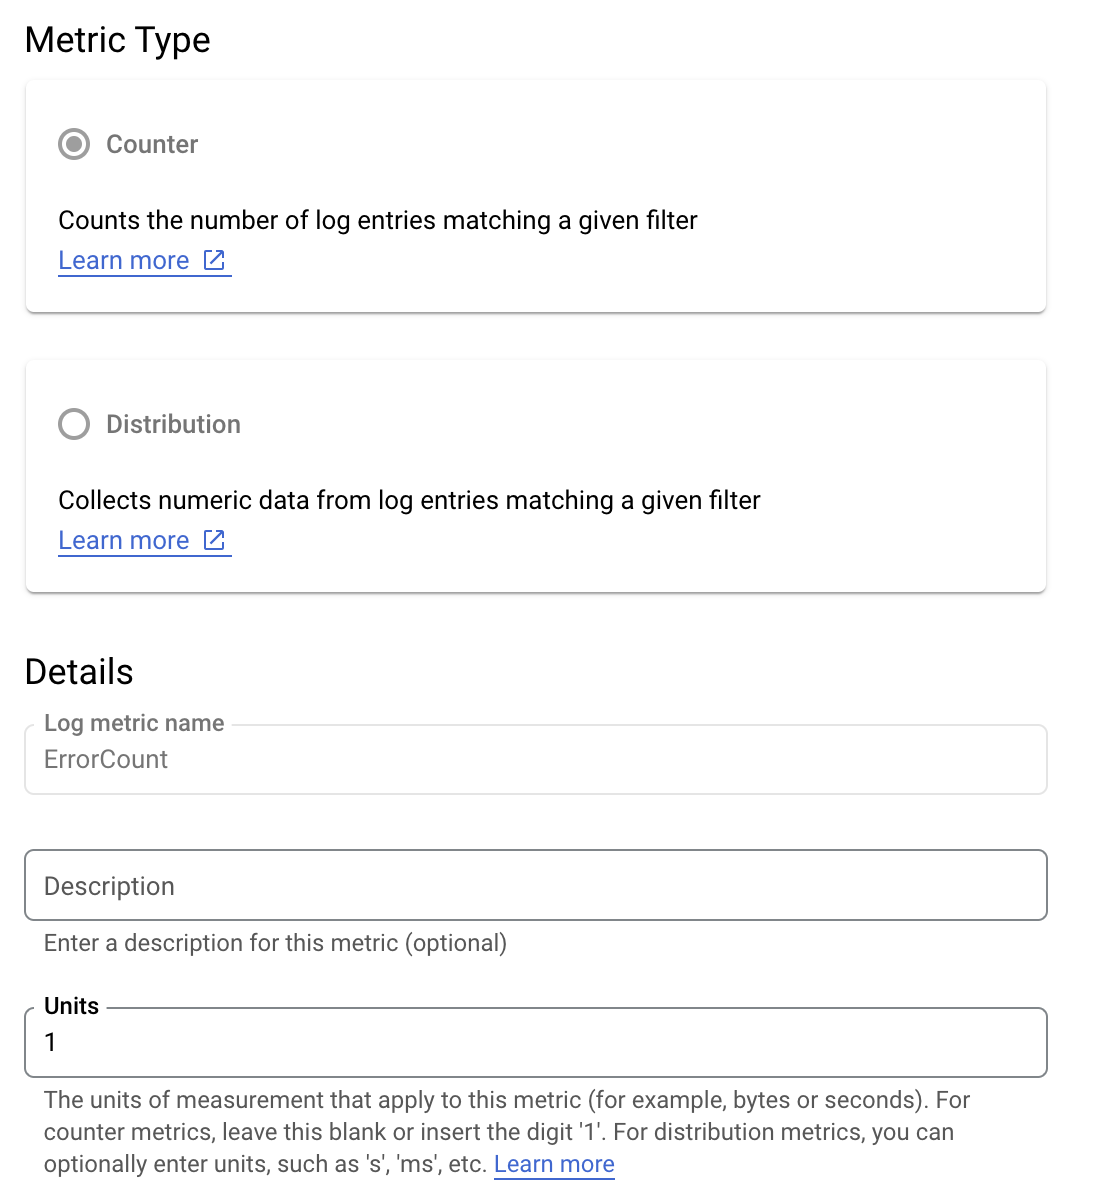
Log-based metrics example
Suppose you want to monitor the is_fault value to better understand error
rates in your application. You can extract the is_fault value from the logs
into a new counter metric, ErrorCount.
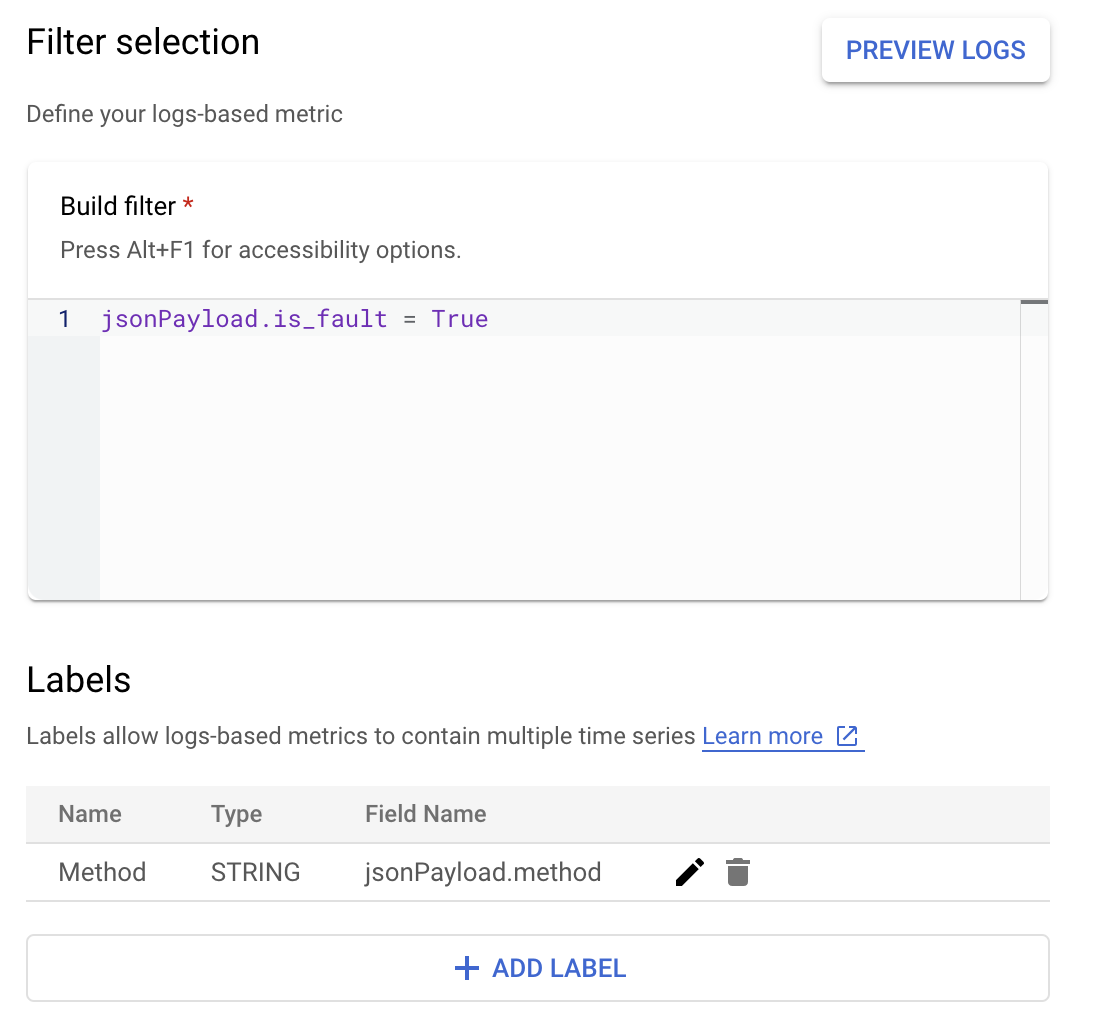
In Cloud Logging, labels let you group your metrics into categories
based on other data in the logs. You can configure a label for the method
field sent to Cloud Logging in order to look at how the error count is
broken down by the Google Ads API method.
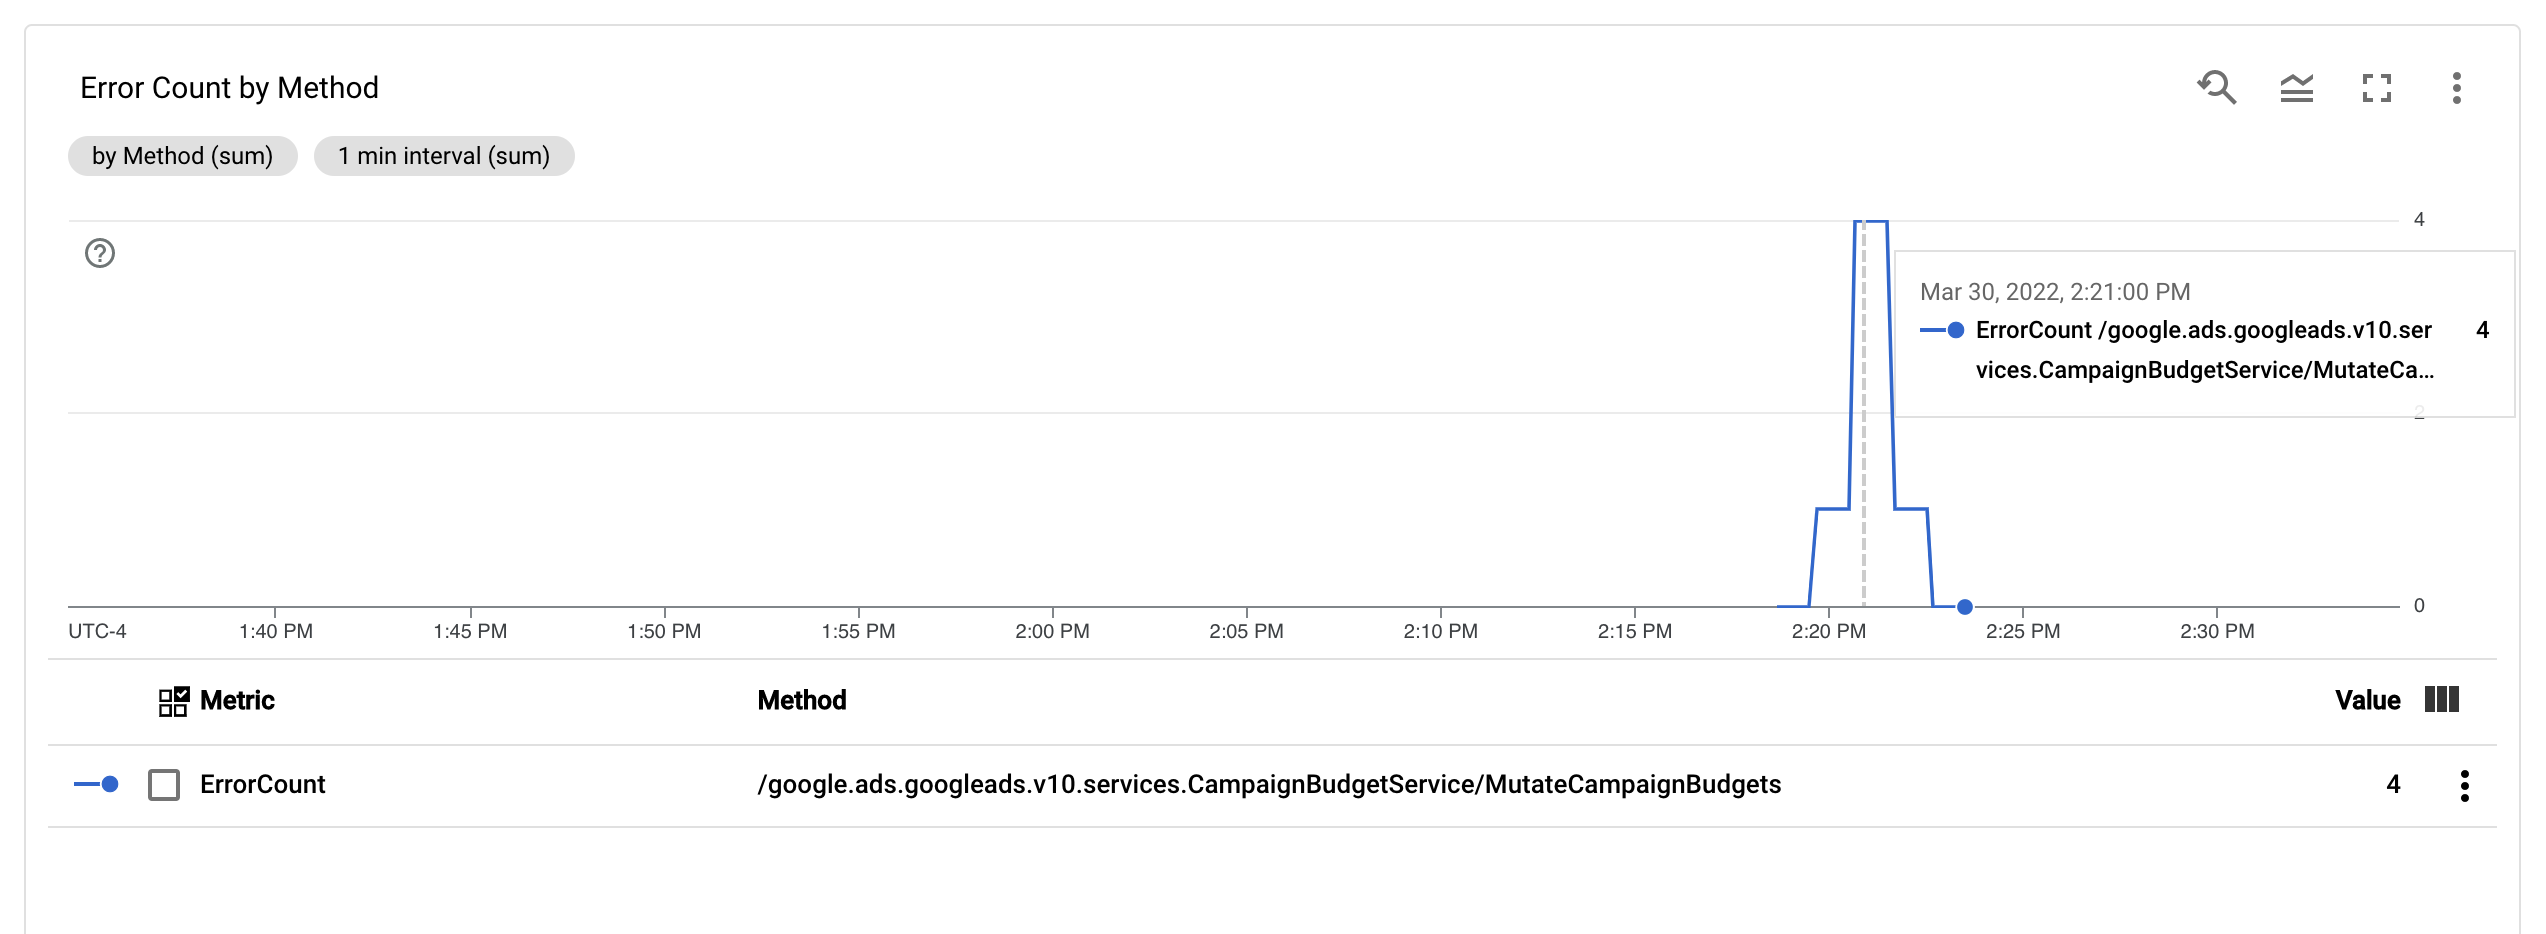
With the ErrorCount metric and the Method label configured, you can create
a new
chart in
a Monitoring dashboard to monitor ErrorCount, grouped by Method.
Alerts
It's possible in Cloud Monitoring and in other tools to configure alert policies that specify when and how alerts should be triggered by your metrics. For instructions on setting up Cloud Monitoring alerts, follow the alerts guide.