Styl oparty na danych w przypadku zbiorów danych umożliwia przesyłanie własnych zbiorów danych geoprzestrzennych, stosowanie do nich niestandardowych stylów i wyświetlanie tych elementów danych na mapach. Dzięki stylowi opartemu na danych w przypadku zbiorów danych możesz tworzyć wizualizacje danych na podstawie geometrii punktów, linii łamanych i wielokątów oraz sprawiać, że elementy danych będą reagować na kliknięcia. Styl oparty na danych w przypadku zbiorów danych jest obsługiwany tylko na mapach wektorowych (wymagany jest identyfikator mapy).
Dodawanie niestandardowych zbiorów danych geoprzestrzennych
Dodaj dane niestandardowe za pomocą konsoli Google Cloud lub Google Cloud Shell. Każdy zbiór danych ma unikalny identyfikator, który możesz powiązać ze stylem mapy.
Obsługiwane są te formaty danych:
Po przesłaniu danych niestandardowych i powiązaniu ich ze stylem mapy oraz identyfikatorem mapy możesz określić styl elementów danych, aby uzyskać efekt wizualny, oraz sprawić, że elementy będą reagować na kliknięcia.
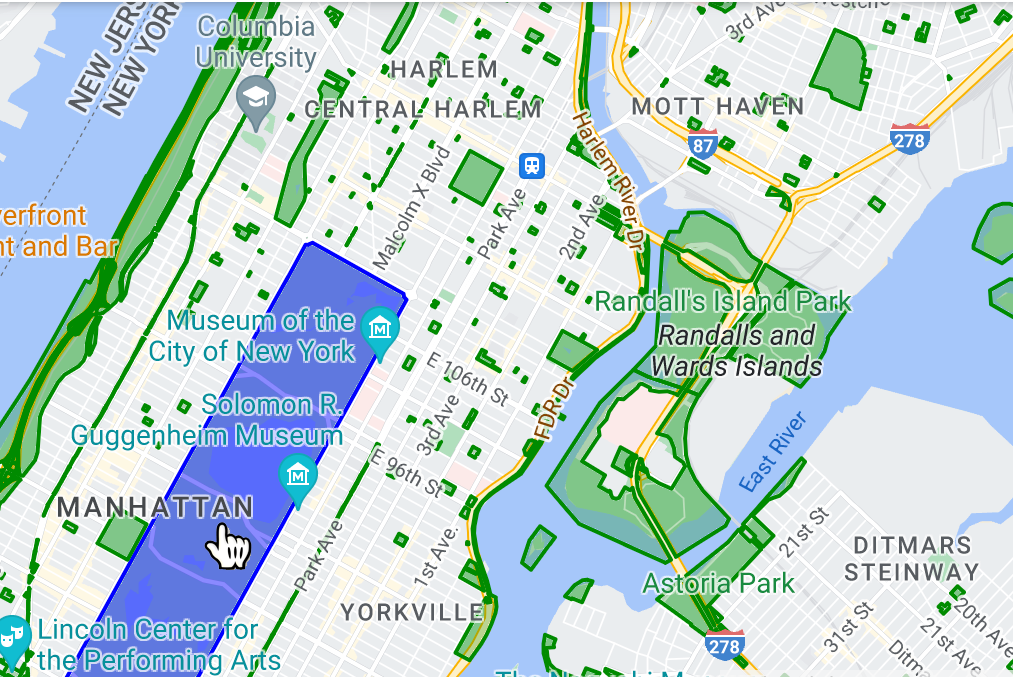
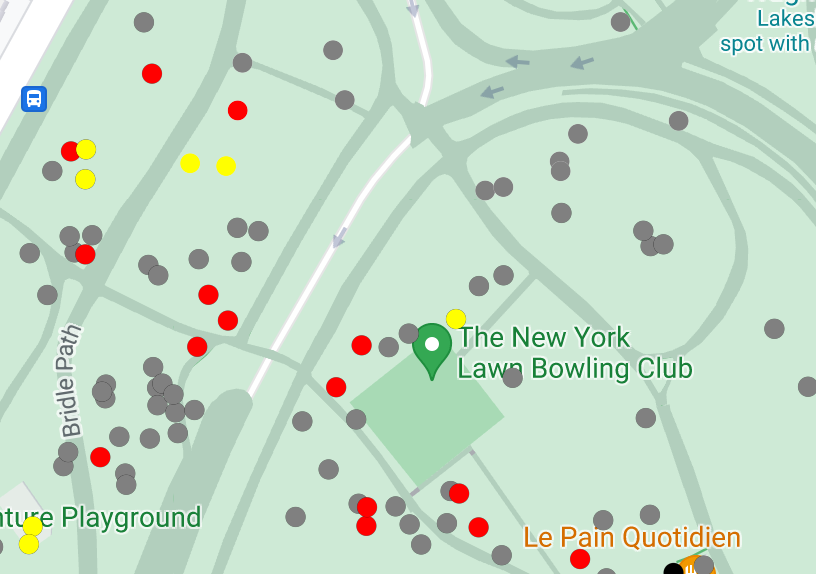
Stylizuj dane punktowe, aby wyświetlać na mapie określone lokalizacje.
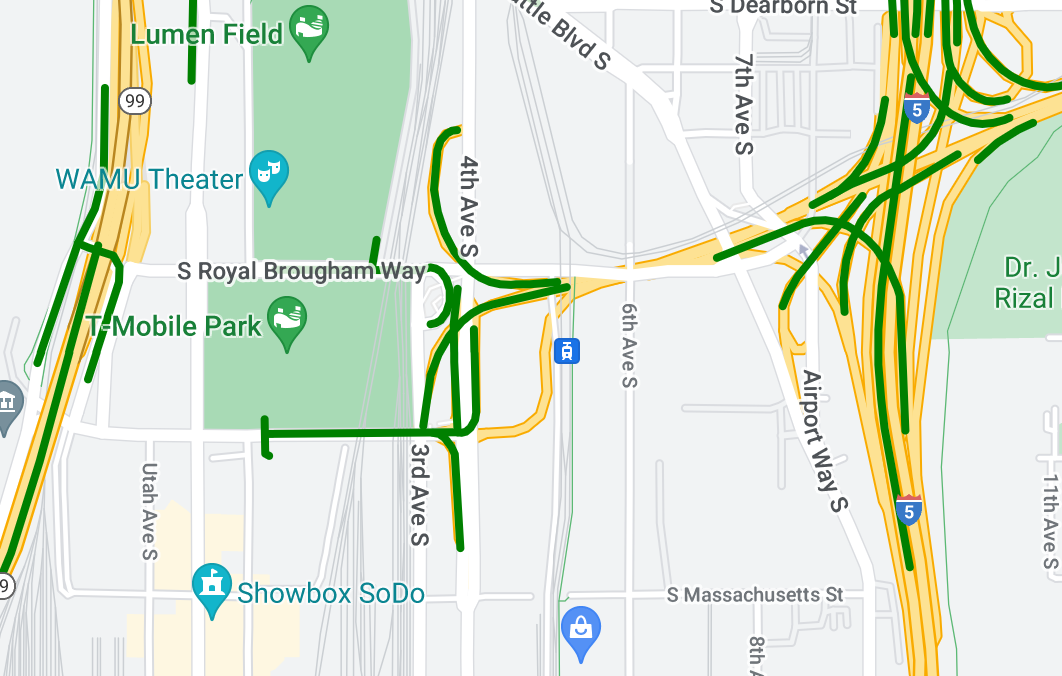
Zmień styl danych polilinii, aby wyróżnić elementy geograficzne.
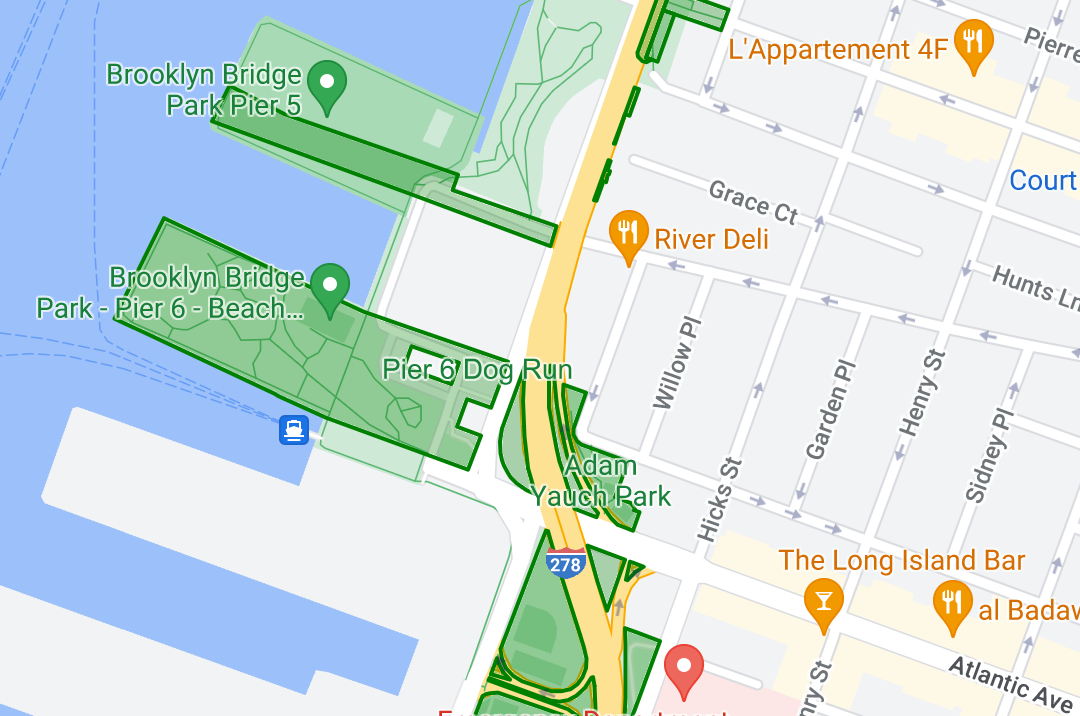
Stylizuj dane wielokątów, aby wyróżnić obszary geograficzne.
Spraw, aby funkcje danych reagowały na zdarzenia kliknięcia, dodając odbiornik zdarzeń.
[[["Łatwo zrozumieć","easyToUnderstand","thumb-up"],["Rozwiązało to mój problem","solvedMyProblem","thumb-up"],["Inne","otherUp","thumb-up"]],[["Brak potrzebnych mi informacji","missingTheInformationINeed","thumb-down"],["Zbyt skomplikowane / zbyt wiele czynności do wykonania","tooComplicatedTooManySteps","thumb-down"],["Nieaktualne treści","outOfDate","thumb-down"],["Problem z tłumaczeniem","translationIssue","thumb-down"],["Problem z przykładami/kodem","samplesCodeIssue","thumb-down"],["Inne","otherDown","thumb-down"]],["Ostatnia aktualizacja: 2025-09-05 UTC."],[[["\u003cp\u003eData-driven styling allows you to upload custom geospatial datasets (GeoJSON, CSV, KML) and visualize them on vector maps using points, polylines, and polygons.\u003c/p\u003e\n"],["\u003cp\u003eDatasets are managed through Google Cloud Console or Google Cloud Shell and are associated with map styles and IDs for display.\u003c/p\u003e\n"],["\u003cp\u003eYou can customize the visual appearance of data features based on their properties and enable click event interactions.\u003c/p\u003e\n"],["\u003cp\u003eData-driven styling enables the creation of dynamic and interactive data visualizations for highlighting locations, geographical features, and areas on maps.\u003c/p\u003e\n"]]],[],null,["Select platform: [Android](/maps/documentation/android-sdk/dds-datasets/overview \"View this page for the Android platform docs.\") [iOS](/maps/documentation/ios-sdk/dds-datasets/overview \"View this page for the iOS platform docs.\") [JavaScript](/maps/documentation/javascript/dds-datasets/overview \"View this page for the JavaScript platform docs.\")\n\n\u003cbr /\u003e\n\nData-driven styling for datasets lets you upload your own geospatial datasets,\napply custom styling to their data features, and display those data features on\nmaps. With data-driven styling for datasets, you can create data visualizations\nbased on point, polyline, and polygon geometries, and make data features respond\nto click events. Data-driven styling for datasets is supported on vector maps\nonly (a map ID is required).\n\n[Get started with data-driven styling for datasets](/maps/documentation/javascript/dds-datasets/start)\n\nAdd custom geospatial datasets\n\nAdd your custom data using Google Cloud Console or Google Cloud\nShell. Each dataset has a unique ID, which you can associate with a map style.\nThe following data formats are supported:\n\n- GeoJSON\n- Comma-separated (CSV)\n- KML\n\nFor details about dataset requirements and limitations, see\n[Create and manage a dataset](/maps/documentation/javascript/dds-datasets/create-dataset#dataset-prerequisites)\n\nStyle data features\n\nOnce your custom data has been uploaded and associated to a map\nstyle and map ID, you can style data features for visual impact, and make\nfeatures respond to click events.\n\nStyle point data to show specific locations on the map.\n\nStyle polyline data to highlight geographical features.\n\nStyle polygon data to highlight geographical areas.\n\nMake data features respond to click events by adding an event\nlistener."]]