Veri kümeleri için veriye dayalı stil oluşturma özelliği, kendi coğrafi veri kümelerinizi yüklemenize, veri özelliklerine özel stil oluşturma uygulamanıza ve bu veri özelliklerini haritalarda görüntülemenize olanak tanır. Veri kümeleri için veriye dayalı stil oluşturma özelliği sayesinde nokta, çoklu çizgi ve poligon geometrilerine dayalı veri görselleştirmeleri oluşturabilir ve veri özelliklerinin dokunma etkinliklerine yanıt vermesini sağlayabilirsiniz. Veri kümeleri için veriye dayalı stil oluşturma yalnızca vektör haritalarda desteklenir (harita kimliği gerekir).
Google Cloud Console veya Google Cloud Shell'i kullanarak özel verilerinizi ekleyin. Her veri kümesinin benzersiz bir kimliği vardır. Bu kimliği bir harita stiliyle ilişkilendirebilirsiniz.
Aşağıdaki veri biçimleri desteklenir:
GeoJSON
Virgülle ayrılmış (CSV)
KML
Veri kümesiyle ilgili şartlar ve sınırlamalar hakkında ayrıntılı bilgi için Veri kümesi oluşturma ve yönetme başlıklı makaleyi inceleyin.
Herkese açık veri kümeleri hakkında
Bir veri kümesine stil uygulamak için harita stilini bir harita kimliğiyle ilişkilendirmeniz gerekir. Bu işlem, veri kümesini de harita kimliğiyle ilişkilendirir. Geliştiriciler, bir uygulamada bu harita kimliğine ve bununla ilişkili tüm harita stiline ve coğrafi uzamsal verilere referans verebilir. Coğrafi veriler için ek erişim denetimi uygulanmaz. Bu nedenle, coğrafi veriler uygulamayı kullanan herkes tarafından etkili bir şekilde herkese açık olarak kullanılabilir.
Stil verisi özellikleri
Özel verileriniz yüklendikten ve bir harita stili ve harita kimliğiyle ilişkilendirildikten sonra, görsel etki için veri özelliklerini stilize edebilir ve özelliklerin dokunma etkinliklerine yanıt vermesini sağlayabilirsiniz.
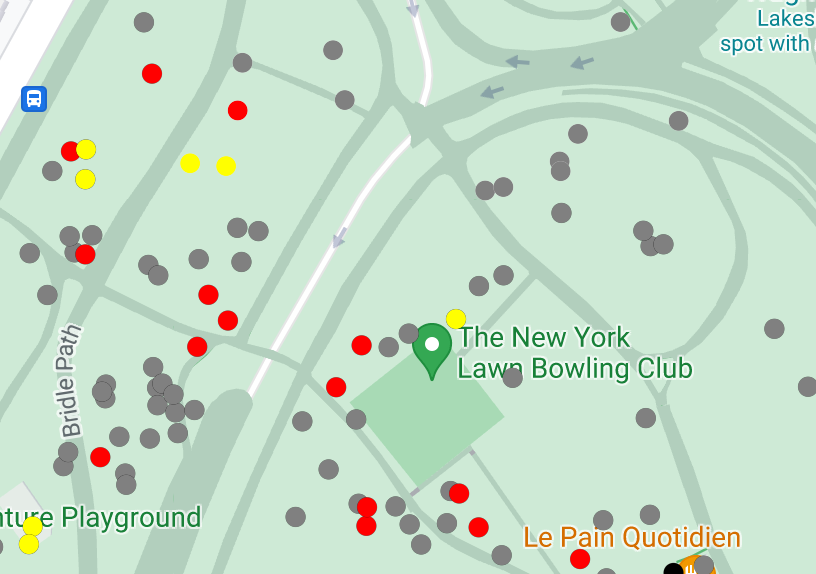
Haritada belirli konumları göstermek için nokta verilerini stilize edin.
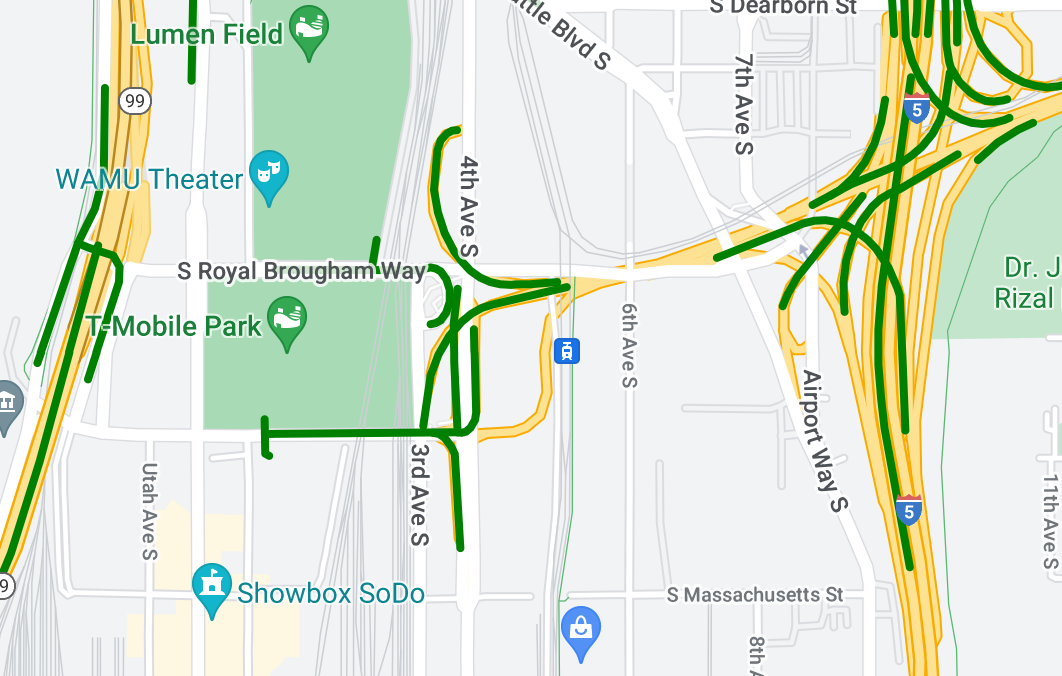
Coğrafi özellikleri vurgulamak için çoklu çizgi verilerini stilize edin.
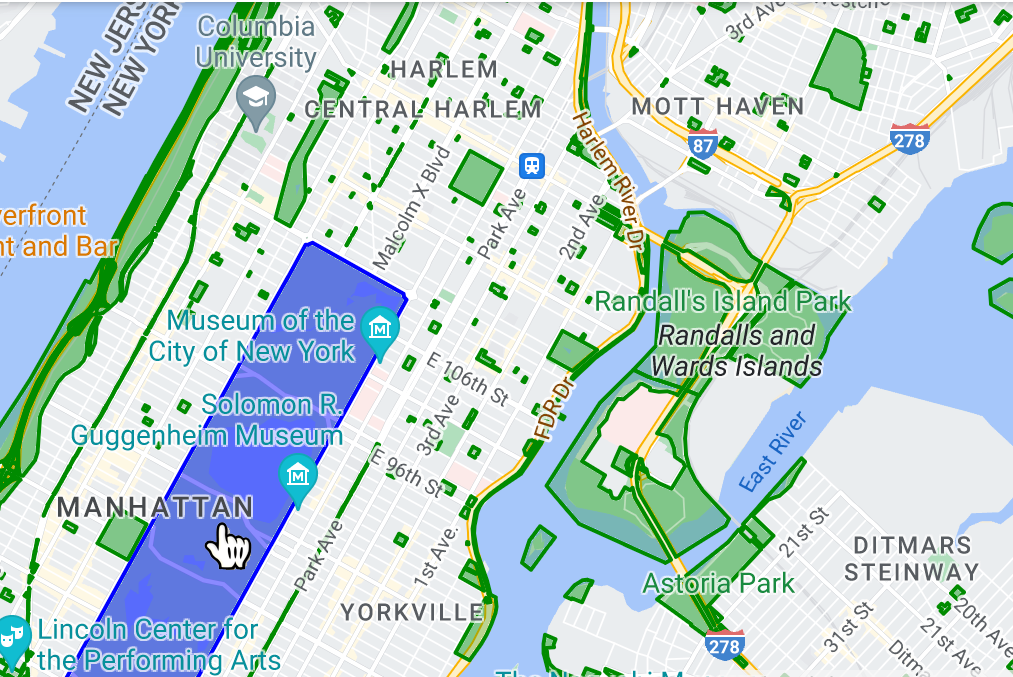
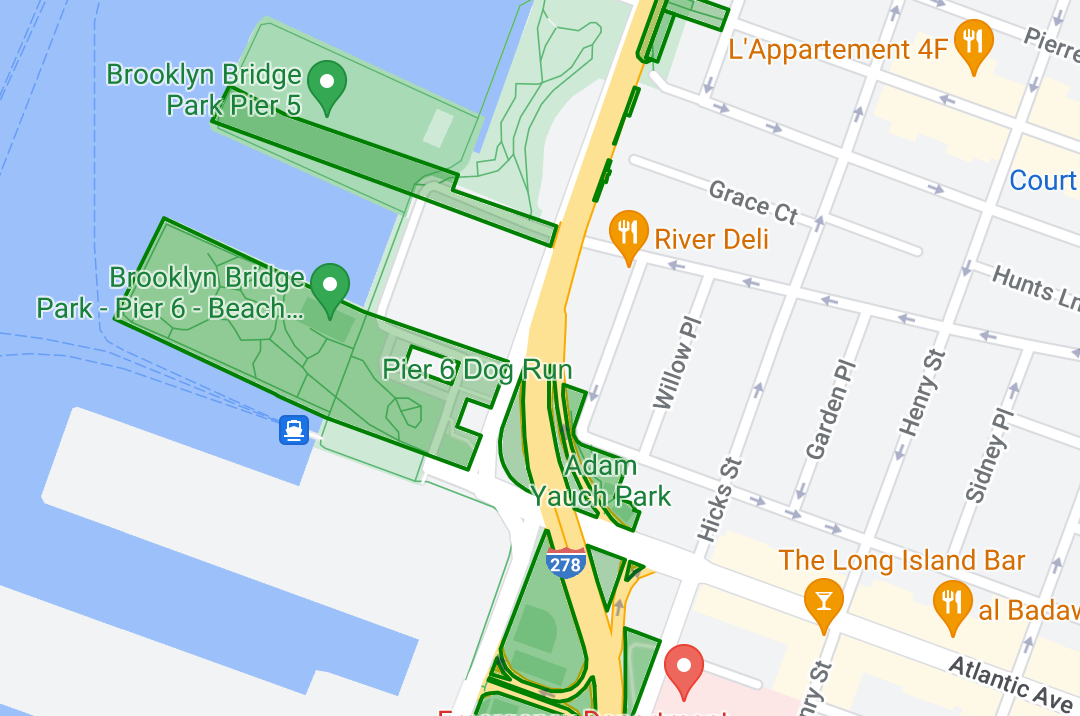
Coğrafi alanları vurgulamak için poligon verilerini stilize edin.
Bir etkinlik dinleyici ekleyerek veri özelliklerinin dokunma etkinliklerine yanıt vermesini sağlayın.
[[["Anlaması kolay","easyToUnderstand","thumb-up"],["Sorunumu çözdü","solvedMyProblem","thumb-up"],["Diğer","otherUp","thumb-up"]],[["İhtiyacım olan bilgiler yok","missingTheInformationINeed","thumb-down"],["Çok karmaşık / çok fazla adım var","tooComplicatedTooManySteps","thumb-down"],["Güncel değil","outOfDate","thumb-down"],["Çeviri sorunu","translationIssue","thumb-down"],["Örnek veya kod sorunu","samplesCodeIssue","thumb-down"],["Diğer","otherDown","thumb-down"]],["Son güncelleme tarihi: 2025-08-31 UTC."],[[["\u003cp\u003eData-driven styling allows you to upload custom geospatial datasets (GeoJSON, CSV, KML) and visualize them on vector maps with custom styles based on their geometries.\u003c/p\u003e\n"],["\u003cp\u003eYou can apply unique styling to point, polyline, and polygon data, enabling visualization of locations, geographical features, and areas, respectively.\u003c/p\u003e\n"],["\u003cp\u003eDatasets associated with map IDs are effectively public, accessible to anyone with the app referencing that ID.\u003c/p\u003e\n"],["\u003cp\u003eData features can be made interactive by adding event listeners, allowing them to respond to user interactions like taps.\u003c/p\u003e\n"],["\u003cp\u003eTo get started, you'll need to upload your data using Google Cloud Console or Google Cloud Shell and then associate it with a map style and ID.\u003c/p\u003e\n"]]],[],null,["Select platform: [Android](/maps/documentation/android-sdk/dds-datasets/overview \"View this page for the Android platform docs.\") [iOS](/maps/documentation/ios-sdk/dds-datasets/overview \"View this page for the iOS platform docs.\") [JavaScript](/maps/documentation/javascript/dds-datasets/overview \"View this page for the JavaScript platform docs.\")\n\n\u003cbr /\u003e\n\nData-driven styling for datasets lets you upload your own geospatial datasets,\napply custom styling to their data features, and display those data features on\nmaps. With data-driven styling for datasets, you can create data visualizations\nbased on point, polyline, and polygon geometries, and make data features respond\nto tap events. Data-driven styling for datasets is supported on vector maps\nonly (a map ID is required).\n\n[Get started with data-driven styling for datasets](/maps/documentation/ios-sdk/dds-datasets/start)\n\nAdd custom geospatial datasets\n\nAdd your custom data using Google Cloud Console or Google Cloud\nShell. Each dataset has a unique ID, which you can associate with a map style.\nThe following data formats are supported:\n\n- GeoJSON\n- Comma-separated (CSV)\n- KML\n\nFor details about dataset requirements and limitations, see\n[Create and manage a dataset](/maps/documentation/ios-sdk/dds-datasets/create-dataset#dataset-prerequisites)\n\nAbout public datasets\n\nIn order to style a dataset you must associate a map style with a map ID, which\nalso associates the dataset to the map ID. In an app, developers can reference\nthat map ID, and any map style and geospatial data associated with it. No\nadditional access control is applied to the geospatial data, making the\ngeospatial data effectively publicly available to anyone with the app.\n\nStyle data features\n\nOnce your custom data has been uploaded and associated to a map\nstyle and map ID, you can style data features for visual impact, and make\nfeatures respond to tap events.\n\nStyle point data to show specific locations on the map.\n\nStyle polyline data to highlight geographical features.\n\nStyle polygon data to highlight geographical areas.\n\nMake data features respond to tap events by adding an event\nlistener."]]