Looking for advanced features to add to your maps? The
Maps SDK for iOS
Utility Library on GitHub is an open-source library of classes that are
useful for a range of applications. The GitHub repository includes the utility
classes and a demo app that illustrates the use of each class.
The utilities
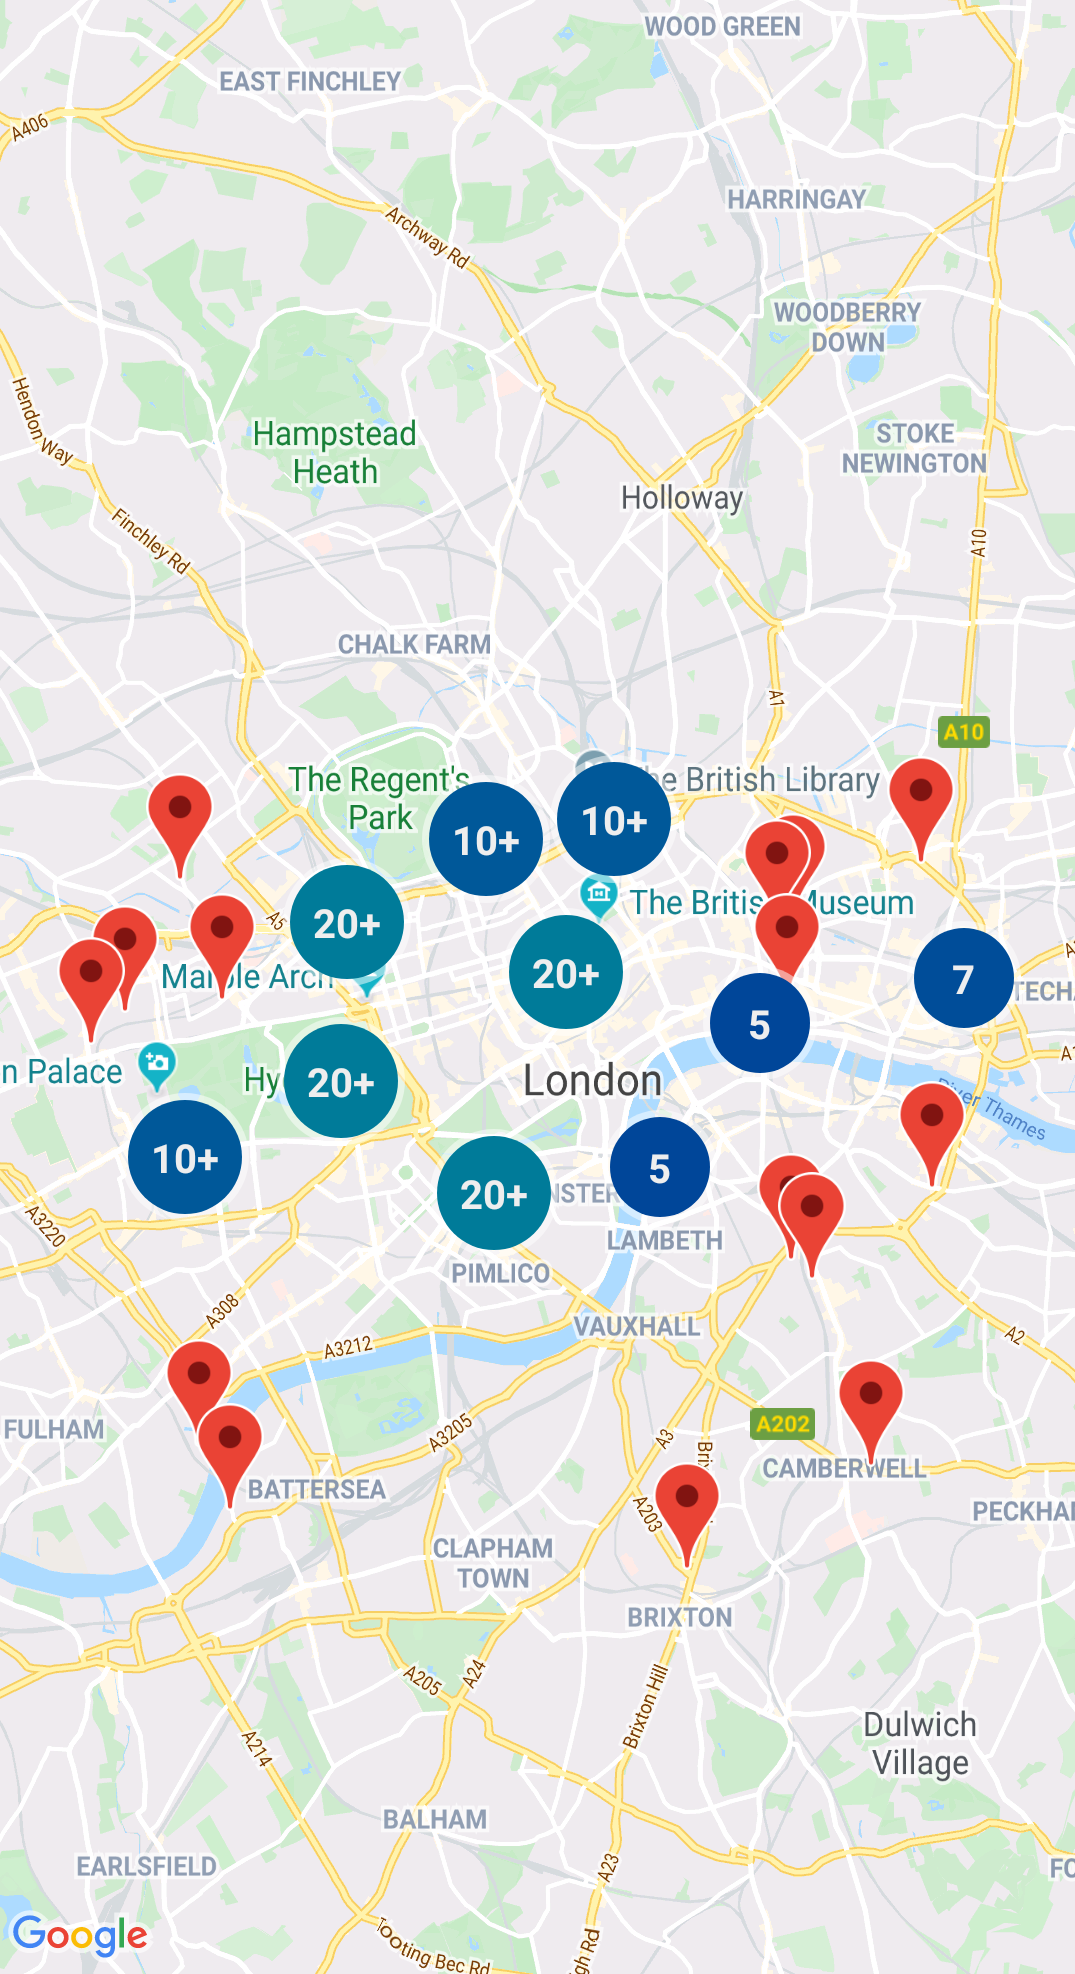
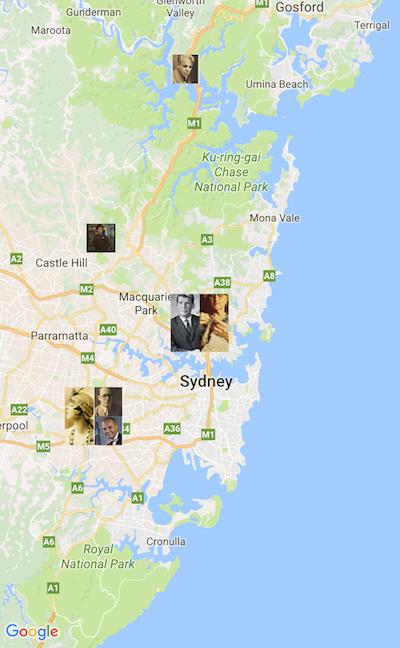
Marker Clustering
The GMUClusterManager helps you manage multiple markers at
different zoom levels. This means you can put a large number of markers
on a map without making the map hard to read. When a user views the map
at a high zoom level, the individual markers show on the map. When the
user zooms out to a lower zoom level, the markers gather together into
clusters, to make viewing the map easier.
A quadtree is a data structure that's useful for finding points near a single
point, by searching inside an area surrounding the point of interest.
For details, see the documentation on the
Quadtree.
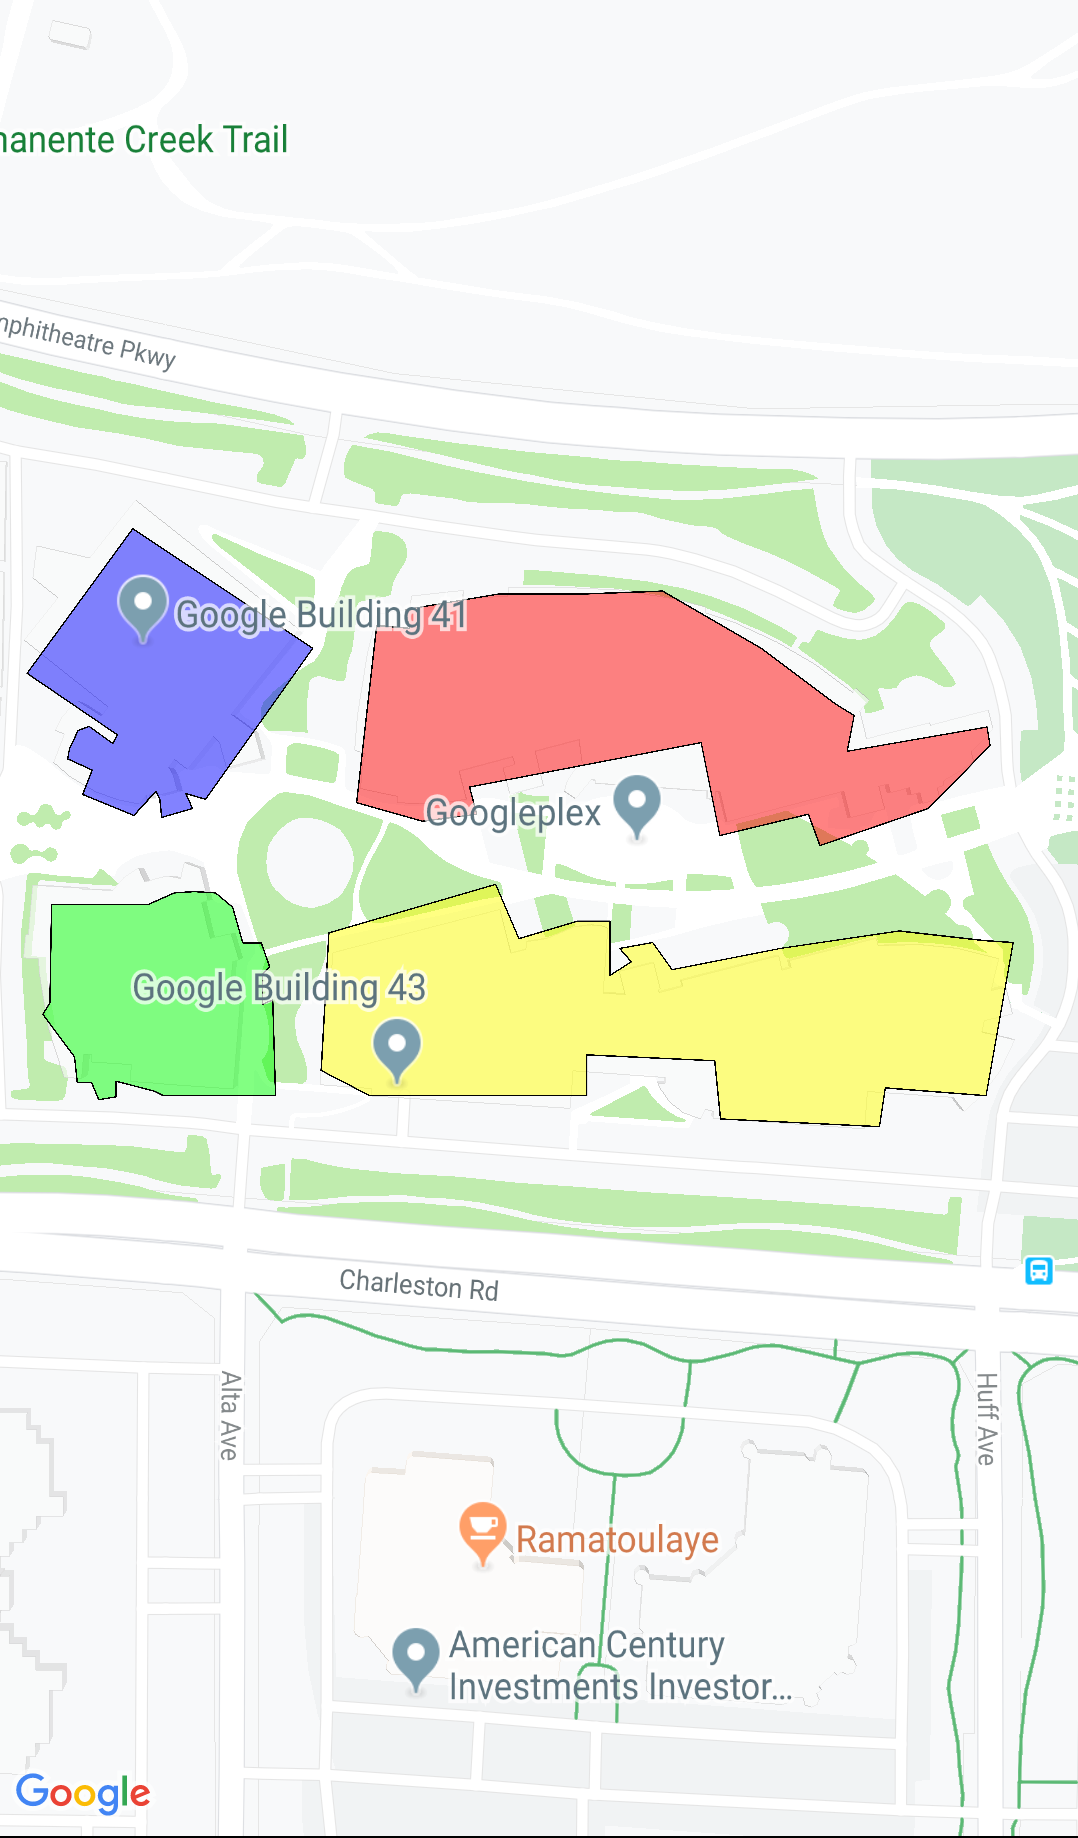
KML
KML is a popular format for rendering geographic data such as
points, lines, and polygons. The GMUKMLParser
lets you parse and render geographic data in the KML format.
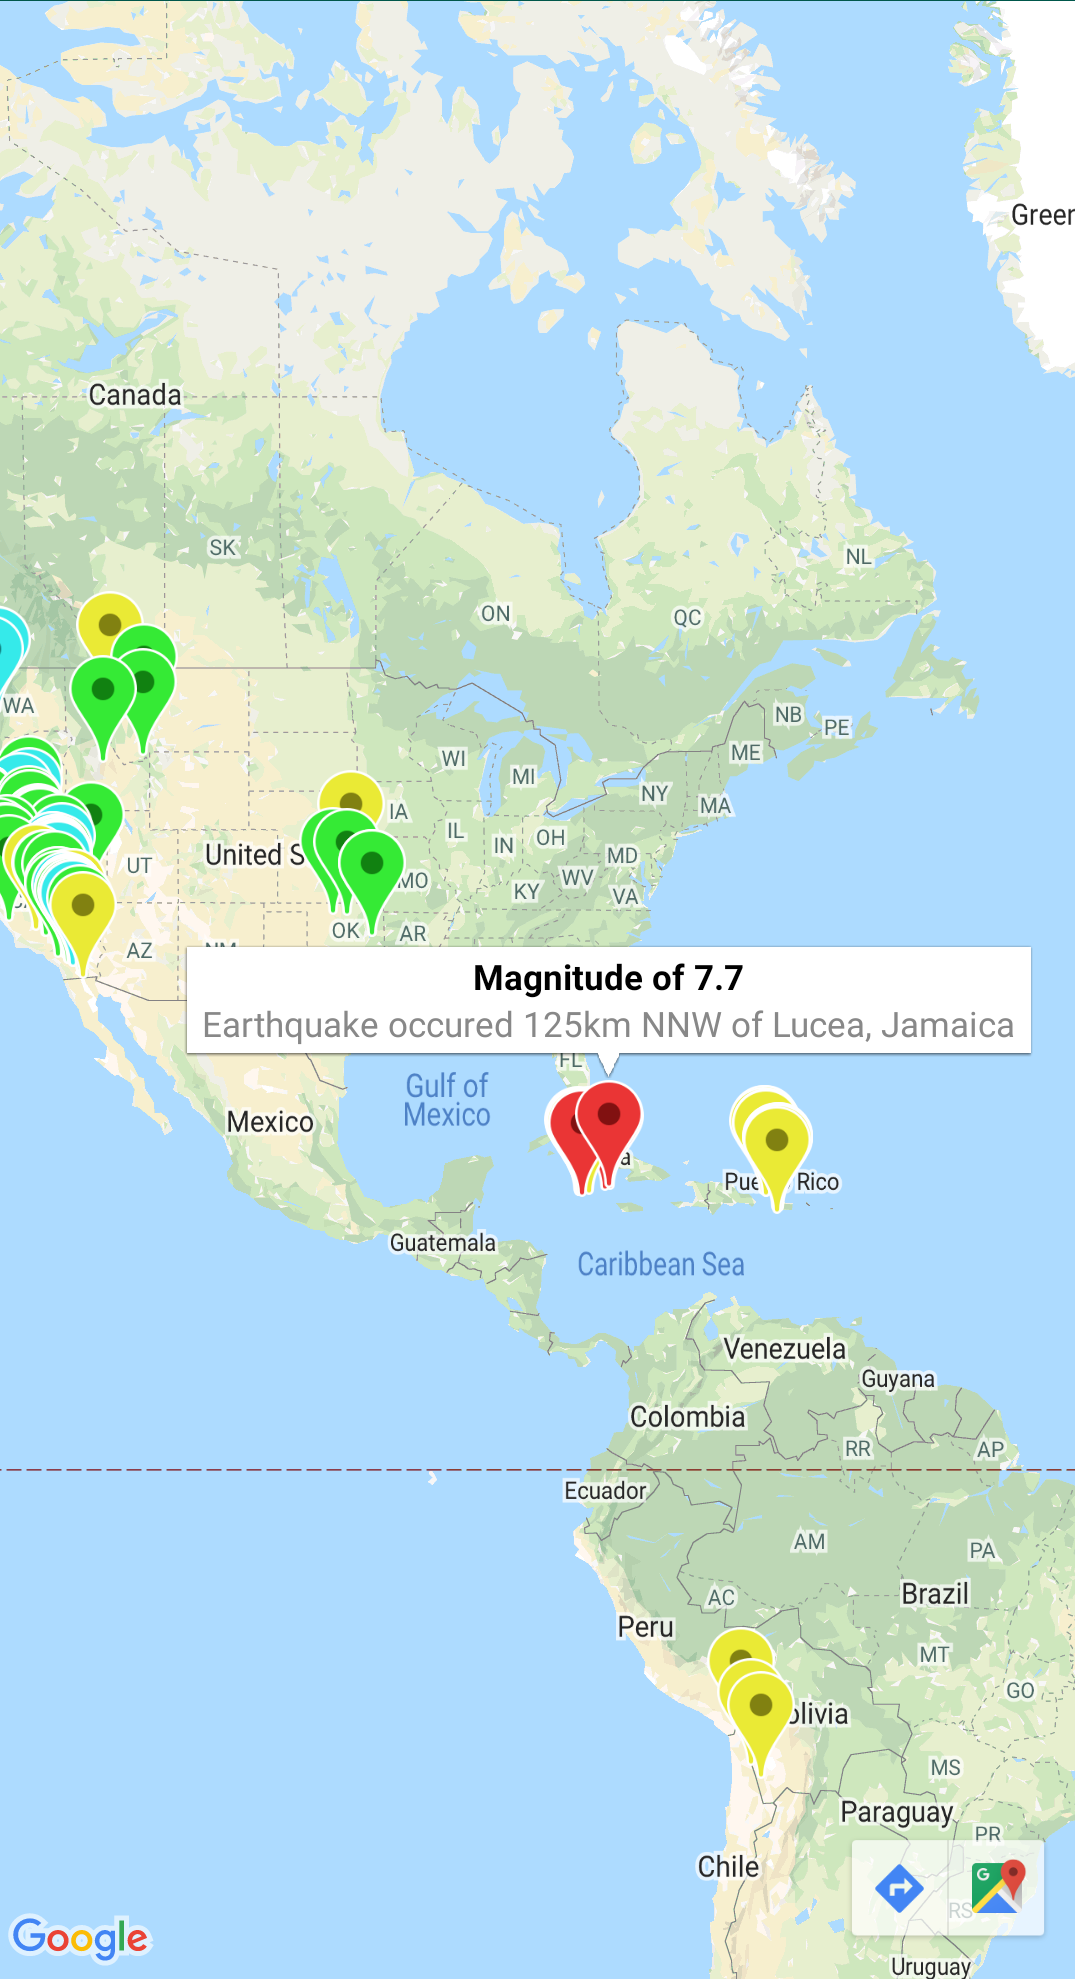
You can store features in GeoJSON
format and use this utility to render them as a layer on top of a map.
Render geographic data in the GeoJSON format using GMUGeoJSONParser in
conjunction with GMUGeometryRenderer.
For details, see the documentation on the
GeoJSON.
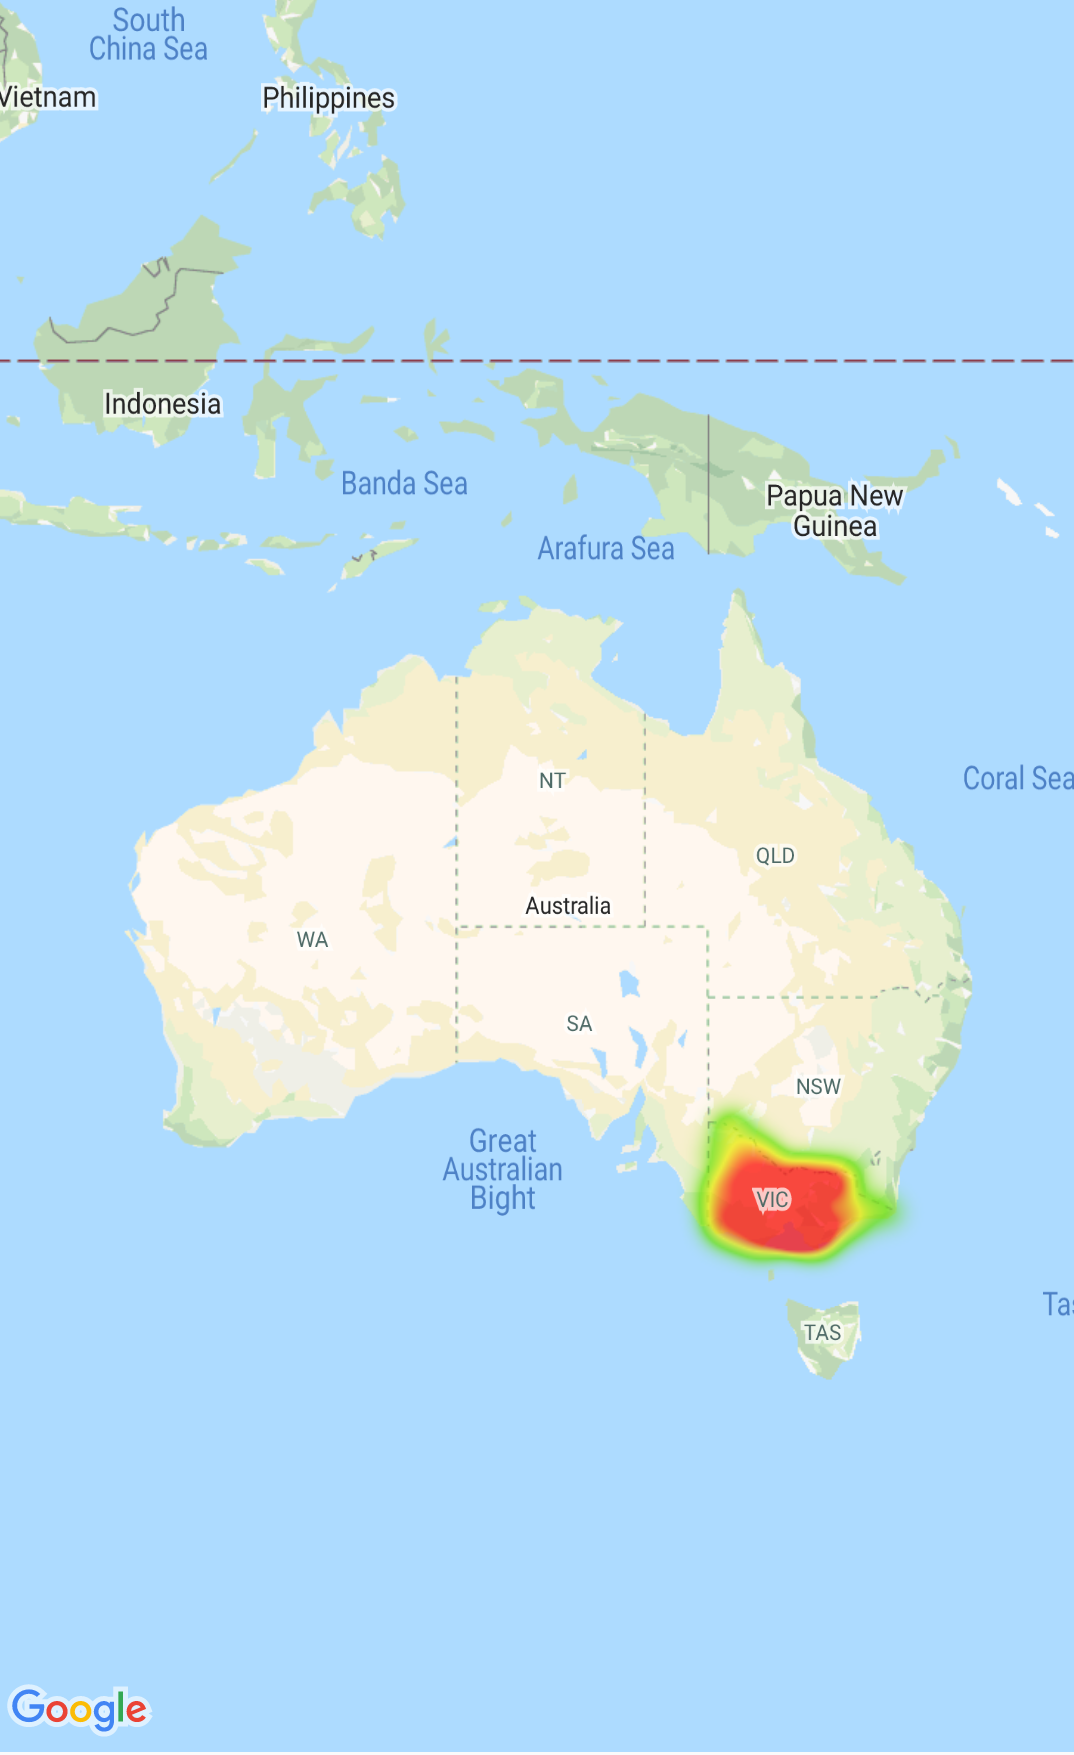
Heatmaps
Heatmaps make it easy for viewers to understand the distribution and
relative intensity of data points on a map. Rather than placing a marker at
each location, heatmaps use color and shape to represent the distribution of
data.
For details, see the documentation on the
Heatmaps.
Custom markers
Use the delegate GMUClusterRendererDelegate
on GMUDefaultClusterRenderer to customize the properties of a marker before and
after it is added to the map.
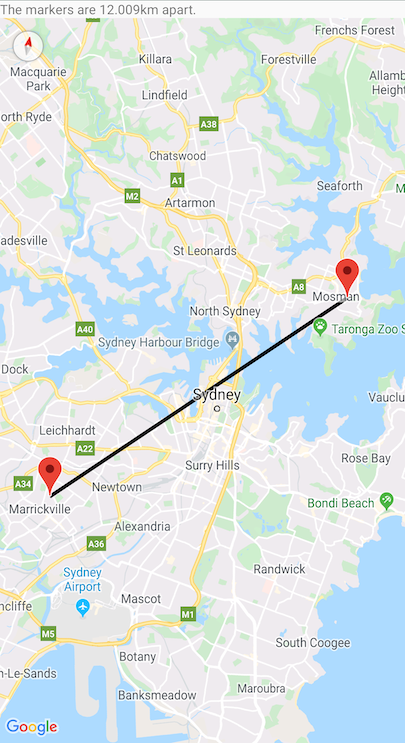
Geometry utilities
A set of Swift spherical geometry utility functions of the
GMSGeometryUtils
module of the Maps SDK for iOS. Use these extensions to perform many types of geometric
operations, including:
Determine the great circle distance between coordinates
Determine if a coordinate is inside a polygon
Determine if a coordinate lies on or near a path within a specified tolerance
[[["Easy to understand","easyToUnderstand","thumb-up"],["Solved my problem","solvedMyProblem","thumb-up"],["Other","otherUp","thumb-up"]],[["Missing the information I need","missingTheInformationINeed","thumb-down"],["Too complicated / too many steps","tooComplicatedTooManySteps","thumb-down"],["Out of date","outOfDate","thumb-down"],["Samples / code issue","samplesCodeIssue","thumb-down"],["Other","otherDown","thumb-down"]],["Last updated 2026-07-20 UTC."],[],["The Maps SDK for iOS Utility Library offers tools for enhancing maps, including marker clustering via `GMUClusterManager` for managing numerous markers at different zoom levels. It also supports quadtrees for proximity searches, KML and GeoJSON format parsing for rendering geographic data, and heatmaps for visualizing data density. The library allows custom marker properties through `GMUClusterRendererDelegate` and provides geometry utilities (`GMSGeometryUtils`) for tasks like distance calculation and polygon analysis.\n"]]