
Page Summary
-
This guide explains how to programmatically style data features in a dataset visualized on a map using the Maps SDK for Android, iOS, or JavaScript.
-
It covers styling examples for point, polygon, and polyline geometries, based on attributes within their respective datasets.
-
Datasets render features using latitude and longitude coordinates from a geospatial data file, supporting CSV (with WKT format for geometries) and GeoJSON.
-
Code examples demonstrate styling points based on categorical attributes (e.g., squirrel fur color), polygons based on specific feature types (e.g., park type), and applying a uniform style to polylines.
This page shows how to programmatically access a dataset and style its features, and walks through styling examples for data features based on point, polygon, and polyline geometries.
Data-driven styling for datasets renders data features based on the provided latitude and longitude coordinates from the geospatial data file used to create the dataset.
Point data styling example
This example shows an approach to styling point geometry based data features.
About the dataset
The dataset used in this example is the result of a
2018 survey of squirrels
in Central Park, New York City.
In the following excerpt from the CSV data file, we see that columns x and y
are used for geography; a LatLng column is included, but it's not used in this
example because datasets only support the
WKT format
if the column is named WKT. For more information about the supported formats
for location, see
CSV requirements.
The squirrel census dataset contains a nice variety of different data points relating to the observed fur color and behavior of squirrels (be sure to scroll horizontally to see it all).
| X | Y | UniqueSquirrelID | Hectare | Shift | Date | Hectare SquirrelNumber | Age | PrimaryFurColor | HighlightFurColor | CombinationofPrimaryandHighlightColor | Colornotes | Location | AboveGroundSighter Measurement | SpecificLocation | Running | Chasing | Climbing | Eating | Foraging | Other Activities | Kuks | Quaas | Moans | Tailflags | Tailtwitches | Approaches | Indifferent | Runsfrom | OtherInteractions | LatLng |
|---|---|---|---|---|---|---|---|---|---|---|---|---|---|---|---|---|---|---|---|---|---|---|---|---|---|---|---|---|---|---|
| -73.9561344937861 | 40.7940823884086 | 37F-PM-1014-03 | 37F | PM | 10142018 | 3 | + | false | false | false | false | false | false | false | false | false | false | false | false | false | POINT (-73.9561344937861 40.7940823884086) | |||||||||
| -73.9688574691102 | 40.7837825208444 | 21B-AM-1019-04 | 21B | AM | 10192018 | 4 | + | false | false | false | false | false | false | false | false | false | false | false | false | false | POINT (-73.9688574691102 40.7837825208444) | |||||||||
| -73.9742811484852 | 40.775533619083 | 11B-PM-1014-08 | 11B | PM | 10142018 | 8 | Gray | Gray+ | Above Ground | 10 | false | true | false | false | false | false | false | false | false | false | false | false | false | POINT (-73.97428114848522 40.775533619083) | ||||||
| -73.9596413903948 | 40.7903128889029 | 32E-PM-1017-14 | 32E | PM | 10172018 | 14 | Adult | Gray | Gray+ | Nothing selected as Primary. Gray selected as Highlights. Made executive adjustments. | false | false | false | true | true | false | false | false | false | false | false | false | true | POINT (-73.9596413903948 40.7903128889029) | ||||||
| -73.9702676472613 | 40.7762126854894 | 13E-AM-1017-05 | 13E | AM | 10172018 | 5 | Adult | Gray | Cinnamon | Gray+Cinnamon | Above Ground | on tree stump | false | false | false | false | true | false | false | false | false | false | false | false | false | POINT (-73.9702676472613 40.7762126854894) | ||||
| -73.9683613516225 | 40.7725908847499 | 11H-AM-1010-03 | 11H | AM | 10102018 | 3 | Adult | Cinnamon | White | Cinnamon+White | false | false | false | false | true | false | false | false | false | true | false | true | false | POINT (-73.9683613516225 40.7725908847499) | ||||||
| -73.9541201789795 | 40.7931811701082 | 36H-AM-1010-02 | 36H | AM | 10102018 | 2 | Adult | Gray | Gray+ | just outside hectare | Ground Plane | FALSE | false | false | false | false | true | false | false | false | false | false | false | false | false | POINT (-73.9541201789795 40.7931811701082) |
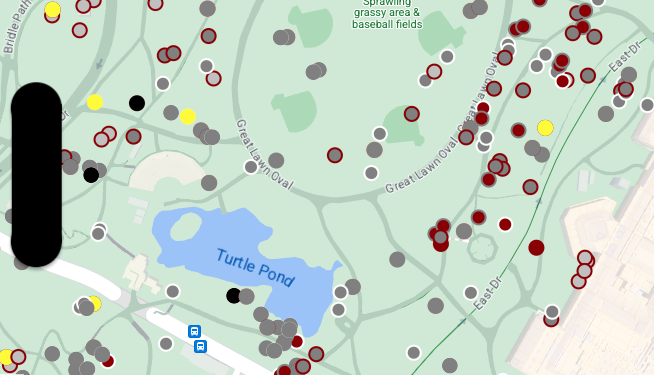
Style point data features
The code in this example takes the approach of styling the fill color and
stroke color for each point based on the CombinationofPrimaryandHighlightColor
attribute, which combines the primary and secondary fur colors for each
squirrel.
Swift
let mapView = GMSMapView(frame: .zero, mapID: GMSMapID(identifier: "YOUR_MAP_ID"), camera: GMSCameraPosition(latitude: 40.7, longitude: -74.0, zoom: 12))

let layer = mapView.datasetFeatureLayer(of: "YOUR_DATASET_ID")

// Define a point style with fill and radius.
// Apply the style to the datasets features.
layer.style = { feature in
    switch(feature.datasetAttributes["CombinationofPrimaryandHighlightColor"]){
      case "Black+"  :
        let style = MutableFeatureStyle()
        style.fillColor = .black;
        style.pointRadius = 8;
        return style
      case "Cinnamon+"  :
        let style = MutableFeatureStyle()
        style.fillColor = UIColor(red: 139/255, green: 0, blue: 0, alpha: 1);
        style.pointRadius = 8;
        return style
      ...
      default :
        let style = MutableFeatureStyle()
        style.fillColor = .yellow;
        style.pointRadius = 8;
        return style
    }
}
Objective-C
GMSMapView *mapView = [GMSMapView mapWithFrame:CGRectZero mapID:[GMSMapID mapIDWithIdentifier:@"MAP_ID"] camera:[GMSCameraPosition cameraWithLatitude: 40.7 longitude: -74.0 zoom:12]];

GMSDatasetFeatureLayer *layer = [mapView datasetFeatureLayerOfDatasetID:@"YOUR_DATASET_ID"];

// Define a point style with fill and radius.
// Apply the style to the datasets features.
layer.style = ^(GMSDatasetFeature *feature) {
  NSString *attrib = feature.datasetAttributes[@"CombinationofPrimaryandHighlightColor"];
  if ([attrib isEqualToString:@"Black+"])  {
    GMSMutableFeatureStyle *style = [GMSMutableFeatureStyle style];
    style.fillColor = [UIColor blackColor];
    style.pointRadius = 8;
    return style;
  } else if([attrib isEqualToString:@"Cinnamon+"]) {
    GMSMutableFeatureStyle *style = [GMSMutableFeatureStyle style];
    style.fillColor = [UIColor colorWithRed:139.0f/255.0f
                                      green:0.0f
                                        blue:0.0f
                                      alpha:1.0f];
    style.pointRadius = 8;
    return style;
  }
  ...
  else {
    GMSMutableFeatureStyle *style = [GMSMutableFeatureStyle style];
    style.fillColor = [UIColor yellowColor];
    style.pointRadius = 8;
    return style;
  }
};
Polygon data styling example
This example shows an approach to styling polygon geometry based data features.
About the dataset
The dataset used in this example depicts parks in New York City. The following excerpt from the dataset GeoJSON file shows a representative feature entry.
{
  "type": "Feature",
  "properties": {
    "jurisdiction": "DPR",
    "mapped": "False",
    "zipcode": "11356",
    "acres": "0.05",
    "location": "College Pl., College Pt. Blvd., bet. 11 Ave. and 12 Ave.",
    "nys_assembly": "27",
    "councildistrict": "19",
    "url": "http://www.nycgovparks.org/parks/Q042/",
    "typecategory": "Triangle/Plaza",
    "us_congress": "14",
    "eapply": "Poppenhusen Park",
    "parentid": "Q-07",
    "gispropnum": "Q042",
    "retired": "false",
    "communityboard": "407",
    "objectid": "6248",
    "globalid": "F4810079-CBB9-4BE7-BBFA-B3C0C35D5DE5",
    "name311": "Poppenhusen Park",
    "department": "Q-07",
    "pip_ratable": "true",
    "subcategory": "Sitting Area/Triangle/Mall",
    "precinct": "109",
    "permit": "true",
    "acquisitiondate": null,
    "omppropid": "Q042",
    "gisobjid": "100000301",
    "signname": "Poppenhusen Park",
    "address": null,
    "permitparent": "Q-07",
    "class": "PARK",
    "nys_senate": "11",
    "permitdistrict": "Q-07",
    "borough": "Q",
    "waterfront": "false"
  },
  "geometry": {
    "type": "MultiPolygon",
    "coordinates": [
      [
        [
          [
            -73.84575702371716,
            40.78796240884273
          ],
          [
            -73.84593393292693,
            40.78796857347548
          ],
          [
            -73.84577256469657,
            40.787651355629556
          ],
          [
            -73.84575702371716,
            40.78796240884273
          ]
        ]
      ]
    ]
  }
},
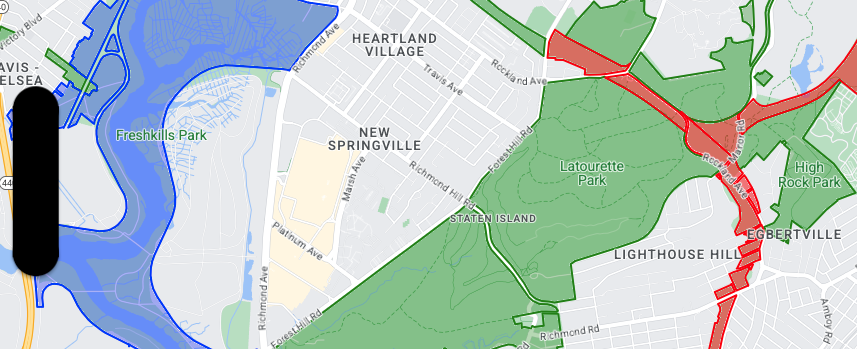
Style polygon data features
The code in this example applies special coloring to data features associated
with a typecategory of "Undeveloped" or "Parkway", and colors all other
features green.
Swift
let mapView = GMSMapView(frame: .zero, mapID: GMSMapID(identifier: "YOUR_MAP_ID"), camera: GMSCameraPosition(latitude: 40.7, longitude: -74.0, zoom: 12))

let layer = mapView.datasetFeatureLayer(of: "YOUR_DATASET_ID")

// Define a polygon style with fill and stroke.
// Apply the style to the datasets features.
layer.style = { feature in
  switch(feature.datasetAttributes["typecategory"]){
    case "Undeveloped"  :
      let style = MutableFeatureStyle()
      style.fillColor = .blue.withAlphaComponent(0.3);
      style.strokeColor = .blue;
      style.strokeWidth = 2.0;
      return style
    case "Parkway"  :
      let style = MutableFeatureStyle()
      style.fillColor = .red.withAlphaComponent(0.3);
      style.strokeColor = .red;
      style.strokeWidth = 2.0;
      return style
    default :
      let style = MutableFeatureStyle()
      style.fillColor = .green.withAlphaComponent(0.3);
      style.strokeColor = .green;
      style.strokeWidth = 2.0;
      return style
  }
}
Objective-C
GMSMapView *mapView = [GMSMapView mapWithFrame:CGRectZero mapID:[GMSMapID mapIDWithIdentifier:@"MAP_ID"] camera:[GMSCameraPosition cameraWithLatitude: 40.7 longitude: -74.0 zoom:12]];

GMSDatasetFeatureLayer *layer = [mapView datasetFeatureLayerOfDatasetID:@"YOUR_DATASET_ID"];

// Define a polygon style with fill and stroke.
// Apply the style to the datasets features.
layer.style = ^(GMSDatasetFeature *feature) {
  NSString *attrib = feature.datasetAttributes[@"typecategory"];
  if ([attrib isEqualToString:@"Undeveloped"]) {
        GMSMutableFeatureStyle *style = [GMSMutableFeatureStyle style];
        style.fillColor = [[UIColor blueColor] colorWithAlphaComponent:0.3];
        style.strokeColor = [UIColor blueColor];
        style.strokeWidth = 2.0;
        return style;
  } else if([attrib isEqualToString:@"Parkway"]) {
        GMSMutableFeatureStyle *style = [GMSMutableFeatureStyle style];
        style.fillColor = [[UIColor redColor] colorWithAlphaComponent:0.3];
        style.strokeColor = [UIColor redColor];
        style.strokeWidth = 2.0;
        return style;
  } else {
        GMSMutableFeatureStyle *style = [GMSMutableFeatureStyle style];
        style.fillColor = [[UIColor greenColor] colorWithAlphaComponent:0.3];
        style.strokeColor = [UIColor greenColor];
        style.strokeWidth = 2.0;
        return style;
    }
  };
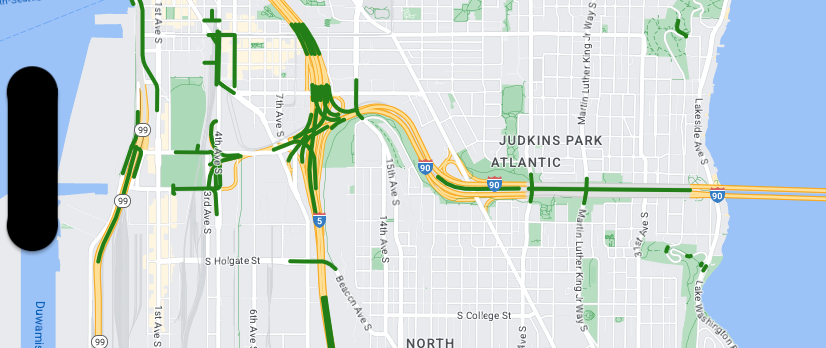
Polyline data styling example
This example shows an approach to styling polyline geometry based data features.
About the dataset
The dataset used in this example shows bridges in the Seattle area. The following excerpt from the dataset GeoJSON file shows a representative feature entry.
{
  "type": "Feature",
  "properties": {
      "OBJECTID": 1,
      "COMPTYPE": 66,
      "COMPKEY": 515774,
      "HANSEGKEY": 489781,
      "UNITID": "BRG-935",
      "UNITTYPE": " ",
      "BRGUNITID": "BRG-935",
      "UNITDESC_BRG": "YALE AVE BR REV LANE OC                                                                                                                                                                                                                                        ",
      "UNITDESC_SEG": "HOWELL ST ON RP BETWEEN HOWELL ST AND I5 SB                                                                                                                                                                                                                    ",
      "INSTDATE": null,
      "EXPDATE": null,
      "STATUS": " ",
      "STATUSDT": null,
      "CONDITION": " ",
      "CONDDT": null,
      "OWN": " ",
      "LSTVERIFY": null,
      "MAINTBY": " ",
      "ADDBY": "GARCIAA",
      "ADDDTTM": "2010-01-21T00:00:00Z",
      "MODBY": null,
      "MODDTTM": null,
      "BR_NBR": 935,
      "BR_CODE": " 935",
      "BR_TYPE": "ST",
      "BR_NAME": "YALE AVE BR REV LANE OC",
      "BR_FACILITIES": "YALE AVE-SR 5 ON RAMP",
      "BR_FEATURES": "SR 5 REV LANE",
      "BR_RATING": 0,
      "BR_INSET": 1,
      "BR_GEO": "DT",
      "BR_OWNER": "DOT",
      "BR_OWNER_NAME": "State of Washington",
      "GEOBASID": 0,
      "XGEOBASID": 0,
      "GISSEGKEY": 489781,
      "EARTHQUAKE_RESPONSE_TEAM": " ",
      "SHAPE_Length": 220.11891836147655
  },
  "geometry": {
      "type": "LineString",
      "coordinates": [
          [
              -122.329201929090928,
              47.616910448708538
          ],
          [
              -122.329206483407461,
              47.616976719821004
          ],
          [
              -122.32921802149356,
              47.617042137515213
          ],
          [
              -122.329236413912909,
              47.617105967923777
          ],
          [
              -122.329261454336034,
              47.617167494985758
          ],
          [
              -122.329292861855023,
              47.617226028479571
          ],
          [
              -122.329330284134699,
              47.617280911766009
          ],
          [
              -122.329373301365223,
              47.617331529154569
          ],
          [
              -122.329421430971635,
              47.617377312810319
          ],
          [
              -122.329474133027375,
              47.617417749124023
          ],
          [
              -122.32953081631139,
              47.617452384473893
          ]
      ]
  }
},
Style polyline data features
The following snippet applies the same style to directly to all data features.
Swift
// Define a style with green fill and stroke.
// Apply the style to the datasets features.
layer.style = { feature in
  let style = MutableFeatureStyle()
  style.fillColor = .green.withAlphaComponent(0.5);
  style.strokeColor = [UIColor greenColor];
  style.strokeWidth = 2.0;
  return style
}
Objective-C
// Define a style with green fill and stroke.
// Apply the style to the datasets features.
layer.style = ^(GMSDatasetFeature *feature) {
  GMSMutableFeatureStyle *style = [GMSMutableFeatureStyle style];
  style.fillColor = [[UIColor greenColor] colorWithAlphaComponent:0.5];
  style.strokeColor = [UIColor greenColor];
  style.strokeWidth = 2.0;
  return style;
};