Page Summary
-
Data-driven styling allows you to upload custom geospatial datasets (GeoJSON, CSV, KML) and visualize them on vector maps with custom styles based on their geometries.
-
You can apply unique styling to point, polyline, and polygon data, enabling visualization of locations, geographical features, and areas, respectively.
-
Datasets associated with map IDs are effectively public, accessible to anyone with the app referencing that ID.
-
Data features can be made interactive by adding event listeners, allowing them to respond to user interactions like taps.
-
To get started, you'll need to upload your data using Google Cloud Console or Google Cloud Shell and then associate it with a map style and ID.
Data-driven styling for datasets lets you upload your own geospatial datasets, apply custom styling to their data features, and display those data features on maps. With data-driven styling for datasets, you can create data visualizations based on point, polyline, and polygon geometries, and make data features respond to tap events. Data-driven styling for datasets is supported on vector maps only (a map ID is required).
Get started with data-driven styling for datasets
Add custom geospatial datasets
Add your custom data using Google Cloud Console or Google Cloud Shell. Each dataset has a unique ID, which you can associate with a map style. The following data formats are supported:
- GeoJSON
- Comma-separated (CSV)
- KML
For details about dataset requirements and limitations, see Create and manage a dataset
About public datasets
In order to style a dataset you must associate a map style with a map ID, which also associates the dataset to the map ID. In an app, developers can reference that map ID, and any map style and geospatial data associated with it. No additional access control is applied to the geospatial data, making the geospatial data effectively publicly available to anyone with the app.
Style data features
Once your custom data has been uploaded and associated to a map style and map ID, you can style data features for visual impact, and make features respond to tap events.
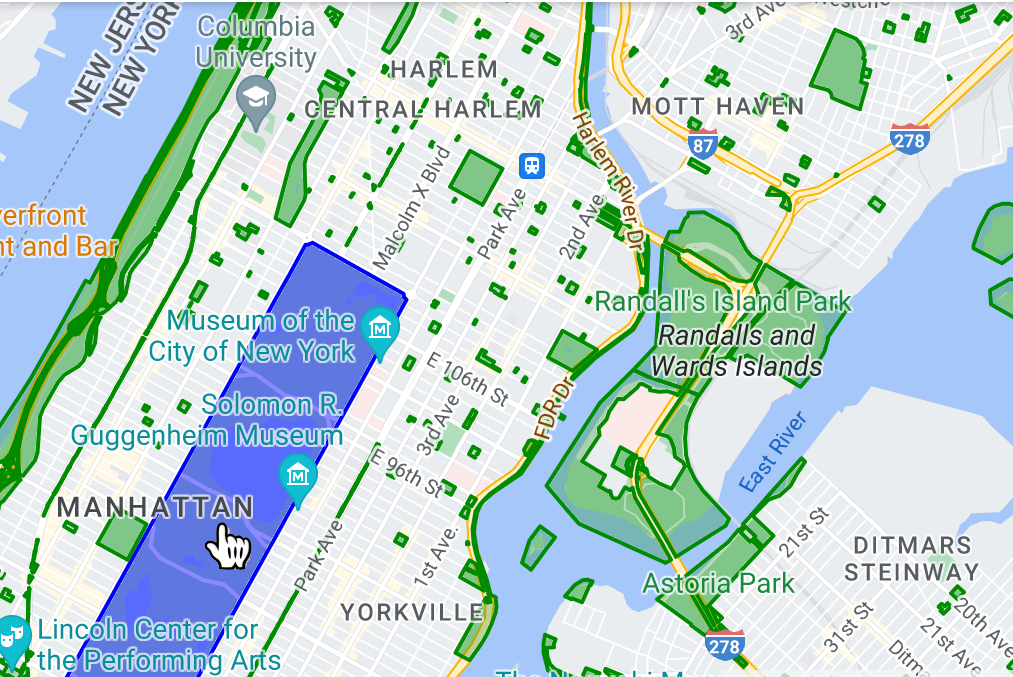
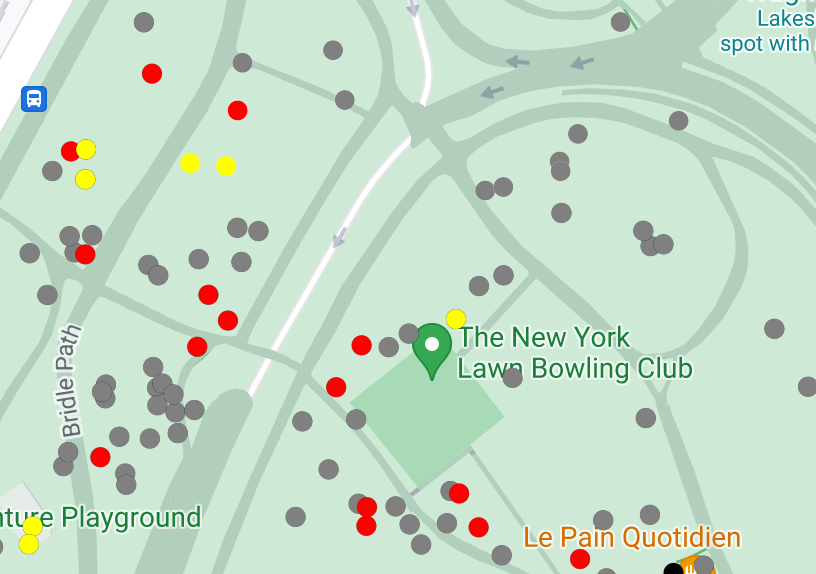
Style point data to show specific locations on the map.
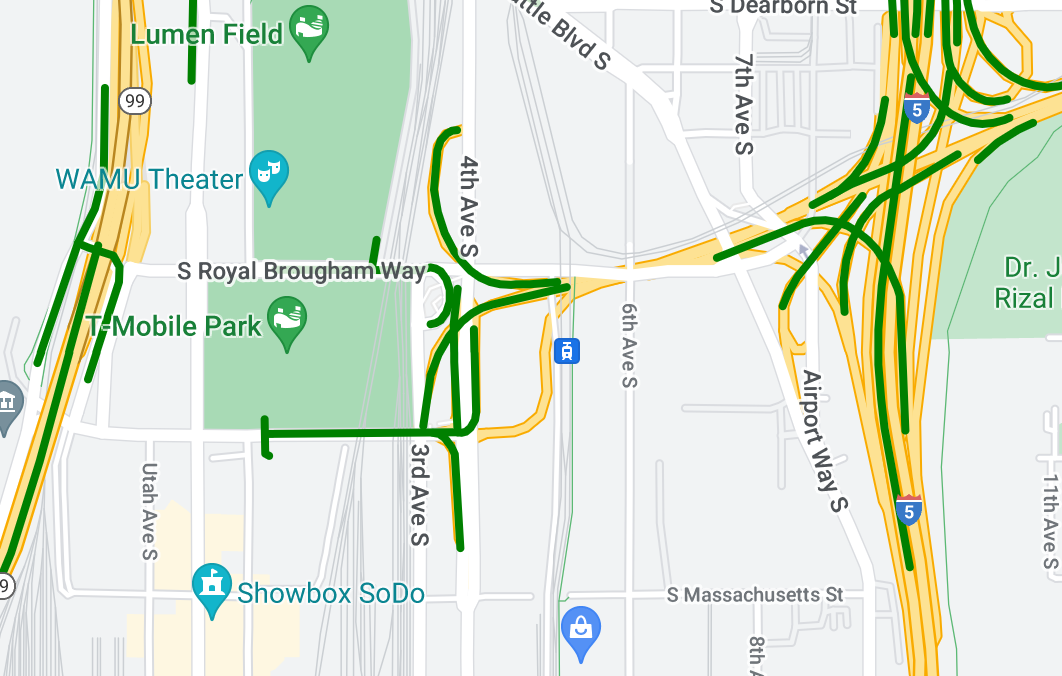
Style polyline data to highlight geographical features.
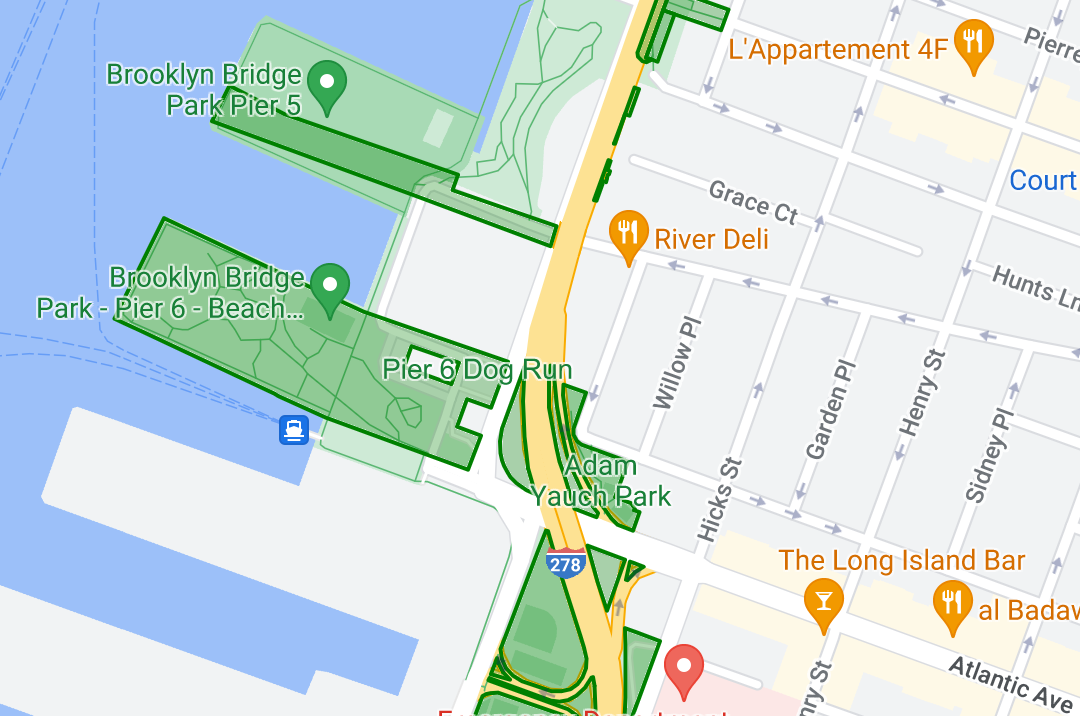
Style polygon data to highlight geographical areas.
Make data features respond to tap events by adding an event listener.