데이터 세트에 대한 데이터 기반 스타일 지정 기능을 사용하면 자체 지리 정보 데이터 세트를 업로드하고, 이 데이터 세트의 데이터 지형지물에 맞춤 스타일을 적용하고, 지도에 이러한 데이터 지형지물을 표시할 수 있습니다. 점, 다중선, 다각형 도형을 기반으로 데이터 시각화를 생성하고 데이터 지형지물이 탭 이벤트에 반응하도록 설정할 수 있습니다. 데이터 세트에 대한 데이터 기반 스타일 지정은 벡터 지도에서만 지원됩니다 (지도 ID 필요).
맞춤 지리 정보 데이터 세트 추가
Google Cloud 콘솔 또는 Google Cloud Shell을 사용하여 맞춤 데이터를 추가하세요. 각 데이터 세트에는 고유 ID가 있으며, 이 ID는 지도 스타일과 연결할 수 있습니다. 다음과 같은 데이터 형식이 지원됩니다.
- GeoJSON
- 쉼표로 구분된 데이터(CSV)
- KML
데이터 세트 요구사항 및 제한사항에 관한 자세한 내용은 데이터 세트 만들기 및 관리를 참고하세요.
공개 데이터 세트 정보
데이터 세트의 스타일을 지정하려면 지도 스타일을 지도 ID와 연결해야 하며, 이렇게 하면 데이터 세트도 지도 ID와 연결됩니다. 앱에서 개발자는 해당 지도 ID와 연결된 지도 스타일 및 지리 정보 데이터를 참조할 수 있습니다. 지리 정보 데이터에는 추가 액세스 제어가 적용되지 않으므로 앱이 있는 모든 사용자가 지리 정보 데이터를 공개적으로 사용할 수 있습니다.
데이터 지형지물 스타일 지정
맞춤 데이터가 업로드되어 지도 스타일 및 지도 ID에 연결되면 데이터 지형지물에 스타일을 지정해 시각적 효과를 높이고 지형지물이 탭 이벤트에 반응하도록 설정할 수 있습니다.
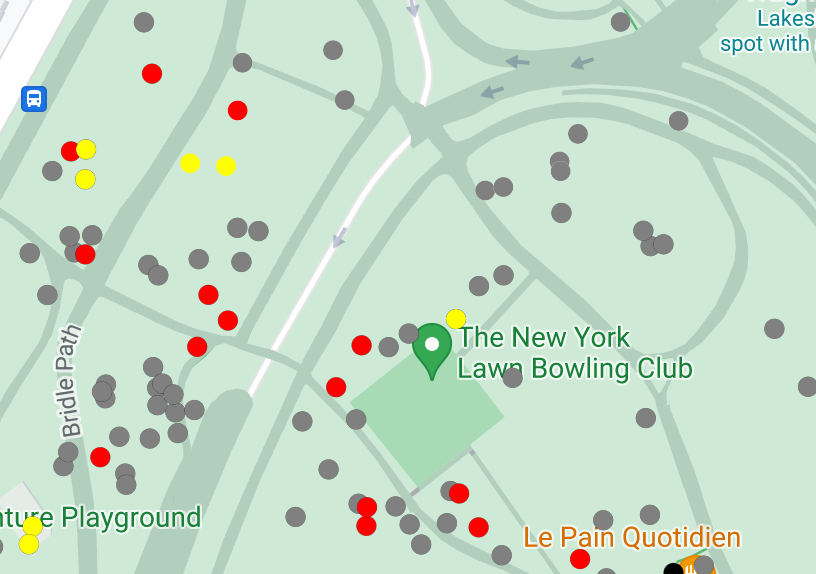
점 데이터의 스타일을 지정하여 지도에 특정 위치를 표시할 수 있습니다.
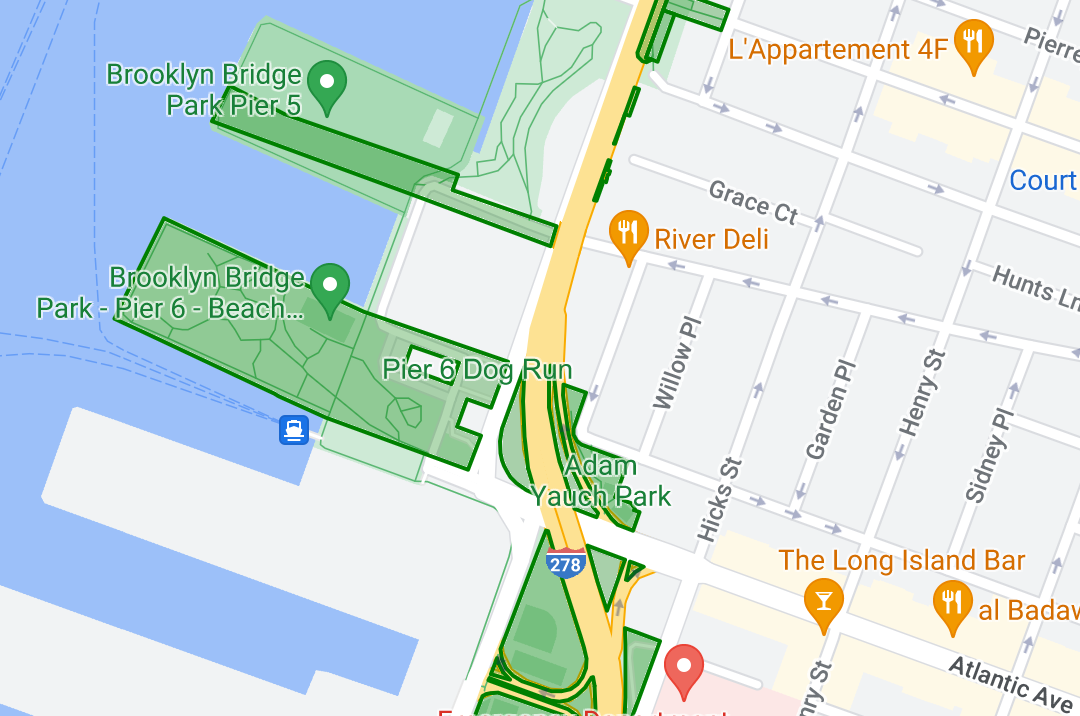
다중선 데이터의 스타일을 지정하여 지형지물을 강조 표시할 수 있습니다.

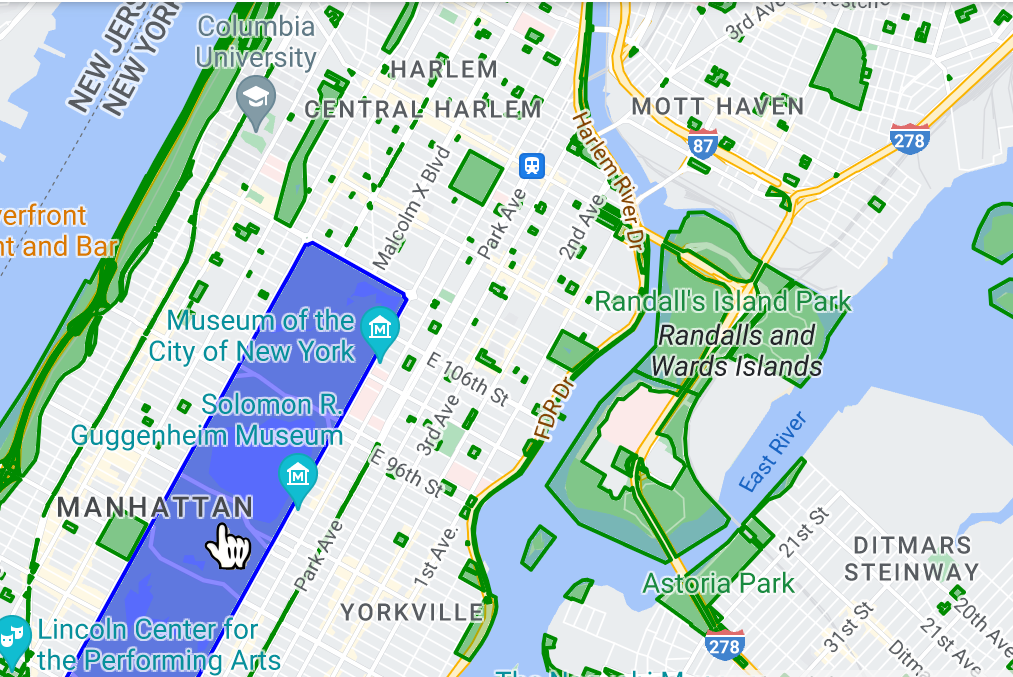
다각형 데이터의 스타일을 지정하여 지리적 영역을 강조 표시할 수 있습니다.
이벤트 리스너를 추가하여 데이터 지형지물이 탭 이벤트에 반응하도록 설정할 수 있습니다.