עיצוב מבוסס-נתונים של מערכי נתונים מאפשר לכם להעלות מערכי נתונים גיאוספציאליים משלכם, להחיל עיצוב מותאם אישית על מאפייני הנתונים שלהם ולהציג את מאפייני הנתונים האלה במפות. בעזרת סגנון מבוסס-נתונים למערכי נתונים, אתם יכולים ליצור תרשימים להמחשת נתונים על סמך גיאומטריות של נקודות, קווים ופוליגונים, ולגרום לתכונות של הנתונים להגיב לאירועי הקשה. יש תמיכה בסגנון מבוסס-נתונים של מערכי נתונים רק במפות וקטוריות (נדרש מזהה מפה).
מוסיפים את הנתונים בהתאמה אישית באמצעות מסוף Google Cloud או Google Cloud Shell. לכל מערך נתונים יש מזהה ייחודי שאפשר לשייך לסגנון מפה.
הפורמטים הבאים של נתונים נתמכים:
כדי להחיל סגנון על מערך נתונים, צריך לשייך סגנון מפה למזהה מפה, וכך לשייך גם את מערך הנתונים למזהה המפה. באפליקציה, המפתחים יכולים להפנות למזהה המפה הזה ולכל סגנון מפה ונתונים גיאוספציאליים שמשויכים אליו. לא מוחלת בקרת גישה נוספת על הנתונים הגיאו-מרחביים, ולכן הנתונים הגיאו-מרחביים זמינים לציבור לכל מי שיש לו את האפליקציה.
תכונות של נתוני סגנון
אחרי שמעלים את הנתונים המותאמים אישית ומשייכים אותם לסגנון מפה ולמזהה מפה, אפשר להחיל סגנון על תכונות הנתונים כדי ליצור השפעה ויזואלית, ולגרום לתכונות להגיב לאירועי הקשה.
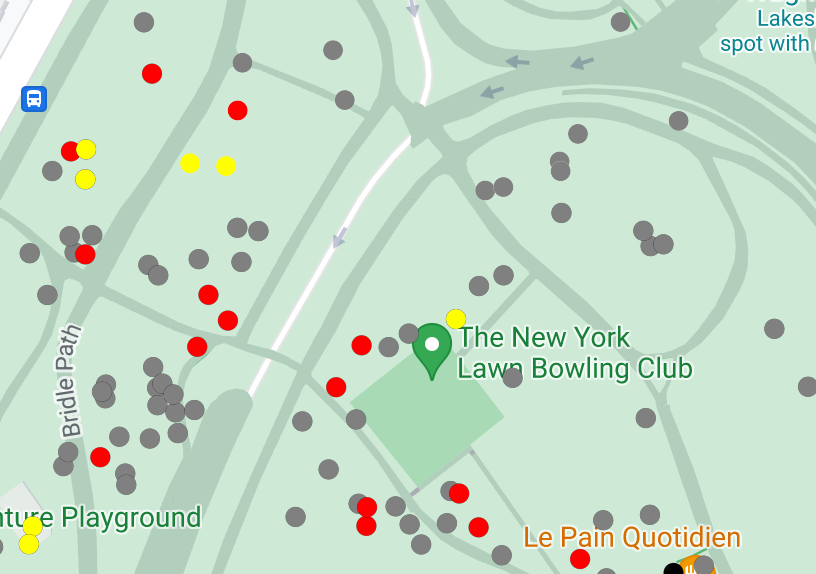
אפשר להגדיר סגנון לנתוני נקודות כדי להציג מיקומים ספציפיים במפה.
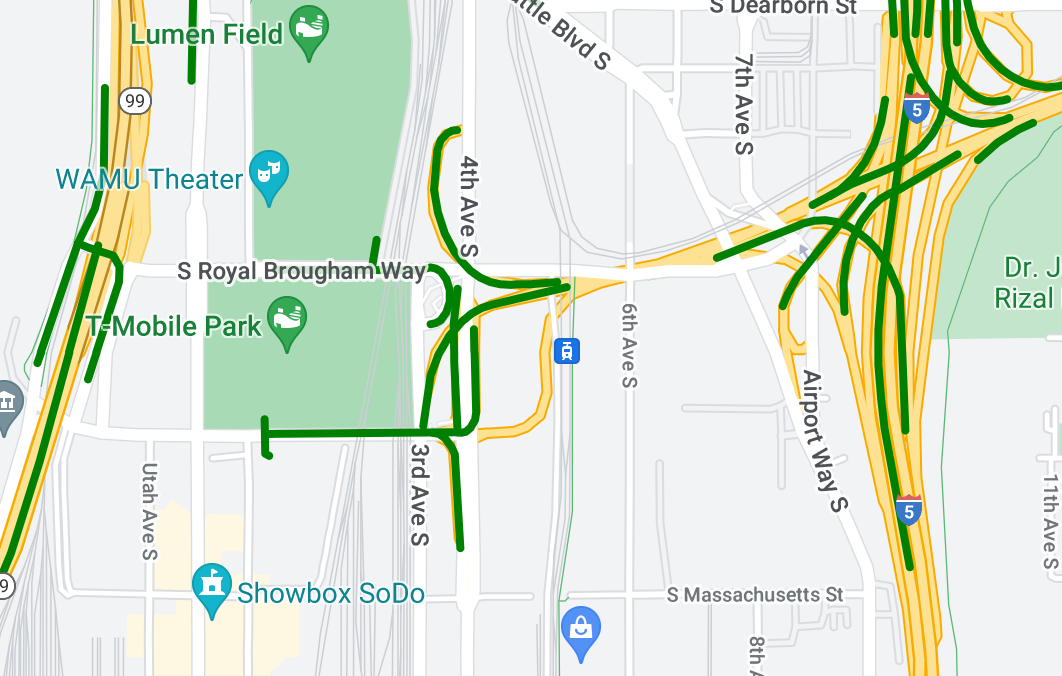
החלת סגנון על נתוני קו שבור כדי להדגיש מאפיינים גיאוגרפיים.
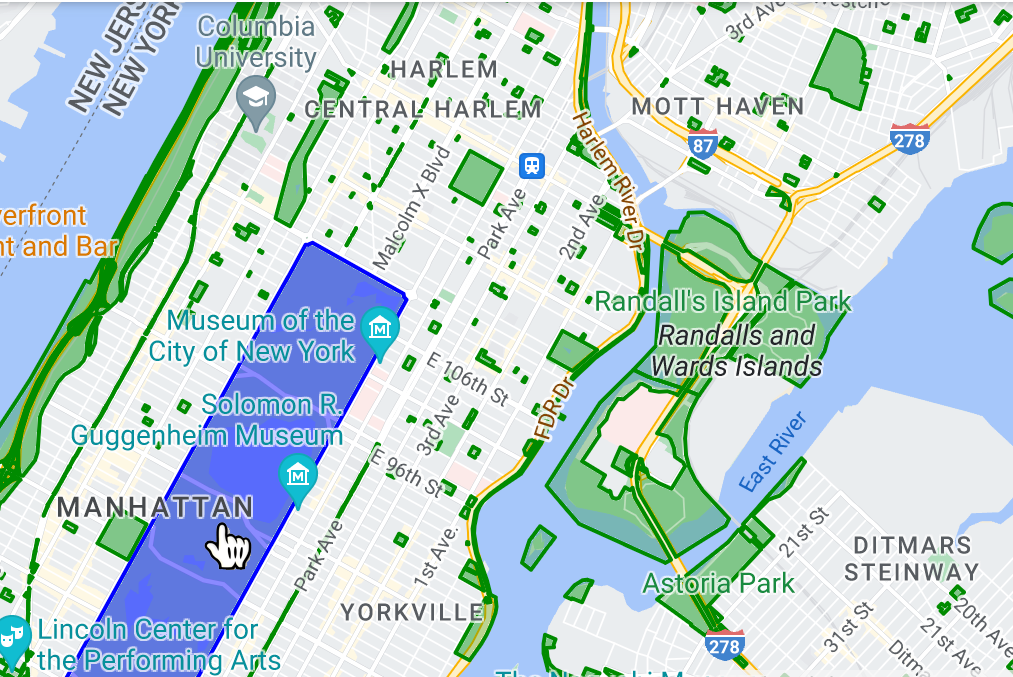
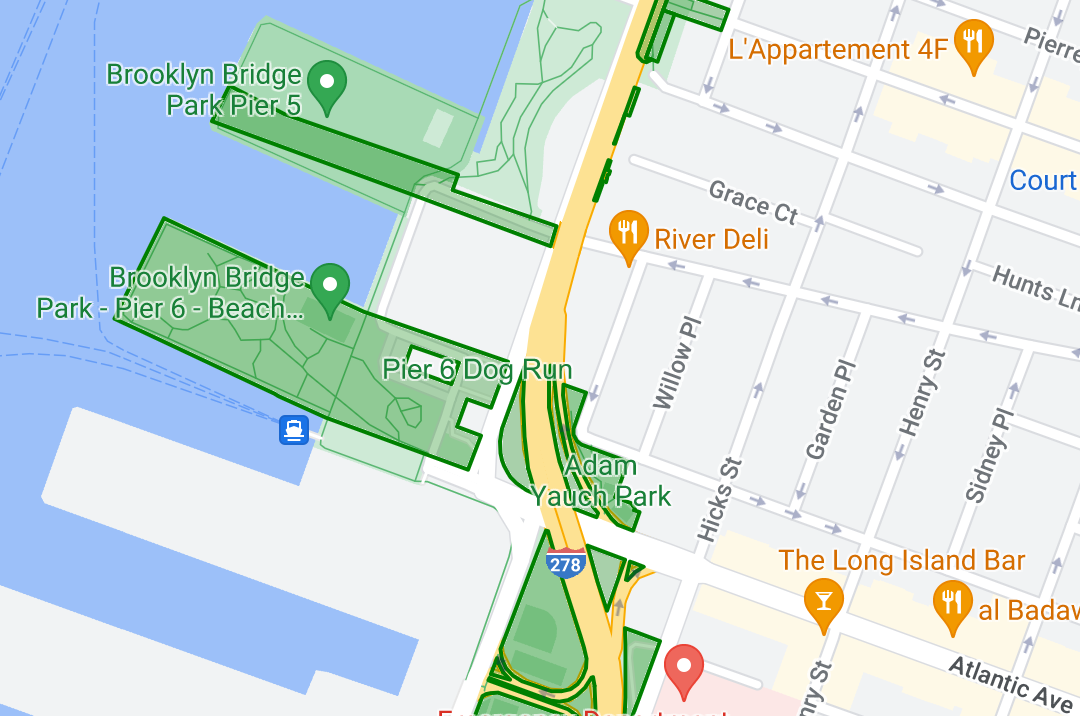
עיצוב נתוני פוליגונים כדי להדגיש אזורים גיאוגרפיים.
כדי שפיצ'רים של נתונים יגיבו לאירועי הקשה, מוסיפים מאזין לאירועים.
[[["התוכן קל להבנה","easyToUnderstand","thumb-up"],["התוכן עזר לי לפתור בעיה","solvedMyProblem","thumb-up"],["סיבה אחרת","otherUp","thumb-up"]],[["חסרים לי מידע או פרטים","missingTheInformationINeed","thumb-down"],["התוכן מורכב מדי או עם יותר מדי שלבים","tooComplicatedTooManySteps","thumb-down"],["התוכן לא עדכני","outOfDate","thumb-down"],["בעיה בתרגום","translationIssue","thumb-down"],["בעיה בדוגמאות/בקוד","samplesCodeIssue","thumb-down"],["סיבה אחרת","otherDown","thumb-down"]],["עדכון אחרון: 2025-09-05 (שעון UTC)."],[[["\u003cp\u003eData-driven styling allows you to upload custom geospatial datasets (GeoJSON, CSV, KML) and visualize them on vector maps with custom styles based on their geometries.\u003c/p\u003e\n"],["\u003cp\u003eYou can apply unique styling to point, polyline, and polygon data, enabling visualization of locations, geographical features, and areas, respectively.\u003c/p\u003e\n"],["\u003cp\u003eDatasets associated with map IDs are effectively public, accessible to anyone with the app referencing that ID.\u003c/p\u003e\n"],["\u003cp\u003eData features can be made interactive by adding event listeners, allowing them to respond to user interactions like taps.\u003c/p\u003e\n"],["\u003cp\u003eTo get started, you'll need to upload your data using Google Cloud Console or Google Cloud Shell and then associate it with a map style and ID.\u003c/p\u003e\n"]]],[],null,["Select platform: [Android](/maps/documentation/android-sdk/dds-datasets/overview \"View this page for the Android platform docs.\") [iOS](/maps/documentation/ios-sdk/dds-datasets/overview \"View this page for the iOS platform docs.\") [JavaScript](/maps/documentation/javascript/dds-datasets/overview \"View this page for the JavaScript platform docs.\")\n\n\u003cbr /\u003e\n\nData-driven styling for datasets lets you upload your own geospatial datasets,\napply custom styling to their data features, and display those data features on\nmaps. With data-driven styling for datasets, you can create data visualizations\nbased on point, polyline, and polygon geometries, and make data features respond\nto tap events. Data-driven styling for datasets is supported on vector maps\nonly (a map ID is required).\n\n[Get started with data-driven styling for datasets](/maps/documentation/ios-sdk/dds-datasets/start)\n\nAdd custom geospatial datasets\n\nAdd your custom data using Google Cloud Console or Google Cloud\nShell. Each dataset has a unique ID, which you can associate with a map style.\nThe following data formats are supported:\n\n- GeoJSON\n- Comma-separated (CSV)\n- KML\n\nFor details about dataset requirements and limitations, see\n[Create and manage a dataset](/maps/documentation/ios-sdk/dds-datasets/create-dataset#dataset-prerequisites)\n\nAbout public datasets\n\nIn order to style a dataset you must associate a map style with a map ID, which\nalso associates the dataset to the map ID. In an app, developers can reference\nthat map ID, and any map style and geospatial data associated with it. No\nadditional access control is applied to the geospatial data, making the\ngeospatial data effectively publicly available to anyone with the app.\n\nStyle data features\n\nOnce your custom data has been uploaded and associated to a map\nstyle and map ID, you can style data features for visual impact, and make\nfeatures respond to tap events.\n\nStyle point data to show specific locations on the map.\n\nStyle polyline data to highlight geographical features.\n\nStyle polygon data to highlight geographical areas.\n\nMake data features respond to tap events by adding an event\nlistener."]]