Page Summary
-
Algorithms can be applied to images using methods of the
ee.Terrainpackage, such as computing the slope of terrain. -
Mathematical operations, including trigonometric functions, can be performed on images using methods of the
ee.Imageclass. -
Image statistics within specific regions can be computed using reducers from the
ee.Reducerpackage and thereduceRegion()method. -
When performing reductions, it is important to consider and potentially adjust the
scaleparameter to avoid processing too many pixels.
Now that you know how to load and display an image, it's time to apply a computation to it.
For example, you can compute the slope of terrain, by passing the SRTM elevation image to the
slope method of the ee.Terrain
package.
Code Editor (JavaScript)
// Load the SRTM image.
var srtm = ee.Image('CGIAR/SRTM90_V4');

// Apply an algorithm to an image.
var slope = ee.Terrain.slope(srtm);

// Display the result.
Map.setCenter(-112.8598, 36.2841, 9); // Center on the Grand Canyon.
Map.addLayer(slope, {min: 0, max :60}, 'slope');
Note that in the code ee.Terrain.slope(srtm), the srtm image is
provided as an argument to the slope algorithm. The result should look something like
Figure 3.
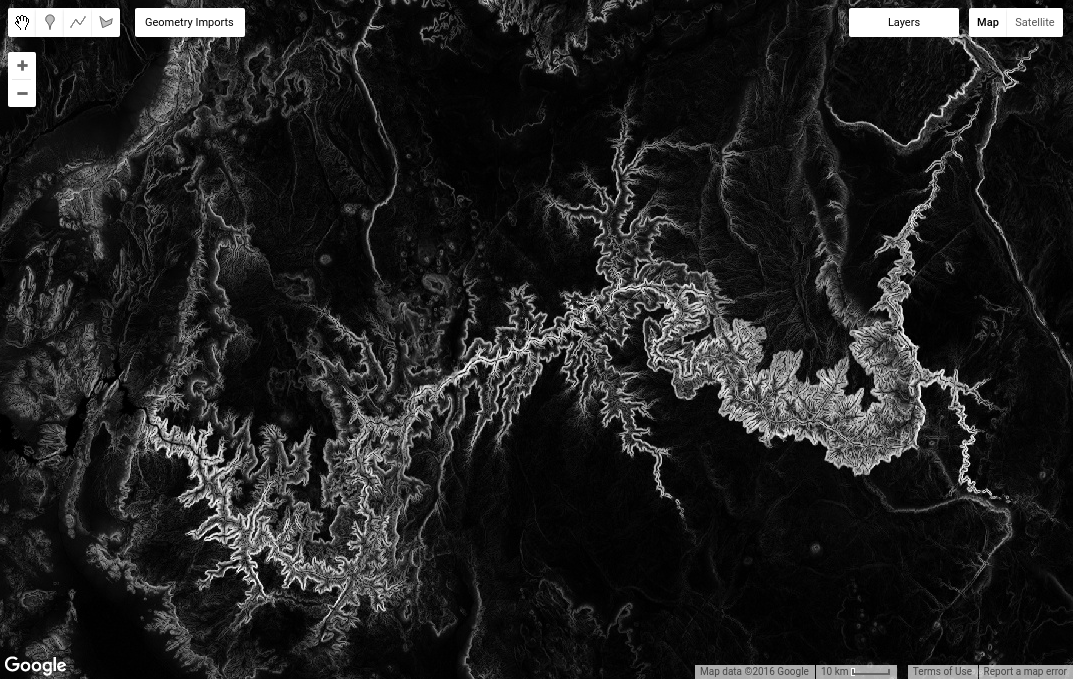
Image math
There are also methods in the ee.Image class that can be invoked on an
image object. For example, suppose you'd like to do some math using image bands (sometimes
called band math or map algebra). For example, you may be interested in
trigonometric operations on an aspect image. To accomplish that, first convert an
aspect image to radians, then call sin() on it. Reusing our srtm
image,
Code Editor (JavaScript)
// Get the aspect (in degrees).
var aspect = ee.Terrain.aspect(srtm);

// Convert to radians, compute the sin of the aspect.
var sinImage = aspect.divide(180).multiply(Math.PI).sin();

// Display the result.
Map.addLayer(sinImage, {min: -1, max: 1}, 'sin');
The result should look something like Figure 4. It's worth taking a closer look at the
aspect.divide(180).multiply(Math.PI).sin() code. By chaining multiple methods
like this, the code says, 'divide the aspect by 180, multiply the result of that by
π, and finally take the sin'. You can perform complex mathematical operations on
images by combining methods in this manner. See the
Image docs for a complete list of mathematical
operations, add(), subtract(), multiply(), etc.
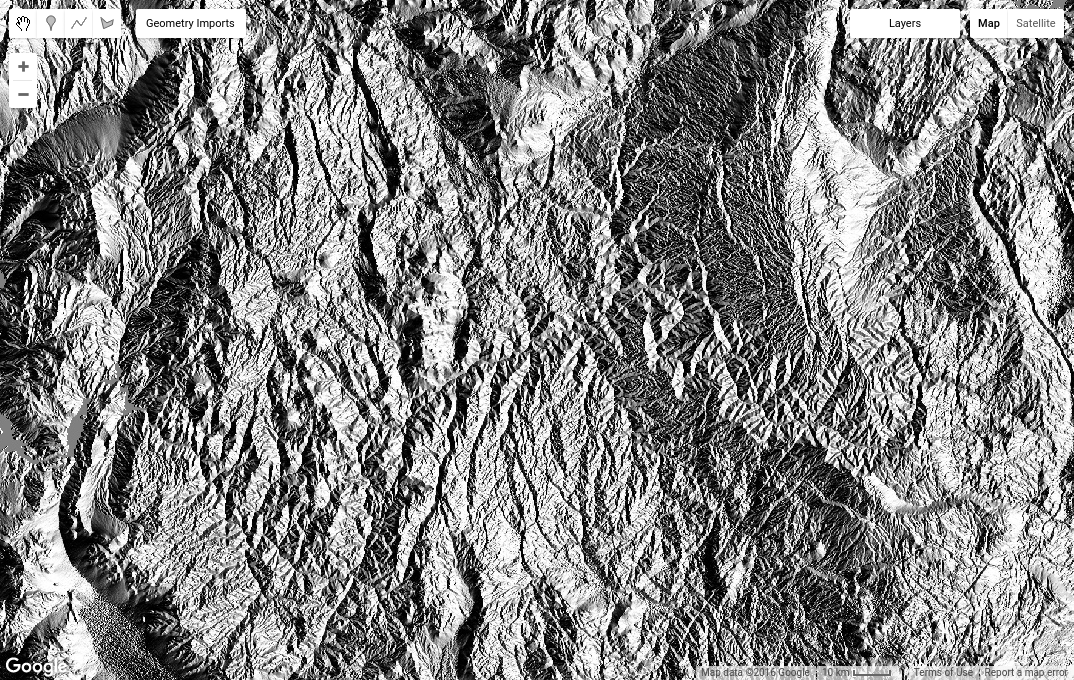
Image statistics
Another useful class of operations on images involves computing pixel statistics in image
regions, or raster-vector overlays. To compute statistics in Earth Engine, use a
reducer as represented by classes in the
ee.Reducer package. For example, suppose
you're interested in the mean of elevation in some region. You can define a region by
drawing a polygon using the geometry drawing tools.
To interactively draw a region, get the polygon drawing tool
( ), then digitize a polygon over your
area of interest and click Exit when you're done. Note that the resultant
), then digitize a polygon over your
area of interest and click Exit when you're done. Note that the resultant
ee.Geometry object is automatically named geometry and added
as an import at the top of your script. Rename that variable to 'polygon' by clicking
on the variable name in the imports and typing the new name.
Next, get the mean pixel value in the polygon using the following code:
Code Editor (JavaScript)
// Compute the mean elevation in the polygon.
var meanDict = srtm.reduceRegion({
  reducer: ee.Reducer.mean(),
  geometry: polygon,
  scale: 90
});

// Get the mean from the dictionary and print it.
var mean = meanDict.get('elevation');
print('Mean elevation', mean);
There are several things to note here. First, observe that reduceRegion() is
a method available for Image objects (learn
more about reducing regions here). Second, the method arguments are provided in a
JavaScript object that is passed as a single argument. (Specifically, the keys of the
object are the names of the method parameters. The values are the arguments to the
method). Third, the reducer parameter specifies the type of statistic to
compute and the geometry parameter specifies the region in which to compute
the statistic. The scale parameter is the pixel size in meters to use. To
avoid ambiguity, you should always specify scale when doing reductions as Earth Engine
may not be able to automatically determine the appropriate scale from the inputs.
(Learn more about scale in Earth Engine).
Lastly, the return value of reduceRegion() is a dictionary
in which keys are band names and values are the pixel statistics for the bands. The
get() method on a dictionary returns the value corresponding to the key
provided as an argument. In this case, the srtm image has one band,
'elevation', so the example code gets that statistic from the dictionary and prints it.
When you run this code, if you get an error that looks like:
Fear not! There are several things you can do to resolve the error. The
reduceRegion() method has a check to make sure you consider whether you
really want to include so many pixels in your computation. This is intended to prevent
you from accidentally doing something silly, like trying compute the mean of every
one-meter pixel in the world (don't do that). To resolve the error, either set the
bestEffort parameter to true by adding bestEffort: true
to the dictionary of parameters, or set the maxPixels parameter to a value
higher than the default of 10 million pixels, or both. If bestEffort is
true, Earth Engine will automatically recompute the scale such that maxPixels
is not exceeded.
Digression: Scale in Earth Engine
In the previous example, scale is set to approximately the native resolution
of the SRTM image. You can discover the native resolution of an image with:
Code Editor (JavaScript)
var scale = srtm.projection().nominalScale();
print('SRTM scale in meters', scale);
If you specify a scale smaller than the native resolution, Earth Engine will happily resample the input image using nearest neighbor, then include all those smaller pixels in the computation. If you set the scale to be larger, Earth Engine will use input pixels from an aggregated version of the input (i.e. get pixels from a higher level of the image pyramid). Learn more about how Earth Engine handles scale in this doc.
So far, you've been working with a single image with a single band. In the next page, you'll learn about multi-band images and image collections.