Page Summary
-
This page explains how to use Cloud Monitoring to create charts for monitoring Earth Engine compute and storage usage.
-
Other ways to monitor Earth Engine usage from the Cloud Console include the APIs & Services > Metrics, Quotas & System Limits, and Credentials pages.
-
To chart metrics in Metrics Explorer, navigate to the Monitoring > Metrics Explorer page, select your project, choose a metric under the Earth Engine Cloud Project resource, and configure the filters.
-
Earth Engine metrics available for charting in Cloud Monitoring include Completed EECU-seconds, In-progress EECU-seconds, and Used Bytes, each with specific descriptions and available labels.
-
Workload tags allow you to label and monitor specific Earth Engine computations and export tasks in the Metrics Explorer using the
workload_taglabel.
This page describes how to create charts to monitor Earth Engine compute and storage consumption using Cloud Monitoring.
There are other ways to monitor Earth Engine usage from the Cloud Console, which are not the focus of the document but include:
- The APIs & Services > Metrics page, which shows basic metrics including traffic (number of requests), errors and latency (per API method, response code or credentials).
- The APIs & Services > Quotas & System Limits page, which shows the amount of stored assets in bytes and the number of read requests for the assets.
- The APIs & Services > Credentials page, which shows which credentials (e.g, service accounts) have been used to access the API.
View consumption in Cloud Monitoring
Chart metrics in Metrics Explorer
Go to the Monitoring > Metrics Explorer page in the Cloud Console.
Go to Metrics Explorer Select the name of your project if it is not already selected at the top of the page.
- Note: You must have the appropriate Identity and Access Management (IAM) permissions to access monitoring data.
Click Select a metric to choose a metric to add to the chart.
- Earth Engine metrics are under the Earth Engine Cloud Project resource.
- By default, only resources and metrics that were active in the past hour are visible. Adjust the time range or un-check the "Active" filter to see more metrics.
Once you've selected a metric, click Apply.
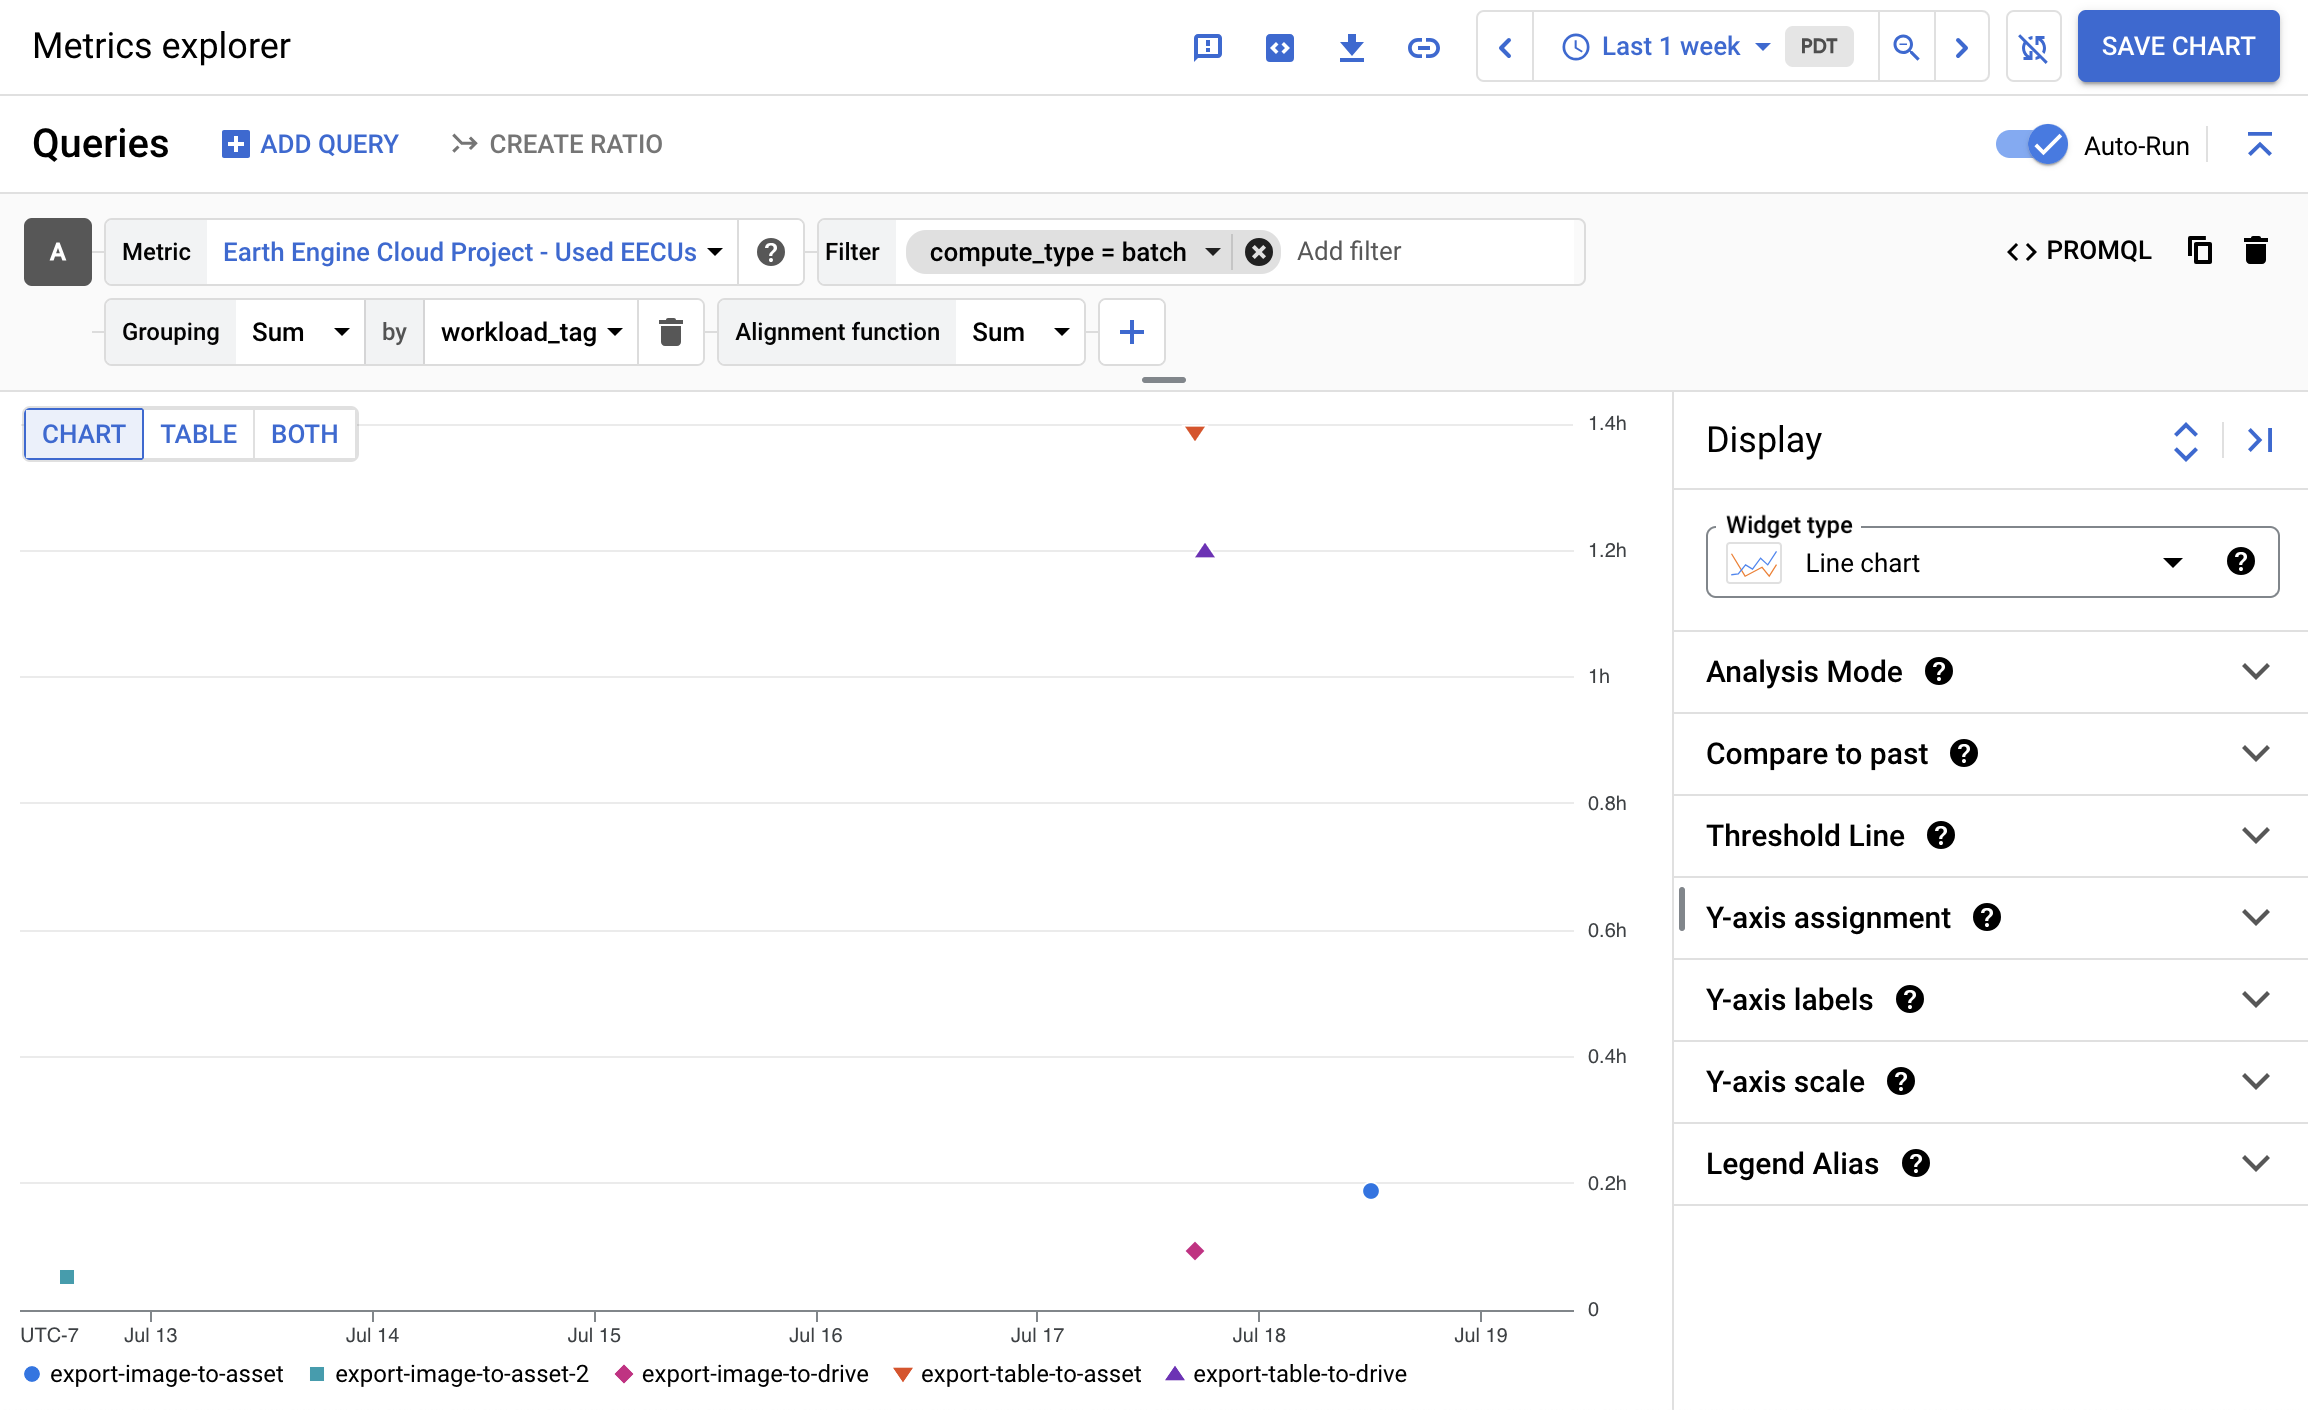
In the top pane, configure the drop-down filters to set how to visualize the data.
- By default, the explorer will show a rate aggregation for compute metrics. See the Units and Aligners section for details on choosing a different Aligner and showing explicit units.
- For example, to see the total completed batch compute used per
workload_tag(see Workload tags section) over the past week, you could choose the following settings. Here, each data point represents the total amount of EECU-hours each completed batch task used.
The Cloud Monitoring documentation provides more guides on using Cloud Monitoring. In particular, the Select the metrics to chart page provides a detailed overview of different ways to build queries, and the Filtering and aggregation page provides more information about configuring the time series.
Available Metrics
| Metric | Description | Available labels |
|---|---|---|
| Completed EECU-seconds | Earth Engine compute usage of successful requests in EECU-seconds. Usage is reported when a request completes and is not reported for failed requests. |
compute_type: The type of compute, based on the
processing environment of the request. One of
[online, batch, highvolume].
client_type: The client type (if known), for example:
ee-js/latest or
python/v0.1.300. Client type is not set for batch compute.
workload_tag: The workload tag (if supplied in the client), for example: my-export1. See the Workload tags section for how to set this label.
|
| In-progress EECU-seconds | Earth Engine compute usage of all requests in EECU-seconds. Usage is reported periodically as a request is running. |
compute_type: The type of compute, based on the
processing environment of the request. One of
[online, batch, highvolume].
client_type: The client type (if known), for example:
ee-js/latest or
python/v0.1.300. Client type is not set for batch compute.
workload_tag: The workload tag (if supplied in the client), for example: my-export1. See the Workload tags section for how to set this label.
|
| Used Bytes | The number of bytes of Earth Engine asset storage used. Sampled every 30 minutes. | N/A |
For a complete list of available metrics in Cloud Monitoring, see Google Cloud metrics.
Units and Aligners
By default, compute metrics will be displayed as a unitless rate of the average EECU-seconds used per-second over the Min interval (default 1 minute).
To see the raw EECU-time used with explicit units, click the
Aggregation field in your query and choose "Configure aligner" from the
resulting menu. This replaces the aggregation operation with two new operations:
Grouping and Alignment function. Choosing "Grouping: Sum" and
"Alignment function: Sum" will construct a graph with explicit units,
representing the total EECU-time being used at each data point. See the Aligner
reference
for a list of possible Aligners.
Workload Tags
Workload tags are labels for monitoring specific computations within Earth
Engine. Use setDefaultWorkloadTag to bind all computations in the script to a
default workload tag unless one is explicitly set with
ee.data.setWorkloadTag, in
which case the default is overridden. These methods set the workload_tag label
for specific computations and export tasks.
You can then monitor and track tagged computations in the
Metrics Explorer using the Earth Engine Cloud Project >
Project > Used EECUs metric, and grouping or filtering by workload_tag.
For example, to monitor the EECUs used for an image computation and/or and export:
Code Editor (JavaScript)
// Set a default workload tag.
ee.data.setDefaultWorkloadTag('landsat-compositing')
var composite = ee.ImageCollection('LANDSAT/LC08/C02/T1_L2')
                     .filterDate('2020-01-01', '2021-01-01')
                     .median();

// Set a workload tag for export.
ee.data.setWorkloadTag('export-jobs');
Export.image.toAsset(composite);
ee.data.resetWorkloadTag(); // Reset to landsat-compositing

ee.data.resetWorkloadTag(true); // Reset back to empty
import ee
import geemap.core as geemap
Colab (Python)
# Authenticate, then initialize with your Cloud Project.
ee.Initialize(project='your-project')

# Set a default workload tag.
ee.data.setDefaultWorkloadTag('landsat-compositing')
composite = (
    ee.ImageCollection('LANDSAT/LC08/C02/T1_L2')
    .filterDate('2020-01-01', '2021-01-01')
    .median()
)

# Set a workload tag for export.
ee.data.setWorkloadTag('export-jobs')
ee.batch.Export.image.toAsset(composite).start()
ee.data.resetWorkloadTag()  # Reset to landsat-compositing

ee.data.resetWorkloadTag(True)  # Reset back to empty

# Alternatively, use a workload tag with the `with` context manager.
with ee.data.workloadTagContext('export-jobs'):
  ee.batch.Export.image.toAsset(composite).start()
In this example, all computations are annotated with the landsat-compositing
tag (set as default), and the export gets its own workload tag since
ee.data.setWorkloadTag is
called before running it. Use
ee.data.resetWorkloadTag to
set back to the default tag or to set the default tag back to an empty string.