בסרטון הזה מוסבר איך להשתמש במפות חום כחלופה לסמנים, כשצריך להציג במפה מספר גדול של נקודות נתונים.
מפות צפיפות מאפשרות לצופים להבין בקלות את ההתפלגות והעוצמה היחסית של נקודות הנתונים במפה. במקום להציב סמן בכל מיקום, במפות חום משתמשים בצבע כדי לייצג את התפלגות הנתונים.
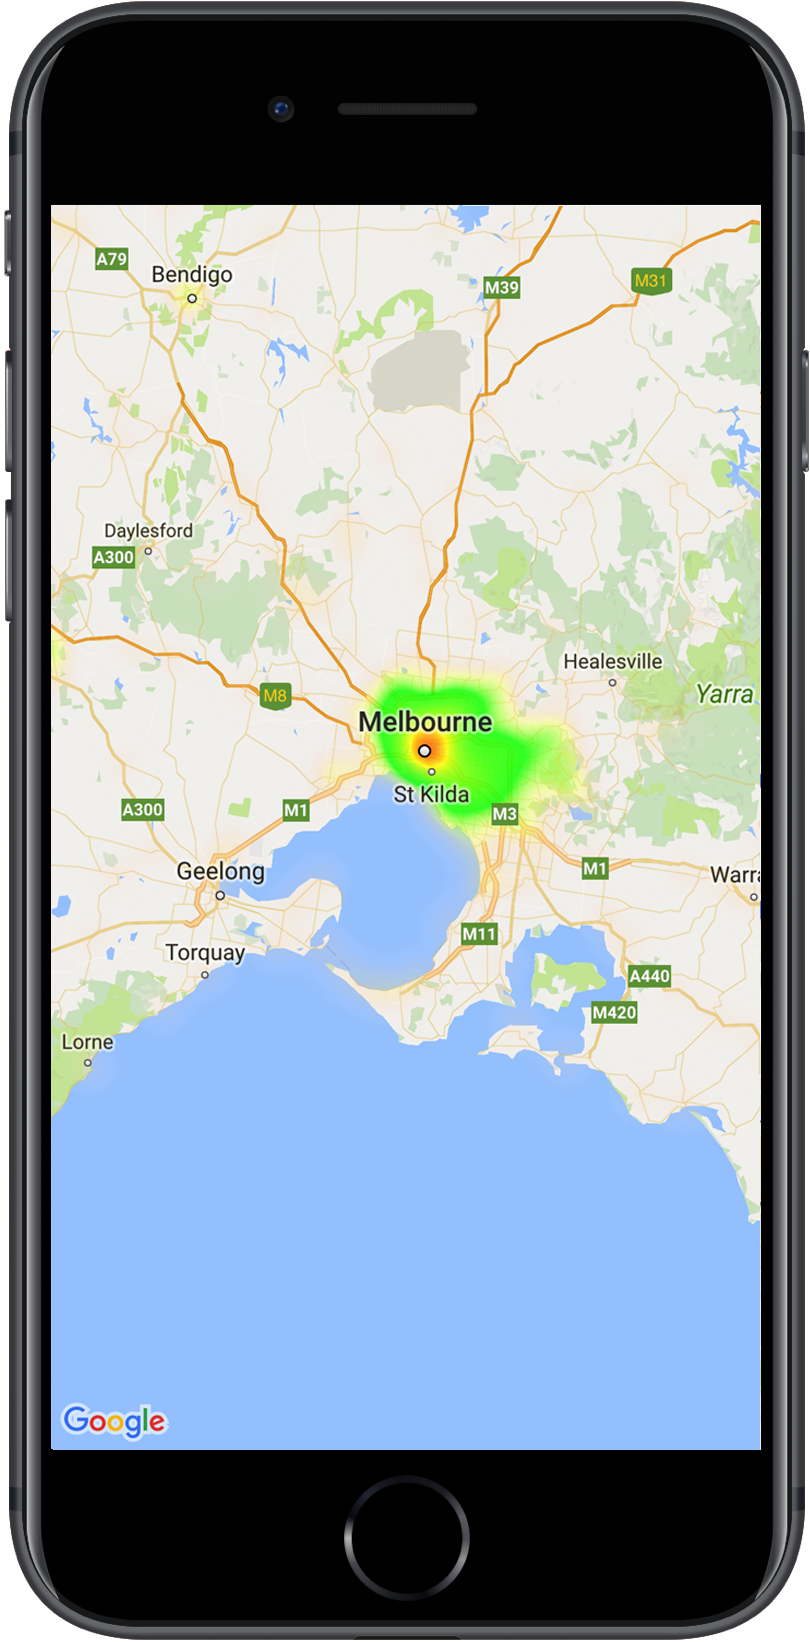
בדוגמה שלמטה, הצבע האדום מייצג אזורים עם ריכוז גבוה של תחנות משטרה בוויקטוריה, אוסטרליה.
מפת חום במפה
אם עדיין לא הגדרתם את הספרייה, כדאי לעיין במדריך ההגדרה לפני שתמשיכו לקרוא את שאר המאמר הזה.
הוספת מפת חום פשוטה
כדי להוסיף מפת חום למפה, צריך להשתמש במערך נתונים שכולל את הקואורדינטות של כל מיקום שמעניין אתכם. קודם כול יוצרים מופע GMUHeatmapTileLayer ומגדירים את המאפיין map לערך GMSMapView.
כדי לוודא שמפת הבסיס נטענת לפני שמשתמשים במפת החום, צריך לעשות את זה בפונקציה viewDidLoad() של האפליקציה. לאחר מכן מעבירים אוסף של אובייקטים GMUWeightedLatLng למופע GMUHeatmapTileLayer.
כלי השירות מספק את המחלקה GMUHeatmapTileLayer, שמקבלת אוסף של אובייקטים מסוג GMUWeightedLatLng. הוא יוצר את תמונות המשבצות לרמות שונות של זום, על סמך אפשרויות הרדיוס, הגרדיאנט והאטימות שצוינו.
הסבר מפורט יותר על השלבים:
יוצרים מופע GMUHeatmapTileLayer ומגדירים את המאפיין map לערך GMSMapView (צריך לעשות את זה בפונקציה viewDidLoad() של האפליקציה).
מעבירים אוסף של אובייקטים מסוג GMUWeightedLatLng למופע GMUHeatmapTileLayer.
מפעילים את GMUHeatmapTileLayer.map ומעבירים את תצוגת המפה.
Swift
classHeatmap:UIViewController{privatevarmapView:GMSMapView!privatevarheatmapLayer:GMUHeatmapTileLayer!overridefuncviewDidLoad(){super.viewDidLoad()heatmapLayer=GMUHeatmapTileLayer()heatmapLayer.map=mapView}// ...funcaddHeatmap(){// Get the data: latitude/longitude positions of police stations.guardletpath=Bundle.main.url(forResource:"police_stations",withExtension:"json")else{return}guardletdata=try?Data(contentsOf:path)else{return}guardletjson=try?JSONSerialization.jsonObject(with:data,options:[])else{return}guardletobject=jsonas?[[String:Any]]else{print("Could not read the JSON.")return}varlist=[GMUWeightedLatLng]()foriteminobject{letlat=item["lat"]as!CLLocationDegreesletlng=item["lng"]as!CLLocationDegreesletcoords=GMUWeightedLatLng(coordinate:CLLocationCoordinate2DMake(lat,lng),intensity:1.0)list.append(coords)}// Add the latlngs to the heatmap layer.heatmapLayer.weightedData=list}}
Objective-C
@implementationHeatmap{GMSMapView*_mapView;GMUHeatmapTileLayer*_heatmapLayer;}-(void)viewDidLoad{[superviewDidLoad];_heatmapLayer=[[GMUHeatmapTileLayeralloc]init];_heatmapLayer.map=_mapView;}// ...-(void)addHeatmap{// Get the data: latitude/longitude positions of police stations.NSURL*path=[NSBundle.mainBundleURLForResource:@"police_stations"withExtension:@"json"];NSData*data=[NSDatadataWithContentsOfURL:path];NSArray*json=[NSJSONSerializationJSONObjectWithData:dataoptions:0error:nil];NSMutableArray<GMUWeightedLatLng*>*list=[[NSMutableArrayalloc]init];[jsonenumerateObjectsUsingBlock:^(id_Nonnullobj,NSUIntegeridx,BOOL*_Nonnullstop){NSDictionary*item=(NSDictionary*)obj;CLLocationDegreeslat=[(NSNumber*)[itemvalueForKey:@"lat"]doubleValue];CLLocationDegreeslng=[(NSNumber*)[itemvalueForKey:@"lng"]doubleValue];GMUWeightedLatLng*coords=[[GMUWeightedLatLngalloc]initWithCoordinate:CLLocationCoordinate2DMake(lat,lng)intensity:1.0];[listaddObject:coords];}];// Add the latlngs to the heatmap layer._heatmapLayer.weightedData=list;}@end
בדוגמה הזו, הנתונים מאוחסנים בקובץ JSON, police_stations.json.
הנה קטע מהקובץ:
למפת החום יש כמה מאפיינים שאפשר להתאים אישית. אפשר להגדיר את האפשרויות כשיוצרים את מופע GMUHeatmapTileLayer, או בכל שלב אחר על ידי הגדרת ערך חדש לאפשרות.
אלה האפשרויות הזמינות:
רדיוס: הגודל של הטשטוש הגאוסיאני שמוחל על מפת החום, בפיקסלים. ברירת המחדל היא 20. הערך חייב להיות בין 10 ל-50. משתמשים בGMUHeatmapTileLayer.radius כדי להגדיר את הרדיוס.
מעבר צבעים: טווח של צבעים שמשמשים במפת החום ליצירת מפת הצבעים, מדרגת העוצמה הנמוכה ביותר ועד הגבוהה ביותר. יוצרים GMUGradient באמצעות מערך של מספרים שלמים שמכיל את הצבעים, ומערך של מספרים עשרוניים שמציין את נקודת ההתחלה של כל צבע, שמוצגת כאחוז מהעוצמה המקסימלית ומבוטאת כשבר מ-0 עד 1. צריך לציין רק צבע אחד למעבר צבעים חד-צבעי, או לפחות שני צבעים למעבר צבעים רב-צבעי. מפת הצבעים נוצרת באמצעות אינטרפולציה בין הצבעים האלה.
למעבר הצבעים שמוגדר כברירת מחדל יש שני צבעים. הפרמטר colorMapSize מגדיר את מספר השלבים בהדרגה. מספרים גדולים יותר יניבו מעבר חלק יותר בין הצבעים, ומספרים קטנים יותר יניבו מעברים חדים יותר, בדומה לתרשים קונטור. משתמשים ב-GMUHeatmapTileLayer.gradient כדי להגדיר את המעבר ההדרגתי.
אטימות: האטימות של שכבת מפת החום כולה, והיא נעה בין 0 ל-1. ערך ברירת המחדל הוא 0.7. משתמשים בערך GMUHeatmapTileLayer.opacity כדי להגדיר את רמת השקיפות.
עדכון של איסוף הנתונים. משתמשים ב-GMUHeatmapTileLayer.weightedData ומעבירים מערך של GMUWeightedLatLng.
התקשרו אל GMUHeatmapTileLayer.clearTileCache().
הסרת מפת חום
כדי להסיר מפת חום, קוראים ל-GMUHeatmapTileLayer.map ומעבירים את nil.
Swift
heatmapLayer.map=nil
Objective-C
_heatmapLayer.map=nil;
לצפייה באפליקציית ההדגמה
דוגמה נוספת להטמעה של מפת חום מופיעה ב-HeatmapViewController באפליקציית ההדגמה שמגיעה עם ספריית כלי העזר.
במדריך ההגדרה מוסבר איך להפעיל את אפליקציית ההדגמה.
[[["התוכן קל להבנה","easyToUnderstand","thumb-up"],["התוכן עזר לי לפתור בעיה","solvedMyProblem","thumb-up"],["סיבה אחרת","otherUp","thumb-up"]],[["חסרים לי מידע או פרטים","missingTheInformationINeed","thumb-down"],["התוכן מורכב מדי או עם יותר מדי שלבים","tooComplicatedTooManySteps","thumb-down"],["התוכן לא עדכני","outOfDate","thumb-down"],["בעיה בתרגום","translationIssue","thumb-down"],["בעיה בדוגמאות/בקוד","samplesCodeIssue","thumb-down"],["סיבה אחרת","otherDown","thumb-down"]],["עדכון אחרון: 2025-09-05 (שעון UTC)."],[[["\u003cp\u003eHeatmaps visualize the density of data points on a map using color, offering an alternative to markers for large datasets.\u003c/p\u003e\n"],["\u003cp\u003eThe \u003ccode\u003eGMUHeatmapTileLayer\u003c/code\u003e class is used to create heatmaps, accepting \u003ccode\u003eGMUWeightedLatLng\u003c/code\u003e objects for data points.\u003c/p\u003e\n"],["\u003cp\u003eHeatmaps can be customized by adjusting properties like radius, gradient, and opacity using the \u003ccode\u003eGMUHeatmapTileLayer\u003c/code\u003e instance.\u003c/p\u003e\n"],["\u003cp\u003eTo update the heatmap's data or options, modify the relevant properties and then call \u003ccode\u003eclearTileCache()\u003c/code\u003e to refresh the display.\u003c/p\u003e\n"],["\u003cp\u003eHeatmaps can be removed from the map by setting the \u003ccode\u003emap\u003c/code\u003e property of the \u003ccode\u003eGMUHeatmapTileLayer\u003c/code\u003e to \u003ccode\u003enil\u003c/code\u003e.\u003c/p\u003e\n"]]],["Heatmaps display data density on maps using color, offering an alternative to markers. To add one, create a `GMUHeatmapTileLayer` instance, setting its `map` property to `GMSMapView`. Then, supply `GMUWeightedLatLng` objects representing data coordinates to this instance and call `GMUHeatmapTileLayer.map`. Customize heatmaps by adjusting `radius`, `gradient`, and `opacity` properties. To modify data or settings, update values and call `GMUHeatmapTileLayer.clearTileCache()`. To remove the heatmap, set the `map` property to `nil`.\n"],null,["Select platform: [Android](/maps/documentation/android-sdk/utility/heatmap \"View this page for the Android platform docs.\") [iOS](/maps/documentation/ios-sdk/utility/heatmap \"View this page for the iOS platform docs.\") [JavaScript](/maps/documentation/javascript/heatmaplayer \"View this page for the JavaScript platform docs.\")\n\n\u003cbr /\u003e\n\nThis page describes the heatmap utility that's available in the [utility\nlibrary for the\nMaps SDK for iOS](https://github.com/googlemaps/google-maps-ios-utils).\nHeatmaps are useful for representing the distribution and\ndensity of data points on a map.\n\nThis video discusses the use of heatmaps as an alternative to markers, when\nyour data requires a large number of data points on the map. \n\nHeatmaps make it easy for viewers to understand the distribution and relative\nintensity of data points on a map. Rather than placing a marker at each\nlocation, heatmaps use color to represent the distribution of the data.\n\nIn the example below, red represents areas of high concentration of police\nstations in Victoria, Australia.\nA heatmap on a map **Note:** You can set your own colors for the heatmap, using the `gradient` property. See how to [customize](#customize) colors and other properties of your heatmap.\n\nIf you haven't yet set up the library, follow the [setup\nguide](/maps/documentation/ios-sdk/utility/setup) before reading the rest of\nthis page.\n\nAdding a simple heatmap\n\nTo add a heatmap to your map, you will need a dataset consisting of the\ncoordinates for each location of interest. First, create a\n`GMUHeatmapTileLayer` instance, setting the `map` property to a `GMSMapView`.\nDo this in your app's `viewDidLoad()` function, to ensure that the base map is\nloaded before working with the heatmap. Then pass a collection of\n`GMUWeightedLatLng` objects to the `GMUHeatmapTileLayer` instance.\n\nThe utility supplies the `GMUHeatmapTileLayer` class, which accepts a\ncollection of `GMUWeightedLatLng` objects. It creates the tile images for\nvarious zoom levels, based on the radius, gradient and opacity options\nsupplied.\n\nLooking at the steps in more detail:\n\n1. Create a `GMUHeatmapTileLayer` instance, setting the `map` property to a `GMSMapView` (do this in your app's `viewDidLoad()` function).\n2. Pass a collection of `GMUWeightedLatLng` objects to the `GMUHeatmapTileLayer` instance.\n3. Call `GMUHeatmapTileLayer.map`, passing the map view. \n\n Swift \n\n ```swift\n class Heatmap: UIViewController {\n\n private var mapView: GMSMapView!\n private var heatmapLayer: GMUHeatmapTileLayer!\n\n override func viewDidLoad() {\n super.viewDidLoad()\n heatmapLayer = GMUHeatmapTileLayer()\n heatmapLayer.map = mapView\n }\n\n // ...\n\n func addHeatmap() {\n\n // Get the data: latitude/longitude positions of police stations.\n guard let path = Bundle.main.url(forResource: \"police_stations\", withExtension: \"json\") else {\n return\n }\n guard let data = try? Data(contentsOf: path) else {\n return\n }\n guard let json = try? JSONSerialization.jsonObject(with: data, options: []) else {\n return\n }\n guard let object = json as? [[String: Any]] else {\n print(\"Could not read the JSON.\")\n return\n }\n\n var list = [GMUWeightedLatLng]()\n for item in object {\n let lat = item[\"lat\"] as! CLLocationDegrees\n let lng = item[\"lng\"] as! CLLocationDegrees\n let coords = GMUWeightedLatLng(\n coordinate: CLLocationCoordinate2DMake(lat, lng),\n intensity: 1.0\n )\n list.append(coords)\n }\n\n // Add the latlngs to the heatmap layer.\n heatmapLayer.weightedData = list\n }\n }\n \n ```\n\n Objective-C \n\n ```objective-c\n @implementation Heatmap {\n GMSMapView *_mapView;\n GMUHeatmapTileLayer *_heatmapLayer;\n }\n\n - (void)viewDidLoad {\n [super viewDidLoad];\n _heatmapLayer = [[GMUHeatmapTileLayer alloc] init];\n _heatmapLayer.map = _mapView;\n }\n\n // ...\n\n - (void) addHeatmap {\n\n // Get the data: latitude/longitude positions of police stations.\n NSURL *path = [NSBundle.mainBundle URLForResource:@\"police_stations\" withExtension:@\"json\"];\n NSData *data = [NSData dataWithContentsOfURL:path];\n NSArray *json = [NSJSONSerialization JSONObjectWithData:data options:0 error:nil];\n\n NSMutableArray\u003cGMUWeightedLatLng *\u003e *list = [[NSMutableArray alloc] init];\n [json enumerateObjectsUsingBlock:^(id _Nonnull obj, NSUInteger idx, BOOL * _Nonnull stop) {\n NSDictionary *item = (NSDictionary *)obj;\n CLLocationDegrees lat = [(NSNumber *) [item valueForKey:@\"lat\"] doubleValue];\n CLLocationDegrees lng = [(NSNumber *) [item valueForKey:@\"lng\"] doubleValue];\n GMUWeightedLatLng *coords = [[GMUWeightedLatLng alloc] initWithCoordinate:CLLocationCoordinate2DMake(lat, lng)\n intensity:1.0];\n [list addObject:coords];\n }];\n\n\n // Add the latlngs to the heatmap layer.\n _heatmapLayer.weightedData = list;\n }\n @end\n \n ```\n\nFor this example, the data is stored in a JSON file, `police_stations.json`.\nHere is an extract from the file: \n\n [\n {\"lat\" : -37.1886, \"lng\" : 145.708 } ,\n {\"lat\" : -37.8361, \"lng\" : 144.845 } ,\n {\"lat\" : -38.4034, \"lng\" : 144.192 } ,\n {\"lat\" : -38.7597, \"lng\" : 143.67 } ,\n {\"lat\" : -36.9672, \"lng\" : 141.083 }\n ]\n\nCustomizing the heatmap\n\nThe heatmap has several customizable properties. You can set the options when\ninitially creating the `GMUHeatmapTileLayer` instance, or at any time by\nsetting a new value for the option.\n\nThe following options are available:\n\n1. **Radius:** The size of the Gaussian blur applied to the heatmap, expressed\n in pixels. The default is 20. Must be between 10 and 50. Use\n `GMUHeatmapTileLayer.radius` to set the radius.\n\n2. **Gradient:** A range of colors that the heatmap uses to generate its color\n map, ranging from lowest to highest intensity. A `GMUGradient` is created using\n an integer array containing the colors, and a float array indicating the\n starting point for each color, given as a percentage of the maximum intensity,\n and expressed as a fraction from 0 to 1. You need to specify only one color for\n a single-colored gradient, or a minimum of two colors for a multi-colored\n gradient. The color map is generated using interpolation between those colors.\n The default gradient has two colors. The `colorMapSize` parameter defines the\n number of steps in the gradient. Larger numbers will result in a smoother\n gradient, while smaller numbers will give sharper transitions similar to a\n contour graph. Use `GMUHeatmapTileLayer.gradient` to set the gradient.\n\n3. **Opacity:** This is the opacity of the entire heatmap layer, and ranges\n from 0 to 1. The default is 0.7. Use `GMUHeatmapTileLayer.opacity` to set the\n opacity value.\n\nFor example, create a `Gradient`:\n\n\nSwift \n\n```swift\nlet gradientColors: [UIColor] = [.green, .red]\nlet gradientStartPoints: [NSNumber] = [0.2, 1.0]\nheatmapLayer.gradient = GMUGradient(\n colors: gradientColors,\n startPoints: gradientStartPoints,\n colorMapSize: 256\n)\n \n```\n\nObjective-C \n\n```objective-c\nNSArray\u003cUIColor *\u003e *gradientColors = @[UIColor.greenColor, UIColor.redColor];\nNSArray\u003cNSNumber *\u003e *gradientStartPoints = @[@0.2, @1.0];\n_heatmapLayer.gradient = [[GMUGradient alloc] initWithColors:gradientColors\n startPoints:gradientStartPoints\n colorMapSize:256];\n \n```\n\n\u003cbr /\u003e\n\nTo change the opacity of an existing heatmap:\n\n\nSwift \n\n```swift\nheatmapLayer.opacity = 0.7\n \n```\n\nObjective-C \n\n```objective-c\n_heatmapLayer.opacity = 0.7;\n \n```\n\n\u003cbr /\u003e\n\nUpdate an existing option\n\nTo update an option that has already been set, take these steps:\n\n1. Update the option to the desired value.\n2. Call `GMUHeatmapTileLayer.clearTileCache()`.\n\nChanging the dataset\n\nTo change the dataset upon which a heatmap is built:\n\n1. Update your data collection. Use `GMUHeatmapTileLayer.weightedData`, passing an array of `GMUWeightedLatLng`.\n2. Call `GMUHeatmapTileLayer.clearTileCache()`.\n\n| **Note:** if you want to add points to the heatmap, or remove points from the heatmap, first update your data collection and then use `GMUHeatmapTileLayer.weightedData`.\n\nRemoving a heatmap\n\nTo remove a heatmap, call `GMUHeatmapTileLayer.map`, passing `nil`.\n\n\nSwift \n\n```swift\nheatmapLayer.map = nil\n \n```\n\nObjective-C \n\n```objective-c\n_heatmapLayer.map = nil;\n \n```\n\n\u003cbr /\u003e\n\nSee the demo app\n\nFor another example of a heatmap implementation, take a look at the\n`HeatmapViewController` in the demo app that ships with the utility library.\nThe [setup guide](/maps/documentation/ios-sdk/utility/setup) shows you how to\nrun the demo app."]]