
Page Summary
-
Heatmaps visualize the density of data points on a map using color, with higher intensity representing greater concentration.
-
The Maps SDK for Android Utility Library provides tools for adding and customizing heatmaps.
-
You can create heatmaps from simple latitude/longitude data or weighted data for varying importance.
-
Heatmap properties like radius, gradient, and opacity can be customized to fit your data and visual needs.
-
You can easily update the data or remove the heatmap overlay dynamically as needed.
Heatmaps are useful for representing the distribution and density of data points on a map.
Introduction
The Maps SDK for Android Utility Library includes a heatmap utility, which you can use to add one or more heatmaps to a Google map in your application.
This video discusses the use of heatmaps as an alternative to markers, when your data requires a large number of data points on the map.
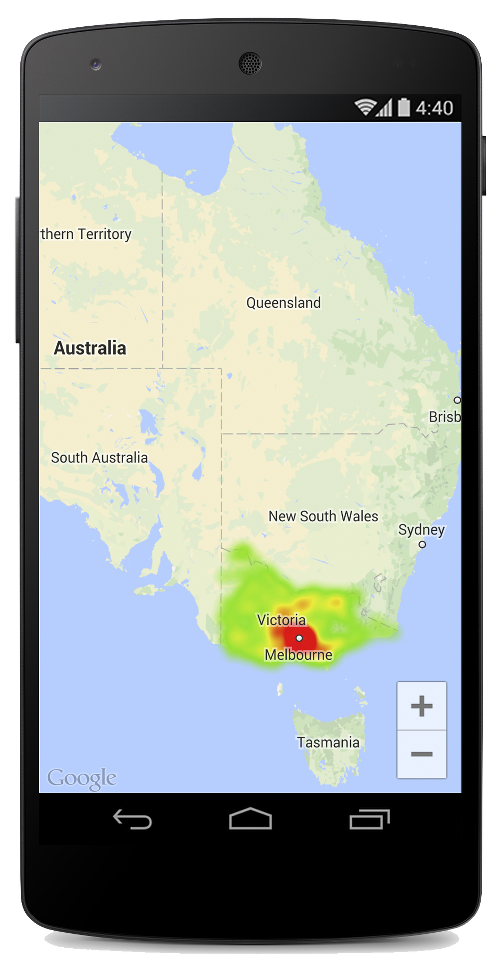
Heatmaps make it easy for viewers to understand the distribution and relative intensity of data points on a map. Rather than placing a marker at each location, heatmaps use color to represent the distribution of the data.
In the example below, red represents areas of high concentration of police stations in Victoria, Australia.
If you haven't yet set up the Maps SDK for Android Utility library, follow the setup guide before reading the rest of this page.
Add a simple heatmap
To add a heatmap to your map, you will need a dataset consisting of the
coordinates for each location of interest. First create a
HeatmapTileProvider,
passing it the collection of LatLng objects. Then create a new
TileOverlay,
passing it the heatmap tile provider, and add the tile overlay to the map.
The utility supplies the HeatmapTileProvider class, which
implements the
TileProvider
interface to supply the tile images for the heatmap.
HeatmapTileProvider accepts a collection of LatLng
objects (or
WeightedLatLng
objects, as described below). It creates the tile
images for various zoom levels, based on the radius, gradient and opacity
options supplied. You can
change the default values for these options.
Looking at the steps in more detail:
- Use
HeatmapTileProvider.Builder(), passing it a collection ofLatLngobjects, to add a newHeatmapTileProvider. - Create a new
TileOverlayOptionsobject with the relevant options, including theHeatmapTileProvider. - Call
GoogleMap.addTileOverlay()to add the overlay to the map.
Kotlin
private fun addHeatMap() {
    var latLngs: List<LatLng?>? = null

    // Get the data: latitude/longitude positions of police stations.
    try {
        latLngs = readItems(R.raw.police_stations)
    } catch (e: JSONException) {
        Toast.makeText(context, "Problem reading list of locations.", Toast.LENGTH_LONG)
            .show()
    }

    // Create a heat map tile provider, passing it the latlngs of the police stations.
    val provider = HeatmapTileProvider.Builder()
        .data(latLngs?.filterNotNull() ?: emptyList())
        .build()

    // Add a tile overlay to the map, using the heat map tile provider.
    val overlay = map.addTileOverlay(TileOverlayOptions().tileProvider(provider))
}

@Throws(JSONException::class)
private fun readItems(@RawRes resource: Int): List<LatLng?> {
    val result: MutableList<LatLng?> = ArrayList()
    val inputStream = context.resources.openRawResource(resource)
    val json = Scanner(inputStream).useDelimiter("\\A").next()
    val array = JSONArray(json)
    for (i in 0 until array.length()) {
        val `object` = array.getJSONObject(i)
        val lat = `object`.getDouble("lat")
        val lng = `object`.getDouble("lng")
        result.add(LatLng(lat, lng))
    }
    return result
}
Java
private void addHeatMap() {
    List<LatLng> latLngs = new ArrayList<>();

    // Get the data: latitude/longitude positions of police stations.
    try {
        latLngs = readItems(R.raw.police_stations);
    } catch (JSONException e) {
        Toast.makeText(context, "Problem reading list of locations.", Toast.LENGTH_LONG).show();
    }

    // Create a heat map tile provider, passing it the latlngs of the police stations.
    HeatmapTileProvider provider = new HeatmapTileProvider.Builder()
        .data(latLngs)
        .build();

    // Add a tile overlay to the map, using the heat map tile provider.
    TileOverlay overlay = map.addTileOverlay(new TileOverlayOptions().tileProvider(provider));
}

private List<LatLng> readItems(@RawRes int resource) throws JSONException {
    List<LatLng> result = new ArrayList<>();
    InputStream inputStream = context.getResources().openRawResource(resource);
    String json = new Scanner(inputStream).useDelimiter("\\A").next();
    JSONArray array = new JSONArray(json);
    for (int i = 0; i < array.length(); i++) {
        JSONObject object = array.getJSONObject(i);
        double lat = object.getDouble("lat");
        double lng = object.getDouble("lng");
        result.add(new LatLng(lat, lng));
    }
    return result;
}
For this example, the data is stored in a JSON file,
police_stations.json. Here is an extract from the file:
[
{"lat" : -37.1886, "lng" : 145.708 } ,
{"lat" : -37.8361, "lng" : 144.845 } ,
{"lat" : -38.4034, "lng" : 144.192 } ,
{"lat" : -38.7597, "lng" : 143.67 } ,
{"lat" : -36.9672, "lng" : 141.083 }
]
Use weighted latitude/longitude points
When creating a HeatmapTileProvider, you can pass it a
collection of weighted latitude/longitude coordinates. This is useful if you
want to illustrate the importance of a particular set of locations.
To apply weighting to specific locations:
- Create a new
WeightedLatLngfor each location that requires weighting. Pass in theLatLngand adoublerepresenting the intensity required. The intensity indicates the relative importance, or value, of this location. A higher value will result in a higher-intensity color in the heatmap gradient. By default, the highest-intensity color is red. Call
HeatmapTileProvider.Builder().weightedData(), instead ofHeatmapTileProvider.Builder().data(), to create the heatmap.
Customize the heatmap
A number of properties of the heatmap are customizable. You can set the
options at time of creation, via Builder functions.
Alternatively, change an option at any time by calling the relevant setter
on the HeatmapTileProvider, and then clear the overlay's
tile cache so that it redraws all the tiles with the new options.
The following options are available:
- Radius: The size of the Gaussian blur applied to the heatmap,
expressed in pixels. The default is 20. Must be between 10 and 50. Use the
Builder's
radius()to set the value when creating the heatmap, or change the value later withsetRadius(). - Gradient: A range of colors that the heatmap uses to generate its
color map, ranging from lowest to highest intensity. A gradient is created
using two arrays: an integer array containing the colors, and a float array
indicating the starting point for each color, given as a percentage of the
maximum intensity, and expressed as a fraction from 0 to 1. You need to
specify only one color for a single-colored gradient, or a minimum of two
colors for a multi-colored gradient. The color map is generated using
interpolation between those colors. The default gradient has two colors. Use
the Builder's
gradient()to set the value when creating the heatmap, or change the value later withsetGradient(). - Opacity: This is the opacity of the entire heatmap layer, and
ranges from 0 to 1. The default is 0.7. Use the Builder's
opacity()to set the value when creating the heatmap, or change the value later withsetOpacity().
For example, create a
Gradient
to set the gradient before adding the heatmap:
Kotlin
// Create the gradient.
val colors = intArrayOf(
    Color.rgb(102, 225, 0),  // green
    Color.rgb(255, 0, 0) // red
)
val startPoints = floatArrayOf(0.2f, 1f)
val gradient = Gradient(colors, startPoints)

// Create the tile provider.
val provider = HeatmapTileProvider.Builder()
    .data(latLngs)
    .gradient(gradient)
    .build()

// Add the tile overlay to the map.
val tileOverlay = map.addTileOverlay(
    TileOverlayOptions()
        .tileProvider(provider)
)
Java
// Create the gradient.
int[] colors = {
    Color.rgb(102, 225, 0), // green
    Color.rgb(255, 0, 0)    // red
};

float[] startPoints = {
    0.2f, 1f
};

Gradient gradient = new Gradient(colors, startPoints);

// Create the tile provider.
HeatmapTileProvider provider = new HeatmapTileProvider.Builder()
    .data(latLngs)
    .gradient(gradient)
    .build();

// Add the tile overlay to the map.
TileOverlay tileOverlay = map.addTileOverlay(new TileOverlayOptions().tileProvider(provider));
To change the opacity of an existing heatmap:
Kotlin
provider.setOpacity(0.7)
tileOverlay?.clearTileCache()
Java
provider.setOpacity(0.7);
tileOverlay.clearTileCache();
Change the dataset
To change the dataset upon which a heatmap is built, use
HeatmapTileProvider.setData(),
or
HeatmapTileProvider.setWeightedData()
for WeightedLatLng points. Note: If you want to add points to
the heatmap, or remove points from the heatmap, update your data collection
and then use setData() or setWeightedData().
Kotlin
val data: List<WeightedLatLng> = ArrayList()
provider.setWeightedData(data)
tileOverlay?.clearTileCache()
Java
List<WeightedLatLng> data = new ArrayList<>();
provider.updateData(data);
tileOverlay.clearTileCache();
Remove a heatmap
To remove the heatmap, you need to remove the tile overlay:
Kotlin
tileOverlay?.remove()
Java
tileOverlay.remove();
See the demo app
For another example of a heatmap implementation, take a look at the
HeatmapsDemoActivity in the demo app that ships
with the utility library. The
setup guide shows you
how to run the demo app.