
এই পৃষ্ঠায় iOS-এর জন্য Maps SDK-এর ইউটিলিটি লাইব্রেরিতে উপলব্ধ হিটম্যাপ ইউটিলিটি সম্পর্কে বর্ণনা করা হয়েছে। একটি মানচিত্রে ডেটা পয়েন্টের বন্টন এবং ঘনত্ব উপস্থাপনের জন্য হিটম্যাপ উপযোগী।
এই ভিডিওতে মার্কারের বিকল্প হিসেবে হিটম্যাপের ব্যবহার নিয়ে আলোচনা করা হয়েছে, বিশেষ করে যখন ম্যাপে আপনার ডেটার জন্য প্রচুর সংখ্যক ডেটা পয়েন্টের প্রয়োজন হয়।
হিটম্যাপের মাধ্যমে দর্শকরা মানচিত্রে থাকা ডেটা পয়েন্টগুলোর বিন্যাস এবং আপেক্ষিক তীব্রতা সহজেই বুঝতে পারেন। প্রতিটি স্থানে মার্কার বসানোর পরিবর্তে, হিটম্যাপ ডেটার বিন্যাস বোঝাতে রঙ ব্যবহার করে।
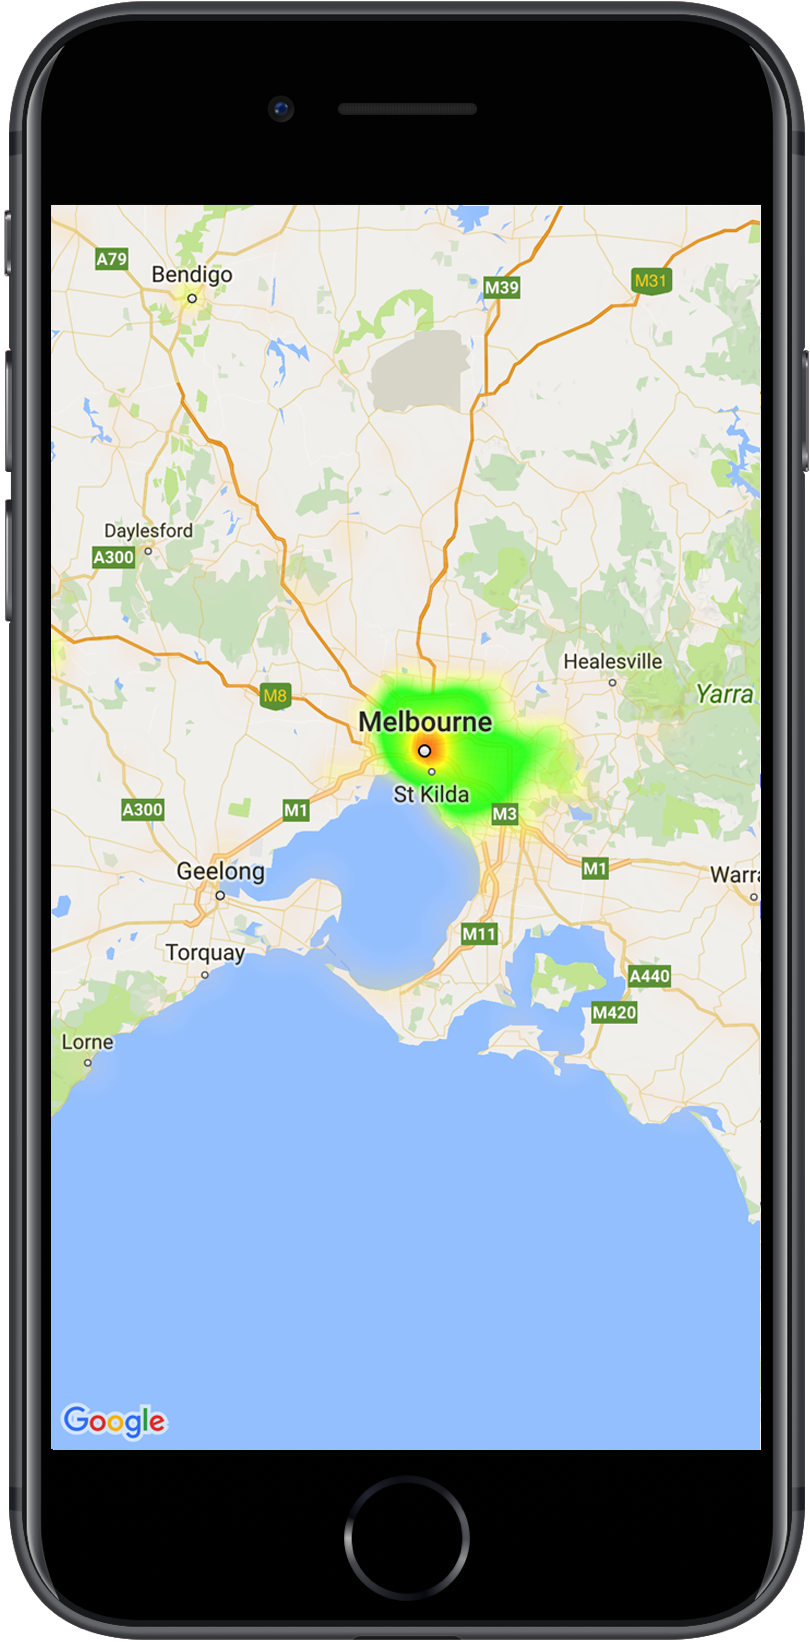
নিচের উদাহরণে, লাল রঙ অস্ট্রেলিয়ার ভিক্টোরিয়া রাজ্যের সেইসব এলাকাকে নির্দেশ করে যেখানে থানাগুলোর ঘনত্ব বেশি।
আপনি যদি এখনও লাইব্রেরিটি সেট আপ না করে থাকেন, তাহলে এই পৃষ্ঠার বাকি অংশ পড়ার আগে সেট আপ গাইডটি অনুসরণ করুন।
একটি সাধারণ হিটম্যাপ যোগ করা
আপনার ম্যাপে একটি হিটম্যাপ যোগ করতে, আপনার প্রতিটি কাঙ্ক্ষিত স্থানের স্থানাঙ্ক সম্বলিত একটি ডেটাসেট প্রয়োজন হবে। প্রথমে, একটি GMUHeatmapTileLayer ইনস্ট্যান্স তৈরি করুন এবং এর ' map ' প্রপার্টিকে একটি GMSMapView তে সেট করুন। হিটম্যাপ নিয়ে কাজ করার আগে বেস ম্যাপটি লোড হয়েছে কিনা তা নিশ্চিত করতে, আপনার অ্যাপের ' viewDidLoad() ফাংশনে এটি করুন। এরপর, GMUHeatmapTileLayer ইনস্ট্যান্সটিতে GMUWeightedLatLng অবজেক্টগুলোর একটি কালেকশন পাস করুন।
এই ইউটিলিটিটি GMUHeatmapTileLayer ক্লাসটি সরবরাহ করে, যা GMUWeightedLatLng অবজেক্টের একটি সংগ্রহ গ্রহণ করে। এটি প্রদত্ত ব্যাসার্ধ, গ্রেডিয়েন্ট এবং অস্বচ্ছতা বিকল্পগুলির উপর ভিত্তি করে বিভিন্ন জুম স্তরের জন্য টাইল চিত্র তৈরি করে।
ধাপগুলো আরও বিস্তারিতভাবে দেখলে:
- একটি
GMUHeatmapTileLayerইনস্ট্যান্স তৈরি করুন এবং এরmapপ্রপার্টিটিGMSMapViewতে সেট করুন (এটি আপনার অ্যাপেরviewDidLoad()ফাংশনে করুন)। -
GMUHeatmapTileLayerইনস্ট্যান্সটিতেGMUWeightedLatLngঅবজেক্টগুলোর একটি সংগ্রহ প্রেরণ করুন। - ম্যাপ ভিউটি পাস করে
GMUHeatmapTileLayer.mapকে কল করুন।সুইফট
class Heatmap: UIViewController {

  private var mapView: GMSMapView!
  private var heatmapLayer: GMUHeatmapTileLayer!

  override func viewDidLoad() {
    super.viewDidLoad()
    heatmapLayer = GMUHeatmapTileLayer()
    heatmapLayer.map = mapView
  }

  // ...

  func addHeatmap() {

    // Get the data: latitude/longitude positions of police stations.
    guard let path = Bundle.main.url(forResource: "police_stations", withExtension: "json") else {
      return
    }
    guard let data = try? Data(contentsOf: path) else {
      return
    }
    guard let json = try? JSONSerialization.jsonObject(with: data, options: []) else {
      return
    }
    guard let object = json as? [[String: Any]] else {
      print("Could not read the JSON.")
      return
    }

    var list = [GMUWeightedLatLng]()
    for item in object {
      let lat = item["lat"] as! CLLocationDegrees
      let lng = item["lng"] as! CLLocationDegrees
      let coords = GMUWeightedLatLng(
        coordinate: CLLocationCoordinate2DMake(lat, lng),
        intensity: 1.0
      )
      list.append(coords)
    }

    // Add the latlngs to the heatmap layer.
    heatmapLayer.weightedData = list
  }
}
উদ্দেশ্য-সি
@implementation Heatmap {
  GMSMapView *_mapView;
  GMUHeatmapTileLayer *_heatmapLayer;
}

- (void)viewDidLoad {
  [super viewDidLoad];
  _heatmapLayer = [[GMUHeatmapTileLayer alloc] init];
  _heatmapLayer.map = _mapView;
}

// ...

- (void) addHeatmap {

  // Get the data: latitude/longitude positions of police stations.
  NSURL *path = [NSBundle.mainBundle URLForResource:@"police_stations" withExtension:@"json"];
  NSData *data = [NSData dataWithContentsOfURL:path];
  NSArray *json = [NSJSONSerialization JSONObjectWithData:data options:0 error:nil];

  NSMutableArray<GMUWeightedLatLng *> *list = [[NSMutableArray alloc] init];
  [json enumerateObjectsUsingBlock:^(id  _Nonnull obj, NSUInteger idx, BOOL * _Nonnull stop) {
    NSDictionary *item = (NSDictionary *)obj;
    CLLocationDegrees lat = [(NSNumber *) [item valueForKey:@"lat"] doubleValue];
    CLLocationDegrees lng = [(NSNumber *) [item valueForKey:@"lng"] doubleValue];
    GMUWeightedLatLng *coords = [[GMUWeightedLatLng alloc] initWithCoordinate:CLLocationCoordinate2DMake(lat, lng)
                                                                    intensity:1.0];
    [list addObject:coords];
  }];


  // Add the latlngs to the heatmap layer.
  _heatmapLayer.weightedData = list;
}
@end
এই উদাহরণটির জন্য, ডেটা police_stations.json নামের একটি JSON ফাইলে সংরক্ষিত আছে। ফাইলটি থেকে একটি অংশ নিচে দেওয়া হলো:
[
{"lat" : -37.1886, "lng" : 145.708 } ,
{"lat" : -37.8361, "lng" : 144.845 } ,
{"lat" : -38.4034, "lng" : 144.192 } ,
{"lat" : -38.7597, "lng" : 143.67 } ,
{"lat" : -36.9672, "lng" : 141.083 }
]
হিটম্যাপ কাস্টমাইজ করা
হিটম্যাপের বেশ কিছু কাস্টমাইজযোগ্য প্রোপার্টি রয়েছে। আপনি GMUHeatmapTileLayer ইনস্ট্যান্সটি প্রথমবার তৈরি করার সময়, অথবা যেকোনো সময়ে অপশনটির জন্য একটি নতুন মান নির্ধারণ করে এই অপশনগুলো সেট করতে পারেন।
নিম্নলিখিত বিকল্পগুলি উপলব্ধ আছে:
ব্যাসার্ধ: হিটম্যাপে প্রয়োগ করা গাউসিয়ান ব্লারের আকার, যা পিক্সেলে প্রকাশ করা হয়। ডিফল্ট মান হলো ২০। এটি অবশ্যই ১০ থেকে ৫০-এর মধ্যে হতে হবে। ব্যাসার্ধ সেট করতে
GMUHeatmapTileLayer.radiusব্যবহার করুন।গ্রেডিয়েন্ট: রঙের একটি পরিসর যা হিটম্যাপ তার কালার ম্যাপ তৈরি করতে ব্যবহার করে, যার তীব্রতা সর্বনিম্ন থেকে সর্বোচ্চ পর্যন্ত বিস্তৃত। একটি
GMUGradientতৈরি করা হয় রঙগুলো ধারণকারী একটি ইন্টিজার অ্যারে এবং প্রতিটি রঙের শুরুর বিন্দু নির্দেশকারী একটি ফ্লোট অ্যারে ব্যবহার করে। এই শুরুর বিন্দুটি সর্বোচ্চ তীব্রতার শতাংশ হিসাবে দেওয়া হয় এবং ০ থেকে ১ পর্যন্ত একটি ভগ্নাংশ হিসাবে প্রকাশ করা হয়। একরঙা গ্রেডিয়েন্টের জন্য আপনাকে কেবল একটি রঙ নির্দিষ্ট করতে হবে, অথবা বহুরঙা গ্রেডিয়েন্টের জন্য ন্যূনতম দুটি রঙ নির্দিষ্ট করতে হবে। এই রঙগুলোর মধ্যে ইন্টারপোলেশন ব্যবহার করে কালার ম্যাপটি তৈরি করা হয়। ডিফল্ট গ্রেডিয়েন্টে দুটি রঙ থাকে।colorMapSizeপ্যারামিটারটি গ্রেডিয়েন্টের ধাপের সংখ্যা নির্ধারণ করে। বড় সংখ্যা একটি মসৃণ গ্রেডিয়েন্ট তৈরি করবে, যেখানে ছোট সংখ্যা একটি কন্ট্যুর গ্রাফের মতো তীক্ষ্ণ পরিবর্তন দেবে। গ্রেডিয়েন্ট সেট করতেGMUHeatmapTileLayer.gradientব্যবহার করুন।অস্বচ্ছতা: এটি সম্পূর্ণ হিটম্যাপ লেয়ারের অস্বচ্ছতা, এবং এর মান ০ থেকে ১ পর্যন্ত হয়ে থাকে। ডিফল্ট মান হলো ০.৭। অস্বচ্ছতার মান নির্ধারণ করতে
GMUHeatmapTileLayer.opacityব্যবহার করুন।
উদাহরণস্বরূপ, একটি Gradient তৈরি করুন:
সুইফট
let gradientColors: [UIColor] = [.green, .red]
let gradientStartPoints: [NSNumber] = [0.2, 1.0]
heatmapLayer.gradient = GMUGradient(
  colors: gradientColors,
  startPoints: gradientStartPoints,
  colorMapSize: 256
)
উদ্দেশ্য-সি
NSArray<UIColor *> *gradientColors = @[UIColor.greenColor, UIColor.redColor];
NSArray<NSNumber *> *gradientStartPoints = @[@0.2, @1.0];
_heatmapLayer.gradient = [[GMUGradient alloc] initWithColors:gradientColors
                                                 startPoints:gradientStartPoints
                                                colorMapSize:256];
বিদ্যমান হিটম্যাপের অস্বচ্ছতা পরিবর্তন করতে:
সুইফট
heatmapLayer.opacity = 0.7
উদ্দেশ্য-সি
_heatmapLayer.opacity = 0.7;
বিদ্যমান বিকল্প আপডেট করুন
ইতিমধ্যে সেট করা কোনো অপশন আপডেট করতে, এই ধাপগুলো অনুসরণ করুন:
- বিকল্পটি কাঙ্ক্ষিত মানে আপডেট করুন।
-
GMUHeatmapTileLayer.clearTileCache()কল করুন।
ডেটাসেট পরিবর্তন করা
যে ডেটাসেটের উপর ভিত্তি করে হিটম্যাপ তৈরি করা হয়েছে তা পরিবর্তন করতে:
- আপনার ডেটা সংগ্রহ আপডেট করুন।
GMUWeightedLatLngএর একটি অ্যারে পাস করেGMUHeatmapTileLayer.weightedDataব্যবহার করুন। -
GMUHeatmapTileLayer.clearTileCache()কল করুন।
একটি হিটম্যাপ সরানো
হিটম্যাপটি অপসারণ করতে, nil পাস করে GMUHeatmapTileLayer.map কল করুন।
সুইফট
heatmapLayer.map = nil
উদ্দেশ্য-সি
_heatmapLayer.map = nil;
ডেমো অ্যাপটি দেখুন
হিটম্যাপ বাস্তবায়নের আরেকটি উদাহরণের জন্য, ইউটিলিটি লাইব্রেরির সাথে আসা ডেমো অ্যাপের HeatmapViewController টি দেখুন। সেটআপ গাইডে দেখানো হয়েছে কীভাবে ডেমো অ্যাপটি চালাতে হয়।