Trang này mô tả tiện ích bản đồ nhiệt có trong thư viện tiện ích cho Maps SDK dành cho iOS.
Bản đồ nhiệt rất hữu ích khi biểu thị sự phân bố và mật độ của các điểm dữ liệu trên bản đồ.
Video này thảo luận về việc sử dụng bản đồ nhiệt thay cho điểm đánh dấu, khi dữ liệu của bạn yêu cầu một số lượng lớn điểm dữ liệu trên bản đồ.
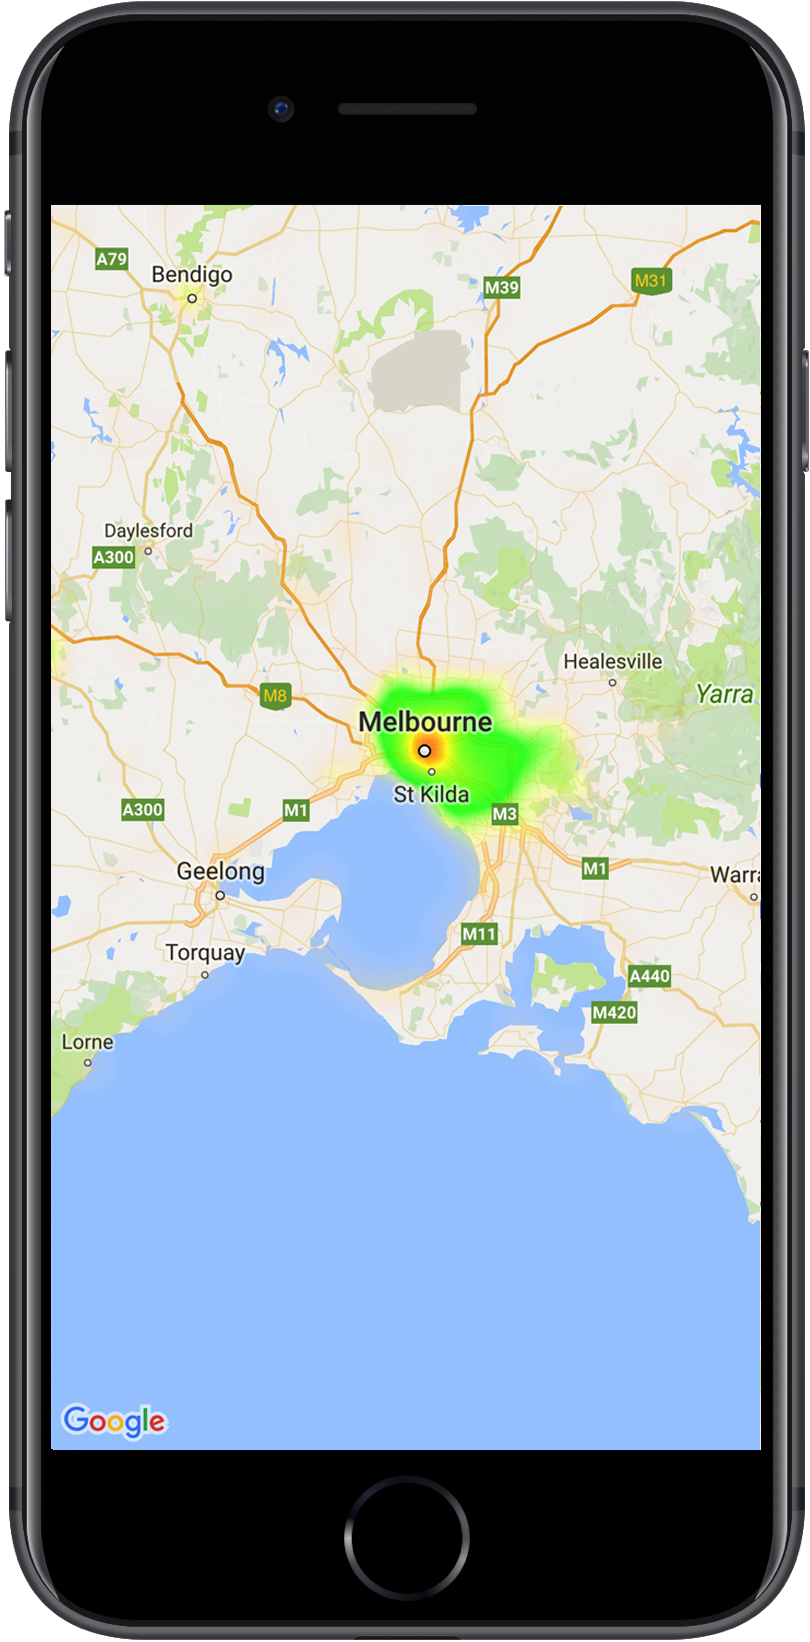
Bản đồ nhiệt giúp người xem dễ dàng hiểu được mức độ phân phối và cường độ tương đối của các điểm dữ liệu trên bản đồ. Thay vì đặt điểm đánh dấu tại mỗi vị trí, bản đồ nhiệt sử dụng màu sắc để biểu thị sự phân phối của dữ liệu.
Trong ví dụ dưới đây, màu đỏ biểu thị những khu vực có mật độ đồn cảnh sát cao ở Victoria, Úc.
Bản đồ nhiệt trên bản đồ
Nếu bạn chưa thiết lập thư viện, hãy làm theo hướng dẫn thiết lập trước khi đọc phần còn lại của trang này.
Thêm một biểu đồ nhiệt đơn giản
Để thêm bản đồ nhiệt vào bản đồ, bạn sẽ cần một tập dữ liệu bao gồm toạ độ cho từng vị trí mà bạn quan tâm. Trước tiên, hãy tạo một thực thể GMUHeatmapTileLayer, đặt thuộc tính map thành GMSMapView.
Hãy thực hiện việc này trong hàm viewDidLoad() của ứng dụng để đảm bảo rằng bản đồ cơ sở được tải trước khi hoạt động với bản đồ nhiệt. Sau đó, hãy truyền một tập hợp các đối tượng GMUWeightedLatLng đến thực thể GMUHeatmapTileLayer.
Tiện ích này cung cấp lớp GMUHeatmapTileLayer, chấp nhận một tập hợp các đối tượng GMUWeightedLatLng. Thao tác này sẽ tạo ra hình ảnh ô cho nhiều mức thu phóng, dựa trên các lựa chọn về bán kính, độ dốc và độ mờ được cung cấp.
Hãy xem xét các bước chi tiết hơn:
Tạo một thực thể GMUHeatmapTileLayer, đặt thuộc tính map thành GMSMapView (thực hiện việc này trong hàm viewDidLoad() của ứng dụng).
Truyền một tập hợp các đối tượng GMUWeightedLatLng đến thực thể GMUHeatmapTileLayer.
Gọi GMUHeatmapTileLayer.map, truyền chế độ xem bản đồ.
Swift
classHeatmap:UIViewController{privatevarmapView:GMSMapView!privatevarheatmapLayer:GMUHeatmapTileLayer!overridefuncviewDidLoad(){super.viewDidLoad()heatmapLayer=GMUHeatmapTileLayer()heatmapLayer.map=mapView}// ...funcaddHeatmap(){// Get the data: latitude/longitude positions of police stations.guardletpath=Bundle.main.url(forResource:"police_stations",withExtension:"json")else{return}guardletdata=try?Data(contentsOf:path)else{return}guardletjson=try?JSONSerialization.jsonObject(with:data,options:[])else{return}guardletobject=jsonas?[[String:Any]]else{print("Could not read the JSON.")return}varlist=[GMUWeightedLatLng]()foriteminobject{letlat=item["lat"]as!CLLocationDegreesletlng=item["lng"]as!CLLocationDegreesletcoords=GMUWeightedLatLng(coordinate:CLLocationCoordinate2DMake(lat,lng),intensity:1.0)list.append(coords)}// Add the latlngs to the heatmap layer.heatmapLayer.weightedData=list}}
Objective-C
@implementationHeatmap{GMSMapView*_mapView;GMUHeatmapTileLayer*_heatmapLayer;}-(void)viewDidLoad{[superviewDidLoad];_heatmapLayer=[[GMUHeatmapTileLayeralloc]init];_heatmapLayer.map=_mapView;}// ...-(void)addHeatmap{// Get the data: latitude/longitude positions of police stations.NSURL*path=[NSBundle.mainBundleURLForResource:@"police_stations"withExtension:@"json"];NSData*data=[NSDatadataWithContentsOfURL:path];NSArray*json=[NSJSONSerializationJSONObjectWithData:dataoptions:0error:nil];NSMutableArray<GMUWeightedLatLng*>*list=[[NSMutableArrayalloc]init];[jsonenumerateObjectsUsingBlock:^(id_Nonnullobj,NSUIntegeridx,BOOL*_Nonnullstop){NSDictionary*item=(NSDictionary*)obj;CLLocationDegreeslat=[(NSNumber*)[itemvalueForKey:@"lat"]doubleValue];CLLocationDegreeslng=[(NSNumber*)[itemvalueForKey:@"lng"]doubleValue];GMUWeightedLatLng*coords=[[GMUWeightedLatLngalloc]initWithCoordinate:CLLocationCoordinate2DMake(lat,lng)intensity:1.0];[listaddObject:coords];}];// Add the latlngs to the heatmap layer._heatmapLayer.weightedData=list;}@end
Trong ví dụ này, dữ liệu được lưu trữ trong một tệp JSON, police_stations.json.
Sau đây là một đoạn trích từ tệp:
Bản đồ nhiệt có một số thuộc tính có thể tuỳ chỉnh. Bạn có thể đặt các lựa chọn khi tạo phiên bản GMUHeatmapTileLayer ban đầu hoặc bất cứ lúc nào bằng cách đặt một giá trị mới cho lựa chọn.
Bạn có các tuỳ chọn sau đây:
Bán kính: Kích thước của hiệu ứng làm mờ Gaussian được áp dụng cho bản đồ nhiệt, được biểu thị bằng pixel. Giá trị mặc định là 20. Phải nằm trong khoảng từ 10 đến 50. Dùng GMUHeatmapTileLayer.radius để đặt bán kính.
Chuyển màu: Một dải màu mà bản đồ nhiệt sử dụng để tạo bản đồ màu, từ cường độ thấp nhất đến cao nhất. GMUGradient được tạo bằng một mảng số nguyên chứa các màu và một mảng số thực cho biết điểm bắt đầu của từng màu, được biểu thị bằng tỷ lệ phần trăm của cường độ tối đa và được biểu thị dưới dạng một phân số từ 0 đến 1. Bạn chỉ cần chỉ định một màu cho một độ dốc đơn sắc hoặc tối thiểu hai màu cho độ dốc đa sắc. Bản đồ màu được tạo bằng cách sử dụng phép nội suy giữa các màu đó.
Độ dốc mặc định có 2 màu. Tham số colorMapSize xác định số bước trong chuyển màu. Số càng lớn thì độ dốc càng mượt mà, còn số càng nhỏ thì chuyển đổi càng sắc nét, tương tự như biểu đồ đường viền. Dùng GMUHeatmapTileLayer.gradient để đặt hiệu ứng chuyển màu.
Độ mờ: Đây là độ mờ của toàn bộ lớp bản đồ nhiệt, có phạm vi từ 0 đến 1. Giá trị mặc định là 0,7. Sử dụng GMUHeatmapTileLayer.opacity để đặt giá trị độ mờ.
Để cập nhật một lựa chọn đã được đặt, hãy làm theo các bước sau:
Cập nhật lựa chọn thành giá trị mong muốn.
Gọi cho GMUHeatmapTileLayer.clearTileCache().
Thay đổi tập dữ liệu
Cách thay đổi tập dữ liệu mà biểu đồ nhiệt được tạo dựa trên:
Cập nhật việc thu thập dữ liệu. Sử dụng GMUHeatmapTileLayer.weightedData, truyền một mảng GMUWeightedLatLng.
Gọi cho GMUHeatmapTileLayer.clearTileCache().
Xoá biểu đồ nhiệt
Để xoá bản đồ nhiệt, hãy gọi GMUHeatmapTileLayer.map, truyền nil.
Swift
heatmapLayer.map=nil
Objective-C
_heatmapLayer.map=nil;
Xem ứng dụng minh hoạ
Để xem một ví dụ khác về cách triển khai bản đồ nhiệt, hãy xem HeatmapViewController trong ứng dụng minh hoạ đi kèm với thư viện tiện ích.
Hướng dẫn thiết lập cho bạn biết cách chạy ứng dụng minh hoạ.
[[["Dễ hiểu","easyToUnderstand","thumb-up"],["Giúp tôi giải quyết được vấn đề","solvedMyProblem","thumb-up"],["Khác","otherUp","thumb-up"]],[["Thiếu thông tin tôi cần","missingTheInformationINeed","thumb-down"],["Quá phức tạp/quá nhiều bước","tooComplicatedTooManySteps","thumb-down"],["Đã lỗi thời","outOfDate","thumb-down"],["Vấn đề về bản dịch","translationIssue","thumb-down"],["Vấn đề về mẫu/mã","samplesCodeIssue","thumb-down"],["Khác","otherDown","thumb-down"]],["Cập nhật lần gần đây nhất: 2025-09-05 UTC."],[[["\u003cp\u003eHeatmaps visualize the density of data points on a map using color, offering an alternative to markers for large datasets.\u003c/p\u003e\n"],["\u003cp\u003eThe \u003ccode\u003eGMUHeatmapTileLayer\u003c/code\u003e class is used to create heatmaps, accepting \u003ccode\u003eGMUWeightedLatLng\u003c/code\u003e objects for data points.\u003c/p\u003e\n"],["\u003cp\u003eHeatmaps can be customized by adjusting properties like radius, gradient, and opacity using the \u003ccode\u003eGMUHeatmapTileLayer\u003c/code\u003e instance.\u003c/p\u003e\n"],["\u003cp\u003eTo update the heatmap's data or options, modify the relevant properties and then call \u003ccode\u003eclearTileCache()\u003c/code\u003e to refresh the display.\u003c/p\u003e\n"],["\u003cp\u003eHeatmaps can be removed from the map by setting the \u003ccode\u003emap\u003c/code\u003e property of the \u003ccode\u003eGMUHeatmapTileLayer\u003c/code\u003e to \u003ccode\u003enil\u003c/code\u003e.\u003c/p\u003e\n"]]],["Heatmaps display data density on maps using color, offering an alternative to markers. To add one, create a `GMUHeatmapTileLayer` instance, setting its `map` property to `GMSMapView`. Then, supply `GMUWeightedLatLng` objects representing data coordinates to this instance and call `GMUHeatmapTileLayer.map`. Customize heatmaps by adjusting `radius`, `gradient`, and `opacity` properties. To modify data or settings, update values and call `GMUHeatmapTileLayer.clearTileCache()`. To remove the heatmap, set the `map` property to `nil`.\n"],null,["Select platform: [Android](/maps/documentation/android-sdk/utility/heatmap \"View this page for the Android platform docs.\") [iOS](/maps/documentation/ios-sdk/utility/heatmap \"View this page for the iOS platform docs.\") [JavaScript](/maps/documentation/javascript/heatmaplayer \"View this page for the JavaScript platform docs.\")\n\n\u003cbr /\u003e\n\nThis page describes the heatmap utility that's available in the [utility\nlibrary for the\nMaps SDK for iOS](https://github.com/googlemaps/google-maps-ios-utils).\nHeatmaps are useful for representing the distribution and\ndensity of data points on a map.\n\nThis video discusses the use of heatmaps as an alternative to markers, when\nyour data requires a large number of data points on the map. \n\nHeatmaps make it easy for viewers to understand the distribution and relative\nintensity of data points on a map. Rather than placing a marker at each\nlocation, heatmaps use color to represent the distribution of the data.\n\nIn the example below, red represents areas of high concentration of police\nstations in Victoria, Australia.\nA heatmap on a map **Note:** You can set your own colors for the heatmap, using the `gradient` property. See how to [customize](#customize) colors and other properties of your heatmap.\n\nIf you haven't yet set up the library, follow the [setup\nguide](/maps/documentation/ios-sdk/utility/setup) before reading the rest of\nthis page.\n\nAdding a simple heatmap\n\nTo add a heatmap to your map, you will need a dataset consisting of the\ncoordinates for each location of interest. First, create a\n`GMUHeatmapTileLayer` instance, setting the `map` property to a `GMSMapView`.\nDo this in your app's `viewDidLoad()` function, to ensure that the base map is\nloaded before working with the heatmap. Then pass a collection of\n`GMUWeightedLatLng` objects to the `GMUHeatmapTileLayer` instance.\n\nThe utility supplies the `GMUHeatmapTileLayer` class, which accepts a\ncollection of `GMUWeightedLatLng` objects. It creates the tile images for\nvarious zoom levels, based on the radius, gradient and opacity options\nsupplied.\n\nLooking at the steps in more detail:\n\n1. Create a `GMUHeatmapTileLayer` instance, setting the `map` property to a `GMSMapView` (do this in your app's `viewDidLoad()` function).\n2. Pass a collection of `GMUWeightedLatLng` objects to the `GMUHeatmapTileLayer` instance.\n3. Call `GMUHeatmapTileLayer.map`, passing the map view. \n\n Swift \n\n ```swift\n class Heatmap: UIViewController {\n\n private var mapView: GMSMapView!\n private var heatmapLayer: GMUHeatmapTileLayer!\n\n override func viewDidLoad() {\n super.viewDidLoad()\n heatmapLayer = GMUHeatmapTileLayer()\n heatmapLayer.map = mapView\n }\n\n // ...\n\n func addHeatmap() {\n\n // Get the data: latitude/longitude positions of police stations.\n guard let path = Bundle.main.url(forResource: \"police_stations\", withExtension: \"json\") else {\n return\n }\n guard let data = try? Data(contentsOf: path) else {\n return\n }\n guard let json = try? JSONSerialization.jsonObject(with: data, options: []) else {\n return\n }\n guard let object = json as? [[String: Any]] else {\n print(\"Could not read the JSON.\")\n return\n }\n\n var list = [GMUWeightedLatLng]()\n for item in object {\n let lat = item[\"lat\"] as! CLLocationDegrees\n let lng = item[\"lng\"] as! CLLocationDegrees\n let coords = GMUWeightedLatLng(\n coordinate: CLLocationCoordinate2DMake(lat, lng),\n intensity: 1.0\n )\n list.append(coords)\n }\n\n // Add the latlngs to the heatmap layer.\n heatmapLayer.weightedData = list\n }\n }\n \n ```\n\n Objective-C \n\n ```objective-c\n @implementation Heatmap {\n GMSMapView *_mapView;\n GMUHeatmapTileLayer *_heatmapLayer;\n }\n\n - (void)viewDidLoad {\n [super viewDidLoad];\n _heatmapLayer = [[GMUHeatmapTileLayer alloc] init];\n _heatmapLayer.map = _mapView;\n }\n\n // ...\n\n - (void) addHeatmap {\n\n // Get the data: latitude/longitude positions of police stations.\n NSURL *path = [NSBundle.mainBundle URLForResource:@\"police_stations\" withExtension:@\"json\"];\n NSData *data = [NSData dataWithContentsOfURL:path];\n NSArray *json = [NSJSONSerialization JSONObjectWithData:data options:0 error:nil];\n\n NSMutableArray\u003cGMUWeightedLatLng *\u003e *list = [[NSMutableArray alloc] init];\n [json enumerateObjectsUsingBlock:^(id _Nonnull obj, NSUInteger idx, BOOL * _Nonnull stop) {\n NSDictionary *item = (NSDictionary *)obj;\n CLLocationDegrees lat = [(NSNumber *) [item valueForKey:@\"lat\"] doubleValue];\n CLLocationDegrees lng = [(NSNumber *) [item valueForKey:@\"lng\"] doubleValue];\n GMUWeightedLatLng *coords = [[GMUWeightedLatLng alloc] initWithCoordinate:CLLocationCoordinate2DMake(lat, lng)\n intensity:1.0];\n [list addObject:coords];\n }];\n\n\n // Add the latlngs to the heatmap layer.\n _heatmapLayer.weightedData = list;\n }\n @end\n \n ```\n\nFor this example, the data is stored in a JSON file, `police_stations.json`.\nHere is an extract from the file: \n\n [\n {\"lat\" : -37.1886, \"lng\" : 145.708 } ,\n {\"lat\" : -37.8361, \"lng\" : 144.845 } ,\n {\"lat\" : -38.4034, \"lng\" : 144.192 } ,\n {\"lat\" : -38.7597, \"lng\" : 143.67 } ,\n {\"lat\" : -36.9672, \"lng\" : 141.083 }\n ]\n\nCustomizing the heatmap\n\nThe heatmap has several customizable properties. You can set the options when\ninitially creating the `GMUHeatmapTileLayer` instance, or at any time by\nsetting a new value for the option.\n\nThe following options are available:\n\n1. **Radius:** The size of the Gaussian blur applied to the heatmap, expressed\n in pixels. The default is 20. Must be between 10 and 50. Use\n `GMUHeatmapTileLayer.radius` to set the radius.\n\n2. **Gradient:** A range of colors that the heatmap uses to generate its color\n map, ranging from lowest to highest intensity. A `GMUGradient` is created using\n an integer array containing the colors, and a float array indicating the\n starting point for each color, given as a percentage of the maximum intensity,\n and expressed as a fraction from 0 to 1. You need to specify only one color for\n a single-colored gradient, or a minimum of two colors for a multi-colored\n gradient. The color map is generated using interpolation between those colors.\n The default gradient has two colors. The `colorMapSize` parameter defines the\n number of steps in the gradient. Larger numbers will result in a smoother\n gradient, while smaller numbers will give sharper transitions similar to a\n contour graph. Use `GMUHeatmapTileLayer.gradient` to set the gradient.\n\n3. **Opacity:** This is the opacity of the entire heatmap layer, and ranges\n from 0 to 1. The default is 0.7. Use `GMUHeatmapTileLayer.opacity` to set the\n opacity value.\n\nFor example, create a `Gradient`:\n\n\nSwift \n\n```swift\nlet gradientColors: [UIColor] = [.green, .red]\nlet gradientStartPoints: [NSNumber] = [0.2, 1.0]\nheatmapLayer.gradient = GMUGradient(\n colors: gradientColors,\n startPoints: gradientStartPoints,\n colorMapSize: 256\n)\n \n```\n\nObjective-C \n\n```objective-c\nNSArray\u003cUIColor *\u003e *gradientColors = @[UIColor.greenColor, UIColor.redColor];\nNSArray\u003cNSNumber *\u003e *gradientStartPoints = @[@0.2, @1.0];\n_heatmapLayer.gradient = [[GMUGradient alloc] initWithColors:gradientColors\n startPoints:gradientStartPoints\n colorMapSize:256];\n \n```\n\n\u003cbr /\u003e\n\nTo change the opacity of an existing heatmap:\n\n\nSwift \n\n```swift\nheatmapLayer.opacity = 0.7\n \n```\n\nObjective-C \n\n```objective-c\n_heatmapLayer.opacity = 0.7;\n \n```\n\n\u003cbr /\u003e\n\nUpdate an existing option\n\nTo update an option that has already been set, take these steps:\n\n1. Update the option to the desired value.\n2. Call `GMUHeatmapTileLayer.clearTileCache()`.\n\nChanging the dataset\n\nTo change the dataset upon which a heatmap is built:\n\n1. Update your data collection. Use `GMUHeatmapTileLayer.weightedData`, passing an array of `GMUWeightedLatLng`.\n2. Call `GMUHeatmapTileLayer.clearTileCache()`.\n\n| **Note:** if you want to add points to the heatmap, or remove points from the heatmap, first update your data collection and then use `GMUHeatmapTileLayer.weightedData`.\n\nRemoving a heatmap\n\nTo remove a heatmap, call `GMUHeatmapTileLayer.map`, passing `nil`.\n\n\nSwift \n\n```swift\nheatmapLayer.map = nil\n \n```\n\nObjective-C \n\n```objective-c\n_heatmapLayer.map = nil;\n \n```\n\n\u003cbr /\u003e\n\nSee the demo app\n\nFor another example of a heatmap implementation, take a look at the\n`HeatmapViewController` in the demo app that ships with the utility library.\nThe [setup guide](/maps/documentation/ios-sdk/utility/setup) shows you how to\nrun the demo app."]]