Na tej stronie znajdziesz opis narzędzia do tworzenia mapy cieplnej, które jest dostępne w bibliotece narzędziowej pakietu Maps SDK na iOS.
Mapy termiczne przydają się do przedstawiania rozkładu i gęstości punktów danych na mapie.
Ten film omawia użycie map cieplnych jako alternatywy dla znaczników, gdy dane wymagają dużej liczby punktów danych na mapie.
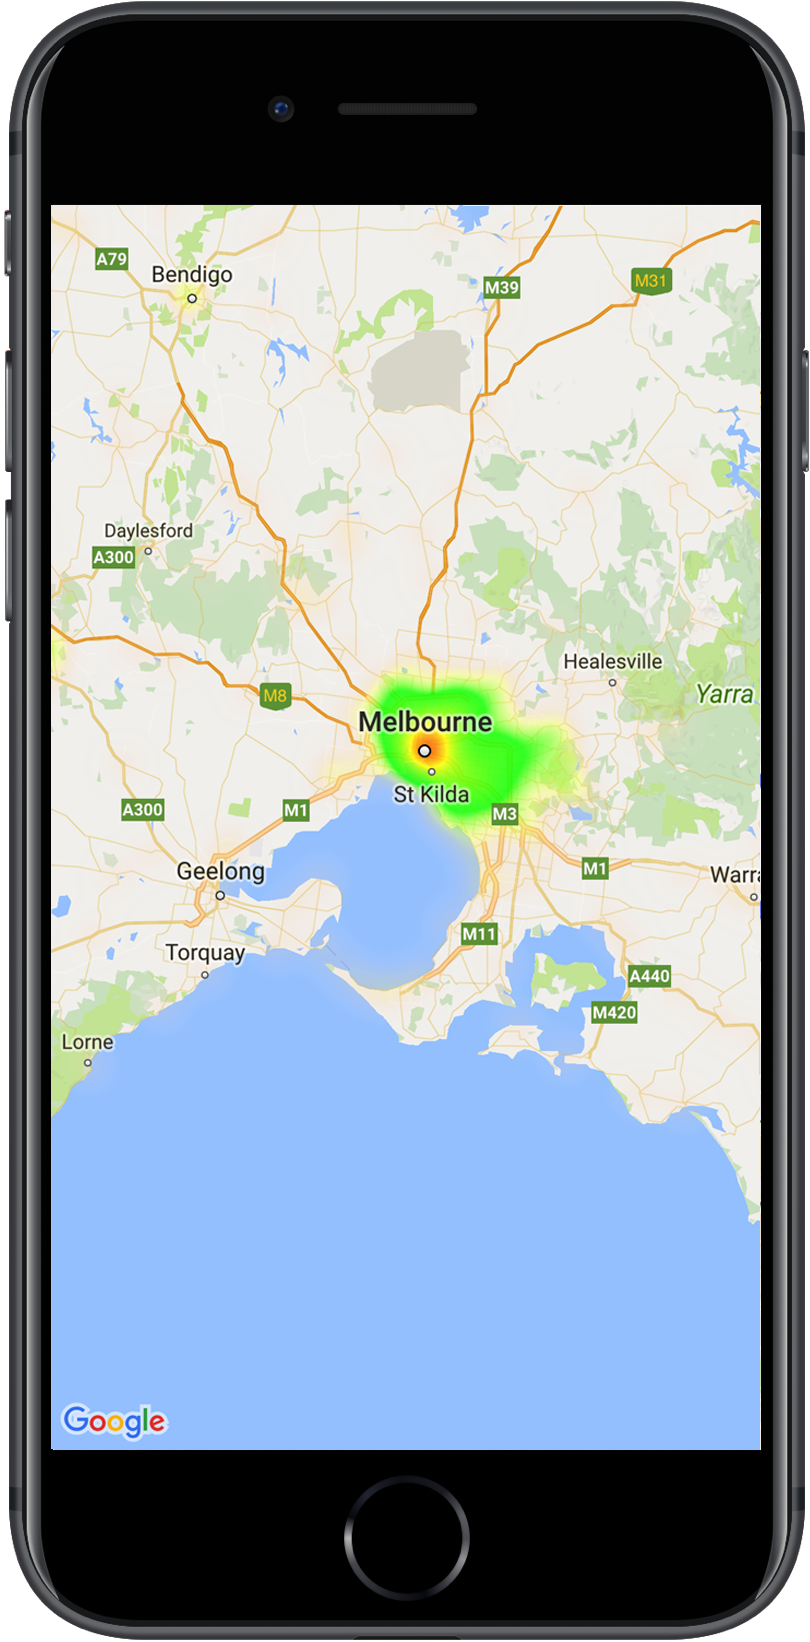
Mapy termiczne ułatwiają widzom zrozumienie rozkładu i względnej intensywności punktów danych na mapie. Zamiast umieszczać znacznik w każdej lokalizacji, mapy cieplne wykorzystują kolor do przedstawiania rozkładu danych.
W przykładzie poniżej czerwony kolor oznacza obszary o wysokim zagęszczeniu komisariatów policji w stanie Wiktoria w Australii.
Mapa termiczna na mapie
Jeśli nie masz jeszcze skonfigurowanej biblioteki, przed przeczytaniem reszty tej strony zapoznaj się z przewodnikiem po konfiguracji.
Dodawanie prostej mapy termicznej
Aby dodać do mapy mapę cieplną, potrzebujesz zbioru danych zawierającego współrzędne każdej interesującej Cię lokalizacji. Najpierw utwórz instancję GMUHeatmapTileLayer, ustawiając właściwość map na GMSMapView.
Zrób to w funkcji viewDidLoad() aplikacji, aby mieć pewność, że mapa bazowa zostanie wczytana przed rozpoczęciem pracy z mapą cieplną. Następnie przekaż kolekcję obiektów GMUWeightedLatLng do instancji GMUHeatmapTileLayer.
Narzędzie udostępnia klasę GMUHeatmapTileLayer, która akceptuje kolekcję obiektów GMUWeightedLatLng. Tworzy obrazy kafelków dla różnych poziomów powiększenia na podstawie podanych opcji promienia, gradientu i krycia.
Przyjrzyjmy się szczegółowo poszczególnym etapom:
Utwórz instancję GMUHeatmapTileLayer, ustawiając właściwość map na wartość GMSMapView (zrób to w funkcji viewDidLoad() aplikacji).
Przekaż kolekcję obiektów GMUWeightedLatLng do instancji GMUHeatmapTileLayer.
Wywołaj funkcję GMUHeatmapTileLayer.map, przekazując widok mapy.
Swift
classHeatmap:UIViewController{privatevarmapView:GMSMapView!privatevarheatmapLayer:GMUHeatmapTileLayer!overridefuncviewDidLoad(){super.viewDidLoad()heatmapLayer=GMUHeatmapTileLayer()heatmapLayer.map=mapView}// ...funcaddHeatmap(){// Get the data: latitude/longitude positions of police stations.guardletpath=Bundle.main.url(forResource:"police_stations",withExtension:"json")else{return}guardletdata=try?Data(contentsOf:path)else{return}guardletjson=try?JSONSerialization.jsonObject(with:data,options:[])else{return}guardletobject=jsonas?[[String:Any]]else{print("Could not read the JSON.")return}varlist=[GMUWeightedLatLng]()foriteminobject{letlat=item["lat"]as!CLLocationDegreesletlng=item["lng"]as!CLLocationDegreesletcoords=GMUWeightedLatLng(coordinate:CLLocationCoordinate2DMake(lat,lng),intensity:1.0)list.append(coords)}// Add the latlngs to the heatmap layer.heatmapLayer.weightedData=list}}
Objective-C
@implementationHeatmap{GMSMapView*_mapView;GMUHeatmapTileLayer*_heatmapLayer;}-(void)viewDidLoad{[superviewDidLoad];_heatmapLayer=[[GMUHeatmapTileLayeralloc]init];_heatmapLayer.map=_mapView;}// ...-(void)addHeatmap{// Get the data: latitude/longitude positions of police stations.NSURL*path=[NSBundle.mainBundleURLForResource:@"police_stations"withExtension:@"json"];NSData*data=[NSDatadataWithContentsOfURL:path];NSArray*json=[NSJSONSerializationJSONObjectWithData:dataoptions:0error:nil];NSMutableArray<GMUWeightedLatLng*>*list=[[NSMutableArrayalloc]init];[jsonenumerateObjectsUsingBlock:^(id_Nonnullobj,NSUIntegeridx,BOOL*_Nonnullstop){NSDictionary*item=(NSDictionary*)obj;CLLocationDegreeslat=[(NSNumber*)[itemvalueForKey:@"lat"]doubleValue];CLLocationDegreeslng=[(NSNumber*)[itemvalueForKey:@"lng"]doubleValue];GMUWeightedLatLng*coords=[[GMUWeightedLatLngalloc]initWithCoordinate:CLLocationCoordinate2DMake(lat,lng)intensity:1.0];[listaddObject:coords];}];// Add the latlngs to the heatmap layer._heatmapLayer.weightedData=list;}@end
W tym przykładzie dane są przechowywane w pliku JSON police_stations.json.
Oto fragment pliku:
Mapa cieplna ma kilka właściwości, które można dostosować. Opcje możesz ustawić podczas początkowego tworzenia instancji GMUHeatmapTileLayer lub w dowolnym momencie, ustawiając nową wartość opcji.
Dostępne są te ustawienia:
Promień: rozmiar rozmycia Gaussa zastosowanego do mapy aktywności wyrażony w pikselach. Wartość domyślna to 20. Musi mieścić się w przedziale od 10 do 50. Użyj
GMUHeatmapTileLayer.radius, aby ustawić promień.
Gradient: zakres kolorów, których mapa cieplna używa do generowania mapy kolorów, od najniższej do najwyższej intensywności. GMUGradient jest tworzony za pomocą tablicy liczb całkowitych zawierającej kolory i tablicy liczb zmiennoprzecinkowych wskazującej punkt początkowy każdego koloru, podany jako procent maksymalnej intensywności i wyrażony jako ułamek od 0 do 1. W przypadku gradientu jednokolorowego musisz określić tylko 1 kolor, a w przypadku gradientu wielokolorowego – co najmniej 2 kolory. Mapa kolorów jest generowana przy użyciu interpolacji między tymi kolorami.
Domyślny gradient ma 2 kolory. Parametr colorMapSize określa liczbę kroków w gradiencie. Im większa liczba, tym płynniejszy gradient, a im mniejsza, tym ostrzejsze przejścia, podobne do wykresu konturowego. Aby ustawić gradient, użyj GMUHeatmapTileLayer.gradient.
Przezroczystość: przezroczystość całej warstwy mapy termicznej, która mieści się w zakresie od 0 do 1. Wartość domyślna to 0,7. Użyj GMUHeatmapTileLayer.opacity, aby ustawić wartość przezroczystości.
Zadzwoń do firmy GMUHeatmapTileLayer.clearTileCache().
Usuwanie mapy termicznej
Aby usunąć mapę cieplną, wywołaj funkcję GMUHeatmapTileLayer.map, przekazując wartość nil.
Swift
heatmapLayer.map=nil
Objective-C
_heatmapLayer.map=nil;
Wyświetlanie aplikacji demonstracyjnej
Inny przykład implementacji mapy cieplnej znajdziesz w HeatmapViewController w aplikacji demonstracyjnej dostarczanej z biblioteką narzędzi.
Przewodnik po konfiguracji zawiera instrukcje uruchamiania aplikacji demonstracyjnej.
[[["Łatwo zrozumieć","easyToUnderstand","thumb-up"],["Rozwiązało to mój problem","solvedMyProblem","thumb-up"],["Inne","otherUp","thumb-up"]],[["Brak potrzebnych mi informacji","missingTheInformationINeed","thumb-down"],["Zbyt skomplikowane / zbyt wiele czynności do wykonania","tooComplicatedTooManySteps","thumb-down"],["Nieaktualne treści","outOfDate","thumb-down"],["Problem z tłumaczeniem","translationIssue","thumb-down"],["Problem z przykładami/kodem","samplesCodeIssue","thumb-down"],["Inne","otherDown","thumb-down"]],["Ostatnia aktualizacja: 2025-09-05 UTC."],[[["\u003cp\u003eHeatmaps visualize the density of data points on a map using color, offering an alternative to markers for large datasets.\u003c/p\u003e\n"],["\u003cp\u003eThe \u003ccode\u003eGMUHeatmapTileLayer\u003c/code\u003e class is used to create heatmaps, accepting \u003ccode\u003eGMUWeightedLatLng\u003c/code\u003e objects for data points.\u003c/p\u003e\n"],["\u003cp\u003eHeatmaps can be customized by adjusting properties like radius, gradient, and opacity using the \u003ccode\u003eGMUHeatmapTileLayer\u003c/code\u003e instance.\u003c/p\u003e\n"],["\u003cp\u003eTo update the heatmap's data or options, modify the relevant properties and then call \u003ccode\u003eclearTileCache()\u003c/code\u003e to refresh the display.\u003c/p\u003e\n"],["\u003cp\u003eHeatmaps can be removed from the map by setting the \u003ccode\u003emap\u003c/code\u003e property of the \u003ccode\u003eGMUHeatmapTileLayer\u003c/code\u003e to \u003ccode\u003enil\u003c/code\u003e.\u003c/p\u003e\n"]]],["Heatmaps display data density on maps using color, offering an alternative to markers. To add one, create a `GMUHeatmapTileLayer` instance, setting its `map` property to `GMSMapView`. Then, supply `GMUWeightedLatLng` objects representing data coordinates to this instance and call `GMUHeatmapTileLayer.map`. Customize heatmaps by adjusting `radius`, `gradient`, and `opacity` properties. To modify data or settings, update values and call `GMUHeatmapTileLayer.clearTileCache()`. To remove the heatmap, set the `map` property to `nil`.\n"],null,["Select platform: [Android](/maps/documentation/android-sdk/utility/heatmap \"View this page for the Android platform docs.\") [iOS](/maps/documentation/ios-sdk/utility/heatmap \"View this page for the iOS platform docs.\") [JavaScript](/maps/documentation/javascript/heatmaplayer \"View this page for the JavaScript platform docs.\")\n\n\u003cbr /\u003e\n\nThis page describes the heatmap utility that's available in the [utility\nlibrary for the\nMaps SDK for iOS](https://github.com/googlemaps/google-maps-ios-utils).\nHeatmaps are useful for representing the distribution and\ndensity of data points on a map.\n\nThis video discusses the use of heatmaps as an alternative to markers, when\nyour data requires a large number of data points on the map. \n\nHeatmaps make it easy for viewers to understand the distribution and relative\nintensity of data points on a map. Rather than placing a marker at each\nlocation, heatmaps use color to represent the distribution of the data.\n\nIn the example below, red represents areas of high concentration of police\nstations in Victoria, Australia.\nA heatmap on a map **Note:** You can set your own colors for the heatmap, using the `gradient` property. See how to [customize](#customize) colors and other properties of your heatmap.\n\nIf you haven't yet set up the library, follow the [setup\nguide](/maps/documentation/ios-sdk/utility/setup) before reading the rest of\nthis page.\n\nAdding a simple heatmap\n\nTo add a heatmap to your map, you will need a dataset consisting of the\ncoordinates for each location of interest. First, create a\n`GMUHeatmapTileLayer` instance, setting the `map` property to a `GMSMapView`.\nDo this in your app's `viewDidLoad()` function, to ensure that the base map is\nloaded before working with the heatmap. Then pass a collection of\n`GMUWeightedLatLng` objects to the `GMUHeatmapTileLayer` instance.\n\nThe utility supplies the `GMUHeatmapTileLayer` class, which accepts a\ncollection of `GMUWeightedLatLng` objects. It creates the tile images for\nvarious zoom levels, based on the radius, gradient and opacity options\nsupplied.\n\nLooking at the steps in more detail:\n\n1. Create a `GMUHeatmapTileLayer` instance, setting the `map` property to a `GMSMapView` (do this in your app's `viewDidLoad()` function).\n2. Pass a collection of `GMUWeightedLatLng` objects to the `GMUHeatmapTileLayer` instance.\n3. Call `GMUHeatmapTileLayer.map`, passing the map view. \n\n Swift \n\n ```swift\n class Heatmap: UIViewController {\n\n private var mapView: GMSMapView!\n private var heatmapLayer: GMUHeatmapTileLayer!\n\n override func viewDidLoad() {\n super.viewDidLoad()\n heatmapLayer = GMUHeatmapTileLayer()\n heatmapLayer.map = mapView\n }\n\n // ...\n\n func addHeatmap() {\n\n // Get the data: latitude/longitude positions of police stations.\n guard let path = Bundle.main.url(forResource: \"police_stations\", withExtension: \"json\") else {\n return\n }\n guard let data = try? Data(contentsOf: path) else {\n return\n }\n guard let json = try? JSONSerialization.jsonObject(with: data, options: []) else {\n return\n }\n guard let object = json as? [[String: Any]] else {\n print(\"Could not read the JSON.\")\n return\n }\n\n var list = [GMUWeightedLatLng]()\n for item in object {\n let lat = item[\"lat\"] as! CLLocationDegrees\n let lng = item[\"lng\"] as! CLLocationDegrees\n let coords = GMUWeightedLatLng(\n coordinate: CLLocationCoordinate2DMake(lat, lng),\n intensity: 1.0\n )\n list.append(coords)\n }\n\n // Add the latlngs to the heatmap layer.\n heatmapLayer.weightedData = list\n }\n }\n \n ```\n\n Objective-C \n\n ```objective-c\n @implementation Heatmap {\n GMSMapView *_mapView;\n GMUHeatmapTileLayer *_heatmapLayer;\n }\n\n - (void)viewDidLoad {\n [super viewDidLoad];\n _heatmapLayer = [[GMUHeatmapTileLayer alloc] init];\n _heatmapLayer.map = _mapView;\n }\n\n // ...\n\n - (void) addHeatmap {\n\n // Get the data: latitude/longitude positions of police stations.\n NSURL *path = [NSBundle.mainBundle URLForResource:@\"police_stations\" withExtension:@\"json\"];\n NSData *data = [NSData dataWithContentsOfURL:path];\n NSArray *json = [NSJSONSerialization JSONObjectWithData:data options:0 error:nil];\n\n NSMutableArray\u003cGMUWeightedLatLng *\u003e *list = [[NSMutableArray alloc] init];\n [json enumerateObjectsUsingBlock:^(id _Nonnull obj, NSUInteger idx, BOOL * _Nonnull stop) {\n NSDictionary *item = (NSDictionary *)obj;\n CLLocationDegrees lat = [(NSNumber *) [item valueForKey:@\"lat\"] doubleValue];\n CLLocationDegrees lng = [(NSNumber *) [item valueForKey:@\"lng\"] doubleValue];\n GMUWeightedLatLng *coords = [[GMUWeightedLatLng alloc] initWithCoordinate:CLLocationCoordinate2DMake(lat, lng)\n intensity:1.0];\n [list addObject:coords];\n }];\n\n\n // Add the latlngs to the heatmap layer.\n _heatmapLayer.weightedData = list;\n }\n @end\n \n ```\n\nFor this example, the data is stored in a JSON file, `police_stations.json`.\nHere is an extract from the file: \n\n [\n {\"lat\" : -37.1886, \"lng\" : 145.708 } ,\n {\"lat\" : -37.8361, \"lng\" : 144.845 } ,\n {\"lat\" : -38.4034, \"lng\" : 144.192 } ,\n {\"lat\" : -38.7597, \"lng\" : 143.67 } ,\n {\"lat\" : -36.9672, \"lng\" : 141.083 }\n ]\n\nCustomizing the heatmap\n\nThe heatmap has several customizable properties. You can set the options when\ninitially creating the `GMUHeatmapTileLayer` instance, or at any time by\nsetting a new value for the option.\n\nThe following options are available:\n\n1. **Radius:** The size of the Gaussian blur applied to the heatmap, expressed\n in pixels. The default is 20. Must be between 10 and 50. Use\n `GMUHeatmapTileLayer.radius` to set the radius.\n\n2. **Gradient:** A range of colors that the heatmap uses to generate its color\n map, ranging from lowest to highest intensity. A `GMUGradient` is created using\n an integer array containing the colors, and a float array indicating the\n starting point for each color, given as a percentage of the maximum intensity,\n and expressed as a fraction from 0 to 1. You need to specify only one color for\n a single-colored gradient, or a minimum of two colors for a multi-colored\n gradient. The color map is generated using interpolation between those colors.\n The default gradient has two colors. The `colorMapSize` parameter defines the\n number of steps in the gradient. Larger numbers will result in a smoother\n gradient, while smaller numbers will give sharper transitions similar to a\n contour graph. Use `GMUHeatmapTileLayer.gradient` to set the gradient.\n\n3. **Opacity:** This is the opacity of the entire heatmap layer, and ranges\n from 0 to 1. The default is 0.7. Use `GMUHeatmapTileLayer.opacity` to set the\n opacity value.\n\nFor example, create a `Gradient`:\n\n\nSwift \n\n```swift\nlet gradientColors: [UIColor] = [.green, .red]\nlet gradientStartPoints: [NSNumber] = [0.2, 1.0]\nheatmapLayer.gradient = GMUGradient(\n colors: gradientColors,\n startPoints: gradientStartPoints,\n colorMapSize: 256\n)\n \n```\n\nObjective-C \n\n```objective-c\nNSArray\u003cUIColor *\u003e *gradientColors = @[UIColor.greenColor, UIColor.redColor];\nNSArray\u003cNSNumber *\u003e *gradientStartPoints = @[@0.2, @1.0];\n_heatmapLayer.gradient = [[GMUGradient alloc] initWithColors:gradientColors\n startPoints:gradientStartPoints\n colorMapSize:256];\n \n```\n\n\u003cbr /\u003e\n\nTo change the opacity of an existing heatmap:\n\n\nSwift \n\n```swift\nheatmapLayer.opacity = 0.7\n \n```\n\nObjective-C \n\n```objective-c\n_heatmapLayer.opacity = 0.7;\n \n```\n\n\u003cbr /\u003e\n\nUpdate an existing option\n\nTo update an option that has already been set, take these steps:\n\n1. Update the option to the desired value.\n2. Call `GMUHeatmapTileLayer.clearTileCache()`.\n\nChanging the dataset\n\nTo change the dataset upon which a heatmap is built:\n\n1. Update your data collection. Use `GMUHeatmapTileLayer.weightedData`, passing an array of `GMUWeightedLatLng`.\n2. Call `GMUHeatmapTileLayer.clearTileCache()`.\n\n| **Note:** if you want to add points to the heatmap, or remove points from the heatmap, first update your data collection and then use `GMUHeatmapTileLayer.weightedData`.\n\nRemoving a heatmap\n\nTo remove a heatmap, call `GMUHeatmapTileLayer.map`, passing `nil`.\n\n\nSwift \n\n```swift\nheatmapLayer.map = nil\n \n```\n\nObjective-C \n\n```objective-c\n_heatmapLayer.map = nil;\n \n```\n\n\u003cbr /\u003e\n\nSee the demo app\n\nFor another example of a heatmap implementation, take a look at the\n`HeatmapViewController` in the demo app that ships with the utility library.\nThe [setup guide](/maps/documentation/ios-sdk/utility/setup) shows you how to\nrun the demo app."]]