Halaman ini menjelaskan utilitas peta panas yang tersedia di library utilitas
untuk Maps SDK for iOS.
Peta panas berguna untuk menampilkan distribusi dan kepadatan titik data pada peta.
Video ini membahas penggunaan peta panas sebagai alternatif pananda jika data Anda memerlukan banyak titik data pada peta.
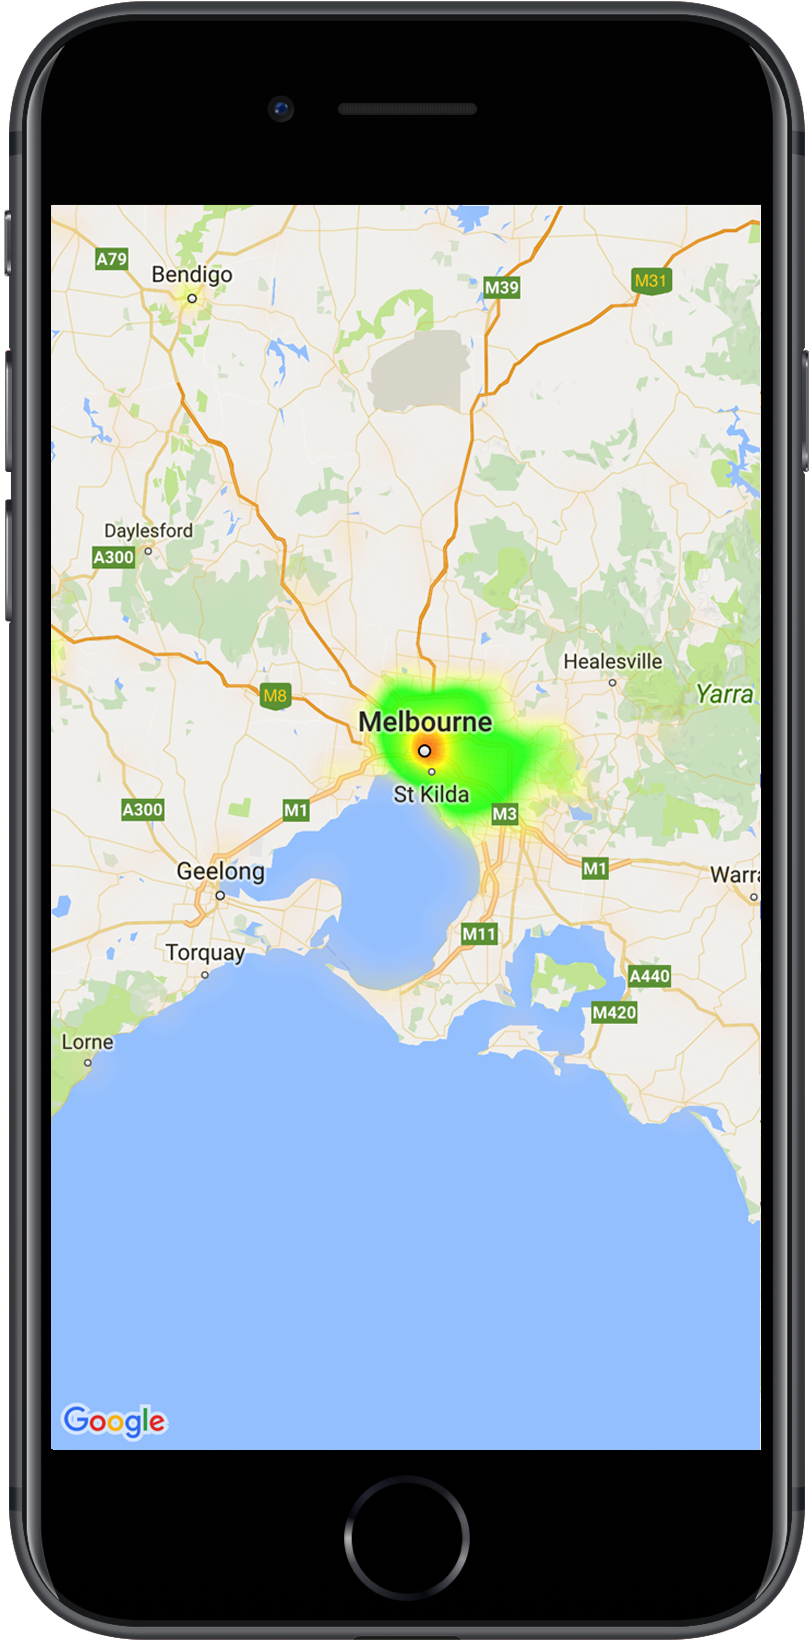
Peta panas memudahkan penonton memahami distribusi dan intensitas relatif titik data pada peta. Peta panas tidak menempatkan penanda di setiap lokasi, tetapi menggunakan warna untuk menampilkan distribusi data.
Dalam contoh di bawah ini, merah mewakili area kantor polisi dengan konsentrasi tinggi di Victoria, Australia.
Peta panas di peta
Jika Anda belum menyiapkan library, ikuti panduan penyiapan sebelum membaca bagian lainnya dari halaman ini.
Menambahkan peta panas sederhana
Untuk menambahkan peta panas ke peta, Anda membutuhkan set data yang terdiri dari
koordinat untuk setiap lokasi yang diinginkan. Pertama, buat instance
GMUHeatmapTileLayer, tetapkan properti map ke GMSMapView.
Lakukan hal ini di fungsi viewDidLoad() aplikasi Anda, untuk memastikan peta dasar dimuat sebelum menggunakan peta panas. Kemudian, teruskan kumpulan objek GMUWeightedLatLng ke instance GMUHeatmapTileLayer.
Utilitas menyediakan class GMUHeatmapTileLayer, yang menerima kumpulan objek GMUWeightedLatLng. Class ini akan membuat gambar ubin untuk berbagai tingkat zoom, berdasarkan opsi radius, gradien, dan opasitas yang disediakan.
Lihat detail selengkapnya untuk langkah-langkah ini:
Buat instance GMUHeatmapTileLayer, tetapkan properti map ke
GMSMapView (lakukan ini dalam fungsi viewDidLoad() aplikasi Anda).
Teruskan kumpulan objek GMUWeightedLatLng ke instance GMUHeatmapTileLayer.
Panggil GMUHeatmapTileLayer.map, dengan meneruskan tampilan peta.
Swift
classHeatmap:UIViewController{privatevarmapView:GMSMapView!privatevarheatmapLayer:GMUHeatmapTileLayer!overridefuncviewDidLoad(){super.viewDidLoad()heatmapLayer=GMUHeatmapTileLayer()heatmapLayer.map=mapView}// ...funcaddHeatmap(){// Get the data: latitude/longitude positions of police stations.guardletpath=Bundle.main.url(forResource:"police_stations",withExtension:"json")else{return}guardletdata=try?Data(contentsOf:path)else{return}guardletjson=try?JSONSerialization.jsonObject(with:data,options:[])else{return}guardletobject=jsonas?[[String:Any]]else{print("Could not read the JSON.")return}varlist=[GMUWeightedLatLng]()foriteminobject{letlat=item["lat"]as!CLLocationDegreesletlng=item["lng"]as!CLLocationDegreesletcoords=GMUWeightedLatLng(coordinate:CLLocationCoordinate2DMake(lat,lng),intensity:1.0)list.append(coords)}// Add the latlngs to the heatmap layer.heatmapLayer.weightedData=list}}
Objective-C
@implementationHeatmap{GMSMapView*_mapView;GMUHeatmapTileLayer*_heatmapLayer;}-(void)viewDidLoad{[superviewDidLoad];_heatmapLayer=[[GMUHeatmapTileLayeralloc]init];_heatmapLayer.map=_mapView;}// ...-(void)addHeatmap{// Get the data: latitude/longitude positions of police stations.NSURL*path=[NSBundle.mainBundleURLForResource:@"police_stations"withExtension:@"json"];NSData*data=[NSDatadataWithContentsOfURL:path];NSArray*json=[NSJSONSerializationJSONObjectWithData:dataoptions:0error:nil];NSMutableArray<GMUWeightedLatLng*>*list=[[NSMutableArrayalloc]init];[jsonenumerateObjectsUsingBlock:^(id_Nonnullobj,NSUIntegeridx,BOOL*_Nonnullstop){NSDictionary*item=(NSDictionary*)obj;CLLocationDegreeslat=[(NSNumber*)[itemvalueForKey:@"lat"]doubleValue];CLLocationDegreeslng=[(NSNumber*)[itemvalueForKey:@"lng"]doubleValue];GMUWeightedLatLng*coords=[[GMUWeightedLatLngalloc]initWithCoordinate:CLLocationCoordinate2DMake(lat,lng)intensity:1.0];[listaddObject:coords];}];// Add the latlngs to the heatmap layer._heatmapLayer.weightedData=list;}@end
Untuk contoh ini, data disimpan dalam file JSON, police_stations.json.
Berikut adalah ekstrak dari file tersebut:
Peta panas memiliki beberapa properti yang dapat disesuaikan. Anda dapat menetapkan opsi saat
membuat instance GMUHeatmapTileLayer pada awalnya, atau kapan saja dengan
menetapkan nilai baru untuk opsi tersebut.
Tersedia opsi-opsi berikut:
Radius: Ukuran blur Gaussian yang diterapkan pada peta panas, dinyatakan dalam piksel. Nilai default-nya adalah 20. Harus antara 10 dan 50. Gunakan
GMUHeatmapTileLayer.radius untuk menetapkan radius.
Gradien: Serangkaian warna yang digunakan peta panas untuk menghasilkan peta warna, berkisar dari intensitas terendah hingga tertinggi. GMUGradient dibuat menggunakan
array integer yang berisi warna, dan array float yang menunjukkan
titik awal untuk setiap warna, diberikan sebagai persentase intensitas maksimum,
dan dinyatakan dalam pecahan antara 0 hingga 1. Anda hanya perlu menentukan satu warna untuk gradien satu warna, atau minimal dua warna untuk gradien multi-warna. Peta warna dibuat menggunakan interpolasi antar warna tersebut.
Gradien default memiliki dua warna. Parameter colorMapSize menentukan
jumlah langkah dalam gradien. Angka yang lebih besar akan menghasilkan gradasi yang lebih halus, sedangkan angka yang lebih kecil akan memberikan transisi yang lebih tajam, mirip dengan grafik kontur. Gunakan GMUHeatmapTileLayer.gradient untuk menyetel gradien.
Opasitas: Ini adalah opasitas seluruh lapisan peta panas, dengan rentang antara 0 sampai 1. Nilai defaultnya adalah 0,7. Gunakan GMUHeatmapTileLayer.opacity untuk menetapkan
nilai keburaman.
Untuk mengubah opasitas peta panas yang sudah ada:
Swift
heatmapLayer.opacity=0.7
Objective-C
_heatmapLayer.opacity=0.7;
Memperbarui opsi yang ada
Untuk memperbarui opsi yang telah ditetapkan, lakukan langkah-langkah berikut:
Perbarui opsi ke nilai yang diinginkan.
Hubungi GMUHeatmapTileLayer.clearTileCache().
Mengubah set data
Untuk mengubah set data yang digunakan untuk membuat peta panas:
Perbarui pengumpulan data Anda. Gunakan GMUHeatmapTileLayer.weightedData, dengan meneruskan
array GMUWeightedLatLng.
Hubungi GMUHeatmapTileLayer.clearTileCache().
Menghapus peta panas
Untuk menghapus peta panas, panggil GMUHeatmapTileLayer.map, dengan meneruskan nil.
Swift
heatmapLayer.map=nil
Objective-C
_heatmapLayer.map=nil;
Melihat aplikasi demo
Untuk contoh penerapan peta panas lainnya, lihat
HeatmapViewController di aplikasi demo yang disertakan dengan library utilitas.
Panduan penyiapan menunjukkan cara menjalankan aplikasi demo.
[[["Mudah dipahami","easyToUnderstand","thumb-up"],["Memecahkan masalah saya","solvedMyProblem","thumb-up"],["Lainnya","otherUp","thumb-up"]],[["Informasi yang saya butuhkan tidak ada","missingTheInformationINeed","thumb-down"],["Terlalu rumit/langkahnya terlalu banyak","tooComplicatedTooManySteps","thumb-down"],["Sudah usang","outOfDate","thumb-down"],["Masalah terjemahan","translationIssue","thumb-down"],["Masalah kode / contoh","samplesCodeIssue","thumb-down"],["Lainnya","otherDown","thumb-down"]],["Terakhir diperbarui pada 2025-09-05 UTC."],[[["\u003cp\u003eHeatmaps visualize the density of data points on a map using color, offering an alternative to markers for large datasets.\u003c/p\u003e\n"],["\u003cp\u003eThe \u003ccode\u003eGMUHeatmapTileLayer\u003c/code\u003e class is used to create heatmaps, accepting \u003ccode\u003eGMUWeightedLatLng\u003c/code\u003e objects for data points.\u003c/p\u003e\n"],["\u003cp\u003eHeatmaps can be customized by adjusting properties like radius, gradient, and opacity using the \u003ccode\u003eGMUHeatmapTileLayer\u003c/code\u003e instance.\u003c/p\u003e\n"],["\u003cp\u003eTo update the heatmap's data or options, modify the relevant properties and then call \u003ccode\u003eclearTileCache()\u003c/code\u003e to refresh the display.\u003c/p\u003e\n"],["\u003cp\u003eHeatmaps can be removed from the map by setting the \u003ccode\u003emap\u003c/code\u003e property of the \u003ccode\u003eGMUHeatmapTileLayer\u003c/code\u003e to \u003ccode\u003enil\u003c/code\u003e.\u003c/p\u003e\n"]]],["Heatmaps display data density on maps using color, offering an alternative to markers. To add one, create a `GMUHeatmapTileLayer` instance, setting its `map` property to `GMSMapView`. Then, supply `GMUWeightedLatLng` objects representing data coordinates to this instance and call `GMUHeatmapTileLayer.map`. Customize heatmaps by adjusting `radius`, `gradient`, and `opacity` properties. To modify data or settings, update values and call `GMUHeatmapTileLayer.clearTileCache()`. To remove the heatmap, set the `map` property to `nil`.\n"],null,["Select platform: [Android](/maps/documentation/android-sdk/utility/heatmap \"View this page for the Android platform docs.\") [iOS](/maps/documentation/ios-sdk/utility/heatmap \"View this page for the iOS platform docs.\") [JavaScript](/maps/documentation/javascript/heatmaplayer \"View this page for the JavaScript platform docs.\")\n\n\u003cbr /\u003e\n\nThis page describes the heatmap utility that's available in the [utility\nlibrary for the\nMaps SDK for iOS](https://github.com/googlemaps/google-maps-ios-utils).\nHeatmaps are useful for representing the distribution and\ndensity of data points on a map.\n\nThis video discusses the use of heatmaps as an alternative to markers, when\nyour data requires a large number of data points on the map. \n\nHeatmaps make it easy for viewers to understand the distribution and relative\nintensity of data points on a map. Rather than placing a marker at each\nlocation, heatmaps use color to represent the distribution of the data.\n\nIn the example below, red represents areas of high concentration of police\nstations in Victoria, Australia.\nA heatmap on a map **Note:** You can set your own colors for the heatmap, using the `gradient` property. See how to [customize](#customize) colors and other properties of your heatmap.\n\nIf you haven't yet set up the library, follow the [setup\nguide](/maps/documentation/ios-sdk/utility/setup) before reading the rest of\nthis page.\n\nAdding a simple heatmap\n\nTo add a heatmap to your map, you will need a dataset consisting of the\ncoordinates for each location of interest. First, create a\n`GMUHeatmapTileLayer` instance, setting the `map` property to a `GMSMapView`.\nDo this in your app's `viewDidLoad()` function, to ensure that the base map is\nloaded before working with the heatmap. Then pass a collection of\n`GMUWeightedLatLng` objects to the `GMUHeatmapTileLayer` instance.\n\nThe utility supplies the `GMUHeatmapTileLayer` class, which accepts a\ncollection of `GMUWeightedLatLng` objects. It creates the tile images for\nvarious zoom levels, based on the radius, gradient and opacity options\nsupplied.\n\nLooking at the steps in more detail:\n\n1. Create a `GMUHeatmapTileLayer` instance, setting the `map` property to a `GMSMapView` (do this in your app's `viewDidLoad()` function).\n2. Pass a collection of `GMUWeightedLatLng` objects to the `GMUHeatmapTileLayer` instance.\n3. Call `GMUHeatmapTileLayer.map`, passing the map view. \n\n Swift \n\n ```swift\n class Heatmap: UIViewController {\n\n private var mapView: GMSMapView!\n private var heatmapLayer: GMUHeatmapTileLayer!\n\n override func viewDidLoad() {\n super.viewDidLoad()\n heatmapLayer = GMUHeatmapTileLayer()\n heatmapLayer.map = mapView\n }\n\n // ...\n\n func addHeatmap() {\n\n // Get the data: latitude/longitude positions of police stations.\n guard let path = Bundle.main.url(forResource: \"police_stations\", withExtension: \"json\") else {\n return\n }\n guard let data = try? Data(contentsOf: path) else {\n return\n }\n guard let json = try? JSONSerialization.jsonObject(with: data, options: []) else {\n return\n }\n guard let object = json as? [[String: Any]] else {\n print(\"Could not read the JSON.\")\n return\n }\n\n var list = [GMUWeightedLatLng]()\n for item in object {\n let lat = item[\"lat\"] as! CLLocationDegrees\n let lng = item[\"lng\"] as! CLLocationDegrees\n let coords = GMUWeightedLatLng(\n coordinate: CLLocationCoordinate2DMake(lat, lng),\n intensity: 1.0\n )\n list.append(coords)\n }\n\n // Add the latlngs to the heatmap layer.\n heatmapLayer.weightedData = list\n }\n }\n \n ```\n\n Objective-C \n\n ```objective-c\n @implementation Heatmap {\n GMSMapView *_mapView;\n GMUHeatmapTileLayer *_heatmapLayer;\n }\n\n - (void)viewDidLoad {\n [super viewDidLoad];\n _heatmapLayer = [[GMUHeatmapTileLayer alloc] init];\n _heatmapLayer.map = _mapView;\n }\n\n // ...\n\n - (void) addHeatmap {\n\n // Get the data: latitude/longitude positions of police stations.\n NSURL *path = [NSBundle.mainBundle URLForResource:@\"police_stations\" withExtension:@\"json\"];\n NSData *data = [NSData dataWithContentsOfURL:path];\n NSArray *json = [NSJSONSerialization JSONObjectWithData:data options:0 error:nil];\n\n NSMutableArray\u003cGMUWeightedLatLng *\u003e *list = [[NSMutableArray alloc] init];\n [json enumerateObjectsUsingBlock:^(id _Nonnull obj, NSUInteger idx, BOOL * _Nonnull stop) {\n NSDictionary *item = (NSDictionary *)obj;\n CLLocationDegrees lat = [(NSNumber *) [item valueForKey:@\"lat\"] doubleValue];\n CLLocationDegrees lng = [(NSNumber *) [item valueForKey:@\"lng\"] doubleValue];\n GMUWeightedLatLng *coords = [[GMUWeightedLatLng alloc] initWithCoordinate:CLLocationCoordinate2DMake(lat, lng)\n intensity:1.0];\n [list addObject:coords];\n }];\n\n\n // Add the latlngs to the heatmap layer.\n _heatmapLayer.weightedData = list;\n }\n @end\n \n ```\n\nFor this example, the data is stored in a JSON file, `police_stations.json`.\nHere is an extract from the file: \n\n [\n {\"lat\" : -37.1886, \"lng\" : 145.708 } ,\n {\"lat\" : -37.8361, \"lng\" : 144.845 } ,\n {\"lat\" : -38.4034, \"lng\" : 144.192 } ,\n {\"lat\" : -38.7597, \"lng\" : 143.67 } ,\n {\"lat\" : -36.9672, \"lng\" : 141.083 }\n ]\n\nCustomizing the heatmap\n\nThe heatmap has several customizable properties. You can set the options when\ninitially creating the `GMUHeatmapTileLayer` instance, or at any time by\nsetting a new value for the option.\n\nThe following options are available:\n\n1. **Radius:** The size of the Gaussian blur applied to the heatmap, expressed\n in pixels. The default is 20. Must be between 10 and 50. Use\n `GMUHeatmapTileLayer.radius` to set the radius.\n\n2. **Gradient:** A range of colors that the heatmap uses to generate its color\n map, ranging from lowest to highest intensity. A `GMUGradient` is created using\n an integer array containing the colors, and a float array indicating the\n starting point for each color, given as a percentage of the maximum intensity,\n and expressed as a fraction from 0 to 1. You need to specify only one color for\n a single-colored gradient, or a minimum of two colors for a multi-colored\n gradient. The color map is generated using interpolation between those colors.\n The default gradient has two colors. The `colorMapSize` parameter defines the\n number of steps in the gradient. Larger numbers will result in a smoother\n gradient, while smaller numbers will give sharper transitions similar to a\n contour graph. Use `GMUHeatmapTileLayer.gradient` to set the gradient.\n\n3. **Opacity:** This is the opacity of the entire heatmap layer, and ranges\n from 0 to 1. The default is 0.7. Use `GMUHeatmapTileLayer.opacity` to set the\n opacity value.\n\nFor example, create a `Gradient`:\n\n\nSwift \n\n```swift\nlet gradientColors: [UIColor] = [.green, .red]\nlet gradientStartPoints: [NSNumber] = [0.2, 1.0]\nheatmapLayer.gradient = GMUGradient(\n colors: gradientColors,\n startPoints: gradientStartPoints,\n colorMapSize: 256\n)\n \n```\n\nObjective-C \n\n```objective-c\nNSArray\u003cUIColor *\u003e *gradientColors = @[UIColor.greenColor, UIColor.redColor];\nNSArray\u003cNSNumber *\u003e *gradientStartPoints = @[@0.2, @1.0];\n_heatmapLayer.gradient = [[GMUGradient alloc] initWithColors:gradientColors\n startPoints:gradientStartPoints\n colorMapSize:256];\n \n```\n\n\u003cbr /\u003e\n\nTo change the opacity of an existing heatmap:\n\n\nSwift \n\n```swift\nheatmapLayer.opacity = 0.7\n \n```\n\nObjective-C \n\n```objective-c\n_heatmapLayer.opacity = 0.7;\n \n```\n\n\u003cbr /\u003e\n\nUpdate an existing option\n\nTo update an option that has already been set, take these steps:\n\n1. Update the option to the desired value.\n2. Call `GMUHeatmapTileLayer.clearTileCache()`.\n\nChanging the dataset\n\nTo change the dataset upon which a heatmap is built:\n\n1. Update your data collection. Use `GMUHeatmapTileLayer.weightedData`, passing an array of `GMUWeightedLatLng`.\n2. Call `GMUHeatmapTileLayer.clearTileCache()`.\n\n| **Note:** if you want to add points to the heatmap, or remove points from the heatmap, first update your data collection and then use `GMUHeatmapTileLayer.weightedData`.\n\nRemoving a heatmap\n\nTo remove a heatmap, call `GMUHeatmapTileLayer.map`, passing `nil`.\n\n\nSwift \n\n```swift\nheatmapLayer.map = nil\n \n```\n\nObjective-C \n\n```objective-c\n_heatmapLayer.map = nil;\n \n```\n\n\u003cbr /\u003e\n\nSee the demo app\n\nFor another example of a heatmap implementation, take a look at the\n`HeatmapViewController` in the demo app that ships with the utility library.\nThe [setup guide](/maps/documentation/ios-sdk/utility/setup) shows you how to\nrun the demo app."]]