Auf dieser Seite wird das Heatmap-Dienstprogramm beschrieben, das in der Dienstprogrammbibliothek für das Maps SDK for iOS verfügbar ist.
Mit Heatmaps lassen sich Verteilung und Dichte von Datenpunkten auf einer Karte darstellen.
In diesem Video wird die Verwendung von Heatmaps anstelle von Markierungen erörtert, wenn für Ihre Daten eine große Anzahl Datenpunkte auf der Karte erforderlich ist.
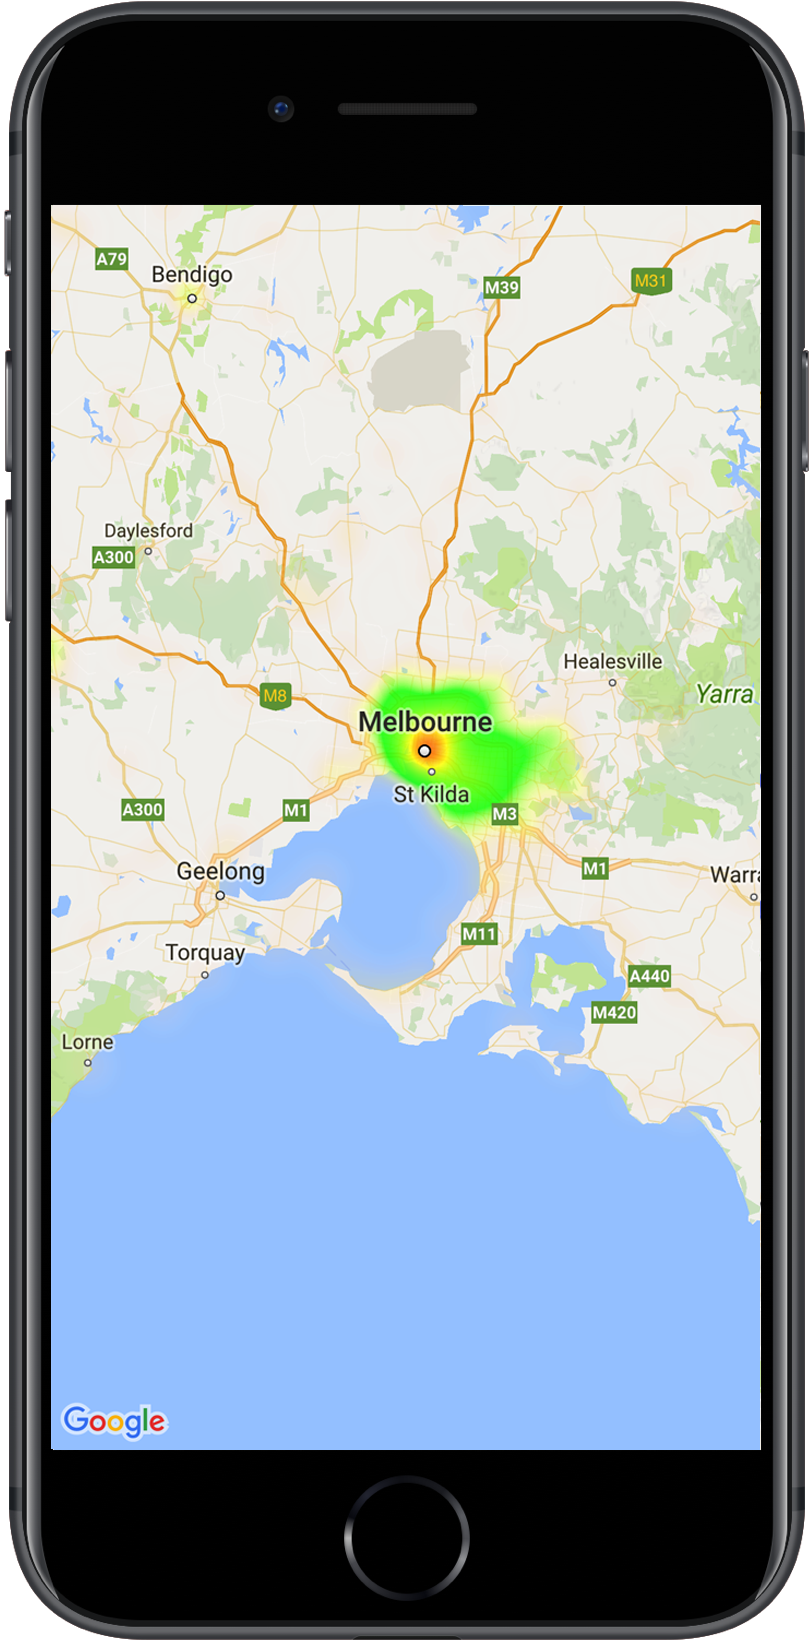
Mit Heatmaps können Nutzer die Verteilung und relative Intensität von Datenpunkten auf einer Karte leichter erkennen. Statt eine Markierung an jedem Standort zu platzieren, wird die Verteilung von Daten bei Heatmaps anhand von Farben dargestellt.
Im nachfolgenden Beispiel sind Bereiche mit einer hohen Konzentration von Polizeidienststellen in Victoria, Australien, in Rot dargestellt.
Heatmap auf einer Karte
Wenn Sie die Bibliothek noch nicht eingerichtet haben, folgen Sie der Einrichtungsanleitung, bevor Sie den Rest dieser Seite lesen.
Einfache Heatmap hinzufügen
Wenn Sie Ihrer Karte eine Heatmap hinzufügen möchten, ist ein Dataset mit Koordinaten für jeden POI erforderlich. Erstellen Sie zuerst eine GMUHeatmapTileLayer-Instanz und legen Sie die map-Eigenschaft auf einen GMSMapView-Wert fest.
Führen Sie diesen Schritt in der viewDidLoad()-Funktion Ihrer App aus, damit die Basiskarte geladen wird, bevor Sie mit der Heatmap arbeiten. Übergeben Sie dann eine Sammlung von GMUWeightedLatLng-Objekten an die GMUHeatmapTileLayer-Instanz.
Das Dienstprogramm stellt die GMUHeatmapTileLayer-Klasse bereit, die eine Sammlung von GMUWeightedLatLng-Objekten akzeptiert. Die Kachelbilder werden für verschiedene Zoomstufen basierend auf den definierten Optionen für Radius, Farbverlauf und Deckkraft erstellt.
Hier sind die einzelnen Schritte im Detail beschrieben:
Erstellen Sie eine GMUHeatmapTileLayer-Instanz und legen Sie die map-Eigenschaft auf eine GMSMapView fest (führen Sie diesen Schritt in der viewDidLoad()-Funktion Ihrer App aus).
Übergeben Sie eine Sammlung von GMUWeightedLatLng-Objekten an die GMUHeatmapTileLayer-Instanz.
Rufen Sie GMUHeatmapTileLayer.map auf und übergeben Sie die Kartenansicht.
Swift
classHeatmap:UIViewController{privatevarmapView:GMSMapView!privatevarheatmapLayer:GMUHeatmapTileLayer!overridefuncviewDidLoad(){super.viewDidLoad()heatmapLayer=GMUHeatmapTileLayer()heatmapLayer.map=mapView}// ...funcaddHeatmap(){// Get the data: latitude/longitude positions of police stations.guardletpath=Bundle.main.url(forResource:"police_stations",withExtension:"json")else{return}guardletdata=try?Data(contentsOf:path)else{return}guardletjson=try?JSONSerialization.jsonObject(with:data,options:[])else{return}guardletobject=jsonas?[[String:Any]]else{print("Could not read the JSON.")return}varlist=[GMUWeightedLatLng]()foriteminobject{letlat=item["lat"]as!CLLocationDegreesletlng=item["lng"]as!CLLocationDegreesletcoords=GMUWeightedLatLng(coordinate:CLLocationCoordinate2DMake(lat,lng),intensity:1.0)list.append(coords)}// Add the latlngs to the heatmap layer.heatmapLayer.weightedData=list}}
Objective-C
@implementationHeatmap{GMSMapView*_mapView;GMUHeatmapTileLayer*_heatmapLayer;}-(void)viewDidLoad{[superviewDidLoad];_heatmapLayer=[[GMUHeatmapTileLayeralloc]init];_heatmapLayer.map=_mapView;}// ...-(void)addHeatmap{// Get the data: latitude/longitude positions of police stations.NSURL*path=[NSBundle.mainBundleURLForResource:@"police_stations"withExtension:@"json"];NSData*data=[NSDatadataWithContentsOfURL:path];NSArray*json=[NSJSONSerializationJSONObjectWithData:dataoptions:0error:nil];NSMutableArray<GMUWeightedLatLng*>*list=[[NSMutableArrayalloc]init];[jsonenumerateObjectsUsingBlock:^(id_Nonnullobj,NSUIntegeridx,BOOL*_Nonnullstop){NSDictionary*item=(NSDictionary*)obj;CLLocationDegreeslat=[(NSNumber*)[itemvalueForKey:@"lat"]doubleValue];CLLocationDegreeslng=[(NSNumber*)[itemvalueForKey:@"lng"]doubleValue];GMUWeightedLatLng*coords=[[GMUWeightedLatLngalloc]initWithCoordinate:CLLocationCoordinate2DMake(lat,lng)intensity:1.0];[listaddObject:coords];}];// Add the latlngs to the heatmap layer._heatmapLayer.weightedData=list;}@end
In diesem Beispiel werden die Daten in der JSON-Datei police_stations.json gespeichert.
Hier sehen Sie einen Auszug aus der Datei:
Die Heatmap hat mehrere anpassbare Attribute. Sie können die Optionen beim Erstellen der GMUHeatmapTileLayer-Instanz oder jederzeit durch Festlegen eines neuen Werts für die Option festlegen.
Folgende Optionen sind verfügbar:
Radius:Die Größe des auf die Heatmap angewendeten Gaußschen Weichzeichners, ausgedrückt in Pixeln. Der Standardwert ist 20. Der Wert muss zwischen 10 und 50 liegen. Verwenden Sie GMUHeatmapTileLayer.radius, um den Radius festzulegen.
Verlauf:Der Farbverlauf von der niedrigsten zur höchsten Intensität, der in der Heatmap zum Erstellen der Farbkarte verwendet wird. Ein GMUGradient wird mithilfe von zwei Arrays erstellt: ein Ganzzahl-Array, das die Farben enthält, und ein Gleitkommazahl-Array, das den Anfangspunkt für jede Farbe in Form eines Prozentsatzes der maximalen Intensität angibt, ausgedrückt als Teilwert zwischen 0 und 1. Für einen einfarbigen Farbverlauf müssen Sie nur eine Farbe angeben; für mehrfarbige Farbverläufe sind mindestens zwei Farben zu definieren. Die Farbkarte wird durch Interpolieren dieser Farben generiert.
Der Standardfarbverlauf verfügt über zwei Farben. Der Parameter colorMapSize definiert die Anzahl der Schritte im Farbverlauf. Größere Zahlen führen zu einem weicheren Farbverlauf, während kleinere Zahlen schärfere Übergänge wie in einem Konturdiagramm ergeben. Verwenden Sie GMUHeatmapTileLayer.gradient, um den Farbverlauf festzulegen.
Deckkraft:Das ist die Deckkraft der gesamten Heatmap-Ebene. Der Wert liegt zwischen 0 und 1. Der Standardwert ist „0,7“. Verwenden Sie GMUHeatmapTileLayer.opacity, um den Deckkraftwert festzulegen.
So ändern Sie die Deckkraft einer vorhandenen Heatmap:
Swift
heatmapLayer.opacity=0.7
Objective-C
_heatmapLayer.opacity=0.7;
Vorhandene Option aktualisieren
So aktualisieren Sie eine Option, die bereits festgelegt wurde:
Aktualisieren Sie die Option auf den gewünschten Wert.
Rufen Sie einfach GMUHeatmapTileLayer.clearTileCache() an.
Dataset ändern
So ändern Sie das Dataset einer Heatmap:
Aktualisieren Sie die Datenerhebung. Verwenden Sie GMUHeatmapTileLayer.weightedData und übergeben Sie ein Array von GMUWeightedLatLng.
Rufen Sie einfach GMUHeatmapTileLayer.clearTileCache() an.
Heatmap entfernen
Wenn Sie eine Heatmap entfernen möchten, rufen Sie GMUHeatmapTileLayer.map auf und übergeben Sie nil.
Swift
heatmapLayer.map=nil
Objective-C
_heatmapLayer.map=nil;
Demo-App ansehen
Ein weiteres Beispiel für eine Heatmap-Implementierung finden Sie in der HeatmapViewController der Demo-App, die Sie mit der Dienstprogrammbibliothek erhalten.
Im Einrichtungsleitfaden erhalten Sie Informationen zum Ausführen der Demo-App.
[[["Leicht verständlich","easyToUnderstand","thumb-up"],["Mein Problem wurde gelöst","solvedMyProblem","thumb-up"],["Sonstiges","otherUp","thumb-up"]],[["Benötigte Informationen nicht gefunden","missingTheInformationINeed","thumb-down"],["Zu umständlich/zu viele Schritte","tooComplicatedTooManySteps","thumb-down"],["Nicht mehr aktuell","outOfDate","thumb-down"],["Problem mit der Übersetzung","translationIssue","thumb-down"],["Problem mit Beispielen/Code","samplesCodeIssue","thumb-down"],["Sonstiges","otherDown","thumb-down"]],["Zuletzt aktualisiert: 2025-09-05 (UTC)."],[[["\u003cp\u003eHeatmaps visualize the density of data points on a map using color, offering an alternative to markers for large datasets.\u003c/p\u003e\n"],["\u003cp\u003eThe \u003ccode\u003eGMUHeatmapTileLayer\u003c/code\u003e class is used to create heatmaps, accepting \u003ccode\u003eGMUWeightedLatLng\u003c/code\u003e objects for data points.\u003c/p\u003e\n"],["\u003cp\u003eHeatmaps can be customized by adjusting properties like radius, gradient, and opacity using the \u003ccode\u003eGMUHeatmapTileLayer\u003c/code\u003e instance.\u003c/p\u003e\n"],["\u003cp\u003eTo update the heatmap's data or options, modify the relevant properties and then call \u003ccode\u003eclearTileCache()\u003c/code\u003e to refresh the display.\u003c/p\u003e\n"],["\u003cp\u003eHeatmaps can be removed from the map by setting the \u003ccode\u003emap\u003c/code\u003e property of the \u003ccode\u003eGMUHeatmapTileLayer\u003c/code\u003e to \u003ccode\u003enil\u003c/code\u003e.\u003c/p\u003e\n"]]],["Heatmaps display data density on maps using color, offering an alternative to markers. To add one, create a `GMUHeatmapTileLayer` instance, setting its `map` property to `GMSMapView`. Then, supply `GMUWeightedLatLng` objects representing data coordinates to this instance and call `GMUHeatmapTileLayer.map`. Customize heatmaps by adjusting `radius`, `gradient`, and `opacity` properties. To modify data or settings, update values and call `GMUHeatmapTileLayer.clearTileCache()`. To remove the heatmap, set the `map` property to `nil`.\n"],null,["Select platform: [Android](/maps/documentation/android-sdk/utility/heatmap \"View this page for the Android platform docs.\") [iOS](/maps/documentation/ios-sdk/utility/heatmap \"View this page for the iOS platform docs.\") [JavaScript](/maps/documentation/javascript/heatmaplayer \"View this page for the JavaScript platform docs.\")\n\n\u003cbr /\u003e\n\nThis page describes the heatmap utility that's available in the [utility\nlibrary for the\nMaps SDK for iOS](https://github.com/googlemaps/google-maps-ios-utils).\nHeatmaps are useful for representing the distribution and\ndensity of data points on a map.\n\nThis video discusses the use of heatmaps as an alternative to markers, when\nyour data requires a large number of data points on the map. \n\nHeatmaps make it easy for viewers to understand the distribution and relative\nintensity of data points on a map. Rather than placing a marker at each\nlocation, heatmaps use color to represent the distribution of the data.\n\nIn the example below, red represents areas of high concentration of police\nstations in Victoria, Australia.\nA heatmap on a map **Note:** You can set your own colors for the heatmap, using the `gradient` property. See how to [customize](#customize) colors and other properties of your heatmap.\n\nIf you haven't yet set up the library, follow the [setup\nguide](/maps/documentation/ios-sdk/utility/setup) before reading the rest of\nthis page.\n\nAdding a simple heatmap\n\nTo add a heatmap to your map, you will need a dataset consisting of the\ncoordinates for each location of interest. First, create a\n`GMUHeatmapTileLayer` instance, setting the `map` property to a `GMSMapView`.\nDo this in your app's `viewDidLoad()` function, to ensure that the base map is\nloaded before working with the heatmap. Then pass a collection of\n`GMUWeightedLatLng` objects to the `GMUHeatmapTileLayer` instance.\n\nThe utility supplies the `GMUHeatmapTileLayer` class, which accepts a\ncollection of `GMUWeightedLatLng` objects. It creates the tile images for\nvarious zoom levels, based on the radius, gradient and opacity options\nsupplied.\n\nLooking at the steps in more detail:\n\n1. Create a `GMUHeatmapTileLayer` instance, setting the `map` property to a `GMSMapView` (do this in your app's `viewDidLoad()` function).\n2. Pass a collection of `GMUWeightedLatLng` objects to the `GMUHeatmapTileLayer` instance.\n3. Call `GMUHeatmapTileLayer.map`, passing the map view. \n\n Swift \n\n ```swift\n class Heatmap: UIViewController {\n\n private var mapView: GMSMapView!\n private var heatmapLayer: GMUHeatmapTileLayer!\n\n override func viewDidLoad() {\n super.viewDidLoad()\n heatmapLayer = GMUHeatmapTileLayer()\n heatmapLayer.map = mapView\n }\n\n // ...\n\n func addHeatmap() {\n\n // Get the data: latitude/longitude positions of police stations.\n guard let path = Bundle.main.url(forResource: \"police_stations\", withExtension: \"json\") else {\n return\n }\n guard let data = try? Data(contentsOf: path) else {\n return\n }\n guard let json = try? JSONSerialization.jsonObject(with: data, options: []) else {\n return\n }\n guard let object = json as? [[String: Any]] else {\n print(\"Could not read the JSON.\")\n return\n }\n\n var list = [GMUWeightedLatLng]()\n for item in object {\n let lat = item[\"lat\"] as! CLLocationDegrees\n let lng = item[\"lng\"] as! CLLocationDegrees\n let coords = GMUWeightedLatLng(\n coordinate: CLLocationCoordinate2DMake(lat, lng),\n intensity: 1.0\n )\n list.append(coords)\n }\n\n // Add the latlngs to the heatmap layer.\n heatmapLayer.weightedData = list\n }\n }\n \n ```\n\n Objective-C \n\n ```objective-c\n @implementation Heatmap {\n GMSMapView *_mapView;\n GMUHeatmapTileLayer *_heatmapLayer;\n }\n\n - (void)viewDidLoad {\n [super viewDidLoad];\n _heatmapLayer = [[GMUHeatmapTileLayer alloc] init];\n _heatmapLayer.map = _mapView;\n }\n\n // ...\n\n - (void) addHeatmap {\n\n // Get the data: latitude/longitude positions of police stations.\n NSURL *path = [NSBundle.mainBundle URLForResource:@\"police_stations\" withExtension:@\"json\"];\n NSData *data = [NSData dataWithContentsOfURL:path];\n NSArray *json = [NSJSONSerialization JSONObjectWithData:data options:0 error:nil];\n\n NSMutableArray\u003cGMUWeightedLatLng *\u003e *list = [[NSMutableArray alloc] init];\n [json enumerateObjectsUsingBlock:^(id _Nonnull obj, NSUInteger idx, BOOL * _Nonnull stop) {\n NSDictionary *item = (NSDictionary *)obj;\n CLLocationDegrees lat = [(NSNumber *) [item valueForKey:@\"lat\"] doubleValue];\n CLLocationDegrees lng = [(NSNumber *) [item valueForKey:@\"lng\"] doubleValue];\n GMUWeightedLatLng *coords = [[GMUWeightedLatLng alloc] initWithCoordinate:CLLocationCoordinate2DMake(lat, lng)\n intensity:1.0];\n [list addObject:coords];\n }];\n\n\n // Add the latlngs to the heatmap layer.\n _heatmapLayer.weightedData = list;\n }\n @end\n \n ```\n\nFor this example, the data is stored in a JSON file, `police_stations.json`.\nHere is an extract from the file: \n\n [\n {\"lat\" : -37.1886, \"lng\" : 145.708 } ,\n {\"lat\" : -37.8361, \"lng\" : 144.845 } ,\n {\"lat\" : -38.4034, \"lng\" : 144.192 } ,\n {\"lat\" : -38.7597, \"lng\" : 143.67 } ,\n {\"lat\" : -36.9672, \"lng\" : 141.083 }\n ]\n\nCustomizing the heatmap\n\nThe heatmap has several customizable properties. You can set the options when\ninitially creating the `GMUHeatmapTileLayer` instance, or at any time by\nsetting a new value for the option.\n\nThe following options are available:\n\n1. **Radius:** The size of the Gaussian blur applied to the heatmap, expressed\n in pixels. The default is 20. Must be between 10 and 50. Use\n `GMUHeatmapTileLayer.radius` to set the radius.\n\n2. **Gradient:** A range of colors that the heatmap uses to generate its color\n map, ranging from lowest to highest intensity. A `GMUGradient` is created using\n an integer array containing the colors, and a float array indicating the\n starting point for each color, given as a percentage of the maximum intensity,\n and expressed as a fraction from 0 to 1. You need to specify only one color for\n a single-colored gradient, or a minimum of two colors for a multi-colored\n gradient. The color map is generated using interpolation between those colors.\n The default gradient has two colors. The `colorMapSize` parameter defines the\n number of steps in the gradient. Larger numbers will result in a smoother\n gradient, while smaller numbers will give sharper transitions similar to a\n contour graph. Use `GMUHeatmapTileLayer.gradient` to set the gradient.\n\n3. **Opacity:** This is the opacity of the entire heatmap layer, and ranges\n from 0 to 1. The default is 0.7. Use `GMUHeatmapTileLayer.opacity` to set the\n opacity value.\n\nFor example, create a `Gradient`:\n\n\nSwift \n\n```swift\nlet gradientColors: [UIColor] = [.green, .red]\nlet gradientStartPoints: [NSNumber] = [0.2, 1.0]\nheatmapLayer.gradient = GMUGradient(\n colors: gradientColors,\n startPoints: gradientStartPoints,\n colorMapSize: 256\n)\n \n```\n\nObjective-C \n\n```objective-c\nNSArray\u003cUIColor *\u003e *gradientColors = @[UIColor.greenColor, UIColor.redColor];\nNSArray\u003cNSNumber *\u003e *gradientStartPoints = @[@0.2, @1.0];\n_heatmapLayer.gradient = [[GMUGradient alloc] initWithColors:gradientColors\n startPoints:gradientStartPoints\n colorMapSize:256];\n \n```\n\n\u003cbr /\u003e\n\nTo change the opacity of an existing heatmap:\n\n\nSwift \n\n```swift\nheatmapLayer.opacity = 0.7\n \n```\n\nObjective-C \n\n```objective-c\n_heatmapLayer.opacity = 0.7;\n \n```\n\n\u003cbr /\u003e\n\nUpdate an existing option\n\nTo update an option that has already been set, take these steps:\n\n1. Update the option to the desired value.\n2. Call `GMUHeatmapTileLayer.clearTileCache()`.\n\nChanging the dataset\n\nTo change the dataset upon which a heatmap is built:\n\n1. Update your data collection. Use `GMUHeatmapTileLayer.weightedData`, passing an array of `GMUWeightedLatLng`.\n2. Call `GMUHeatmapTileLayer.clearTileCache()`.\n\n| **Note:** if you want to add points to the heatmap, or remove points from the heatmap, first update your data collection and then use `GMUHeatmapTileLayer.weightedData`.\n\nRemoving a heatmap\n\nTo remove a heatmap, call `GMUHeatmapTileLayer.map`, passing `nil`.\n\n\nSwift \n\n```swift\nheatmapLayer.map = nil\n \n```\n\nObjective-C \n\n```objective-c\n_heatmapLayer.map = nil;\n \n```\n\n\u003cbr /\u003e\n\nSee the demo app\n\nFor another example of a heatmap implementation, take a look at the\n`HeatmapViewController` in the demo app that ships with the utility library.\nThe [setup guide](/maps/documentation/ios-sdk/utility/setup) shows you how to\nrun the demo app."]]