Page Summary
-
SMAP is an orbiting observatory measuring surface soil moisture globally, crucial for weather, drought, flood, and agriculture applications.
-
The SMAP mission uses an L-band passive radiometer collecting daily data with global coverage every 2-3 days.
-
Three SMAP products are available in the GEE catalog: SPL3SMP_E.005 (daily, 9 km), SPL4SMGP.007 (3-hourly, 11 km), and the discontinued NASA-USDA Enhanced SMAP (daily, 10 km).
-
The tutorial covers importing, visualizing, and analyzing SMAP data in Google Earth Engine, including plotting time series and creating mean composites.
-
Users can explore SMAP data without coding using a beta visualization application, or use provided code examples for basic visualization, intermediate analysis with masking and clipping, and plotting time series.

The thematic focus is learning about the SMAP instrument for water resources management applications.
The learning objectives of this tutorial:
- Understand how SMAP measures soil moisture from space
- Know which SMAP products are available in GEE catalog and the differences between the products
- Know how to import SMAP products into the Code Editor
- Visualize SMAP by adding visualization parameters
- Plot a time series of SMAP soil moisture for a point geometry
After completing this tutorial, you will be able to choose the optimal SMAP product for your analysis/application, as well as import, visualize, and analyze a time series of SMAP soil moisture data in Google Earth Engine.
Soil Moisture Active Passive (SMAP)
Mission objective
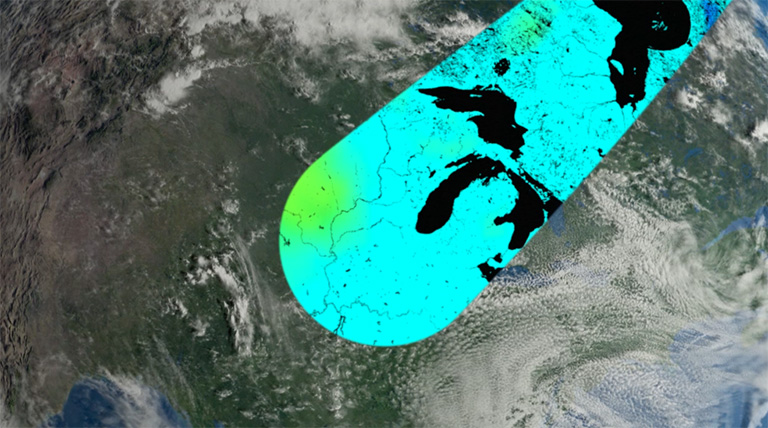
The SMAP mission is an orbiting observatory that measures the amount of water in the surface soil everywhere on Earth. Soil moisture is an important measurement for weather forecasting, drought and flood predictions, agriculture, and more.
Instrument description
SMAP was launched in January, 2015 and started operation in April, 2015 with two instruments onboard to measure soil moisture: an active radar and a passive radiometer. The radar instrument ceased operation in early 2015 due to failure of radar power supply, but collected close to 3 months of science data that are available from the Alaska Satellite Facility. The passive L-band radiometer collects daily data at 6 a.m. (descending) and 6 p.m. (ascending) local solar time for complete global coverage every 2–3 days. This permits changes, around the world, to be observed over time scales ranging from major storms to repeated measurements of changes over the seasons.
The radiometer specifications are described in the table below.
Frequency Polarization Resolution Relative accuracy 1.41 Ghz H, V 36-km original, 9-km enhanced 1.3 K SMAP's radiometer collects naturally emitted energy from the surface with a 20-foot-wide mesh antenna that rotates 14 times per minute – the largest such spinning antenna in space.
Watch an animation on how SMAP gathers data.
What does SMAP measure?
- SMAP measures how much water is in the top layer (5 cm) of soil everywhere on Earth not covered with water or not frozen. It also distinguishes between ground that is frozen or thawed.
- Where the ground is not frozen, SMAP measures the amount of water found between the minerals, rocky material, and organic particles found in soil everywhere in the world.
- SMAP measures liquid water in the top layer of ground but is not able to measure the ice.
How does SMAP measure soil moisture?
- All types of soil emit microwave radiation, but the amount of water changes how much of this energy is emitted.
- The drier the soil, the more microwave energy; the wetter the soil, the less energy.
- Radiometers measure this radiation, and scientists use the data to calculate water content.
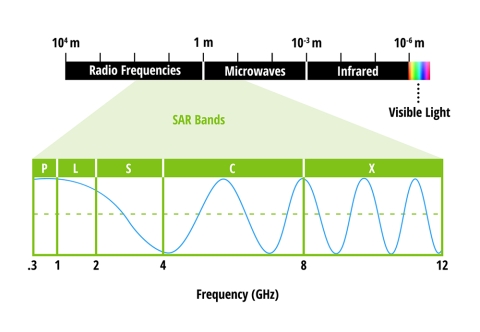
- SMAP measures radiation in the L-band microwave wavelength (30–15 cm & 1–2 Ghz frequency). This wavelength of energy penetrates clouds, so SMAP can measure soil moisture regardless of cloudy conditions.
Watch a video on how SMAP measures soil moisture.
SMAP products in GEE
There are three different SMAP products available in the catalog.
-
This Level-3 (L3) soil moisture product provides a daily composite of global land surface conditions retrieved by the Soil Moisture Active Passive (SMAP) L-Band radiometer.
temporal resolution gridded resolutions availability uses Daily 9 km March 31, 2015 - present L-band brightness temperature measures from this product can be used to analyze soil moisture, fine fuel moisture content, ocean salinity, and sea ice thickness.
The L3 surface soil moisture product is highly accurate, within 4%.
The attenuation of soil-emitted radiation by vegetation limits the accuracy of the soil moisture estimates in densely forested areas, therefore masking the data with the retrieval quality flag bands is recommended.Data outages: June 19-July 23, 2019; September 20-October 6th, 2022
-
The SMAP Level-4 (L4) Soil Moisture product includes surface soil moisture (0-5 cm vertical average), root-zone soil moisture (0-100 cm vertical average), and additional research products (not validated), including surface meteorological forcing variables, soil temperature, evapotranspiration, and net radiation.
temporal resolution gridded resolutions availability uses 3-hourly 11 km March 31, 2015 - present Modeled outputs of surface and root zone soil moisture with full global coverage and high temporal frequency. SMAP L4 provides uninterrupted soil moisture data. During outages of the SMAP instrument, SMAP L4 soil moisture is based on land model simulations alone, without the concomitant assimilation of SMAP brightness temperature observations. Significant SMAP instrument outages occurred between 19 June and 23 July 2019 and between 6 August and 20 September 2022.
-
- The NASA-USDA Enhanced SMAP global soil moisture data provides soil moisture information across the globe at 10-km spatial resolution. This dataset includes surface and subsurface soil moisture (mm), soil moisture profile (%), as well as surface and subsurface soil moisture anomalies (-).
- The dataset is generated by integrating satellite-derived Soil Moisture Active Passive (SMAP) Level 2 soil moisture observations into the modified two-layer Palmer model using a 1-D Ensemble Kalman Filter (EnKF) data assimilation approach. Soil moisture anomalies were computed from the climatology of the day of interest. The climatology was estimated based on the full data record of the SMAP satellite observation and the 31-day-centered moving-window approach. The assimilation of the SMAP soil moisture observations help improve the model-based soil moisture predictions particularly over poorly instrumented areas of the world that lack good quality precipitation data.
This dataset was developed by the Hydrological Science Laboratory at NASA's Goddard Space Flight Center in cooperation with USDA Foreign Agricultural Services and USDA Hydrology and Remote Sensing Lab.
temporal resolution gridded resolutions availability uses Daily 10 km April 2, 2015 - August 2, 2022 Modeled surface and root zone soil moisture from the USDA-FAS Palmer model for agricultural drought monitoring. As of August 2022, the NASA-USDA Enhanced SMAP Global soil moisture product has been discontinued.
The table below describes the surface soil moisture, root-zone soil moisture,
and soil moisture anomaly bands available with each product.
| Band description | NASA-USDA Enhanced SMAP | SPL4SMGP.007 | SPL3SMP_E.005 |
|---|---|---|---|
| Surface soil moisture | ssm | sm_surface | soil_moisture_am soil_moisture_pm |
| Subsurface soil moisture | susm | sm_rootzone | NA |
| Soil moisture profile | smp | sm_profile | sm_profile |
| Surface soil moisture anomaly | ssma | sm_surface_anomaly | soil_moisture_am_anomaly soil_moisture_pm_anomaly |
| Subsurface soil moisture anomaly | susma | NA | NA |
Visualizing SMAP
In this section, you will learn ways to visualize SMAP in GEE based on your level of experience with the Code Editor.
No coding required
Explore the data using the SMAP visualization application (beta); no coding is required.
New to GEE
// View a single day of SMAP L3 data for both ascending and descending
// overpasses. Change date in line below to see the SMAP L3 image for that day.
var dataset = ee.ImageCollection('NASA/SMAP/SPL3SMP_E/005')
                  .filterDate('2023-04-05');
// Select descending pass of instrument (am).
var soilMoistureSurfaceAM = dataset.select('soil_moisture_am');
// Print collection properties to console for inspection.
print(soilMoistureSurfaceAM);
// Select ascending pass of instrument (pm).
var soilMoistureSurfacePM = dataset.select('soil_moisture_pm');
// Print collection properties to console for inspection.
print(soilMoistureSurfacePM);
// Set visualization parameters.
var soilMoistureVis = {
  min: 0.0,
  max: 0.6,
  palette: ['fC6238', 'FFEC59', '8DD7BF', '00B0BA', '0065A2']
};
// Set map center [lon, lat] and zoom level.
Map.setCenter(-6.746, 46.529, 2);
Map.addLayer(soilMoistureSurfaceAM, soilMoistureVis, 'Soil Moisture AM');
Map.addLayer(soilMoistureSurfacePM, soilMoistureVis, 'Soil Moisture PM');
Analysis and visualization of SMAP L3 product
Intermediate
// Data: Soil Moisture AM band from L3 SMAP global soil moisture.
// 1) Mask the data with the retrieval quality flag.
// 2) Compute a mean image from multiple images in a series.
// 3) Clip results to country boundary.
// 4) Exports data to GeoTIFF.
// Import country polygons by ISO Alpha-3 code; this example uses Uruguay
// as a region of interest.
var iso_code ='URY';
var country = ee.FeatureCollection('USDOS/LSIB/2013').filter(
    ee.Filter.eq('iso_alpha3', iso_code));
var SMAPL3 = ee.ImageCollection('NASA/SMAP/SPL3SMP_E/005');
// Print collection properties to console for inspection
print(SMAPL3);
// Select 1 month of SMAP images to create mean composite.
// Remember SMAP L3 data are unavailable for the following dates:
// June 19-July 23, 2019 and September 20-October 6th, 2022.
var dataset = SMAPL3.filterDate('2022-07-01', '2022-07-31');
var soilMoisture = dataset.select('soil_moisture_am');
// Set visualization parameters for mean image.
var soilMoistureVis = {
  min: 0.0,
  max: 0.6,
  palette: ['fC6238', 'FFEC59', '8DD7BF', '00B0BA', '0065A2']
};
// Set map center on the country and zoom level 7.
Map.centerObject(country, 7);
// Select AM soil moisture and convert the collection to bands.
var soilmoisture_am = dataset.select('soil_moisture_am').toBands();
// Compute per-pixel mean over the time series.
var SM_MEAN = soilmoisture_am.reduce(ee.Reducer.mean());
// Select QA values.
var soilmoisture_am_qamask = dataset.select('retrieval_qual_flag_am').toBands();
// Invert QA values to create mask.
var QA_mask = soilmoisture_am_qamask.eq(0);
// Add QA mask to soil moisture.
var SM_masked = soilmoisture_am.updateMask(QA_mask);
// Reduce image stack to single image with mean reducer.
var SM_masked_MEAN = SM_masked.reduce(ee.Reducer.mean());
// Visualize Soil Mean Moisture global (cm3/cm3)*1000
// Map.addLayer(SM_masked_MEAN, soilMoistureVis, 'Mean Soil Moisture Masked');
// Map.addLayer(SM_MEAN, soilMoistureVis, 'Mean Soil Moisture');
// Select this option to clip map to Uruguay (cm3/cm3)*1000
Map.addLayer(
    SM_MEAN.clip(country), soilMoistureVis, 'Mean Soil Moisture');
Map.addLayer(
    SM_masked_MEAN.clip(country), soilMoistureVis, 'Mean Soil Moisture Masked');
// Export with maps Mercator projection at 10 km scale.
var exportParams = {scale: 10000, region: country, crs: 'EPSG:3857'};
// Create export task and go to tasks tab to run.
// Set output file names.
Export.image(SM_masked_MEAN, 'SM_MaskedJuly2022MEAN_URY', exportParams);
Export.image(SM_MEAN, 'SM_July2022MEAN_URY', exportParams);
Plotting soil moisture over time with the SMAP L4 product
Intermediate
Plotting a time series of daily surface and root zone soil moisture.
// Create single-day average of SMAP L4 version 7, 3-hourly soil moisture
// to view. Plot surface soil moisture and root zone soil moisture over
// user-determined time period.
var SMAPL4 = ee.ImageCollection('NASA/SMAP/SPL4SMGP/007');
// Set lon, lat of point of interest.
var point = ee.Geometry.Point([-97.808804, 34.975981]);
// Zoom to point with zoom level 7.
Map.centerObject(point, 7);
// Define visualization parameters.
var soilMoistureVis = {
  min: 0.0,
  max: 0.7,
  palette: ['A67C00', 'FFE625', 'C2E5D3', '90DCD0',
            '2FBDBD', '0C9BBD', '068682'],
};
// User input: set time frame (June-July-August).
var startdate = '2022-06-01';
var enddate = '2022-08-31';
// Load input collection, filter by date, and select surface soil moisture data.
var soilMoisture = SMAPL4.filterDate(startdate, enddate)
                            .select(['sm_surface', 'sm_rootzone']);
// Select soil moisture for last day in time frame.
var soilMoisture1 = soilMoisture.filterDate(enddate)
                                .select(['sm_surface']);
// Create average soil moisture for the last day for visualization.
var soilMoisture_oneday = soilMoisture1.reduce(ee.Reducer.mean());
Map.addLayer(
    soilMoisture.select('sm_surface'), soilMoistureVis, 'Soil Moisture');
Map.addLayer(
    point, {color: 'black'}, 'Geometry [black]: point');
// Define the chart and print it to the console.
var chart =
    ui.Chart.image
        .series({
          imageCollection: soilMoisture,
          region: point,
          reducer: ee.Reducer.mean(),
          scale: 10000,
          xProperty: 'system:time_start'
        })
        .setSeriesNames(['root zone soil moisture', 'surface soil moisture'])
        .setOptions({
          title: 'SMAP L4 version 7, 3-hourly surface and root zone soil '
            + 'moisture (34.975981 N, 97.808804 W)',
          hAxis: {
            title: 'Date',
            titleTextStyle: {italic: false, bold: true}
          },
          vAxis: {
            title: 'Soil Moisture cm3/cm3',
            titleTextStyle: {italic: false, bold: true}
          },
          lineWidth: 5,
          colors: ['4F7942', 'C7EA46'],
          curveType: 'function'
        });
print(chart);
Drought monitoring with SMAP and Global Precipitation Mission (GPM) IMERG
Advanced
Click here to access the tutorial