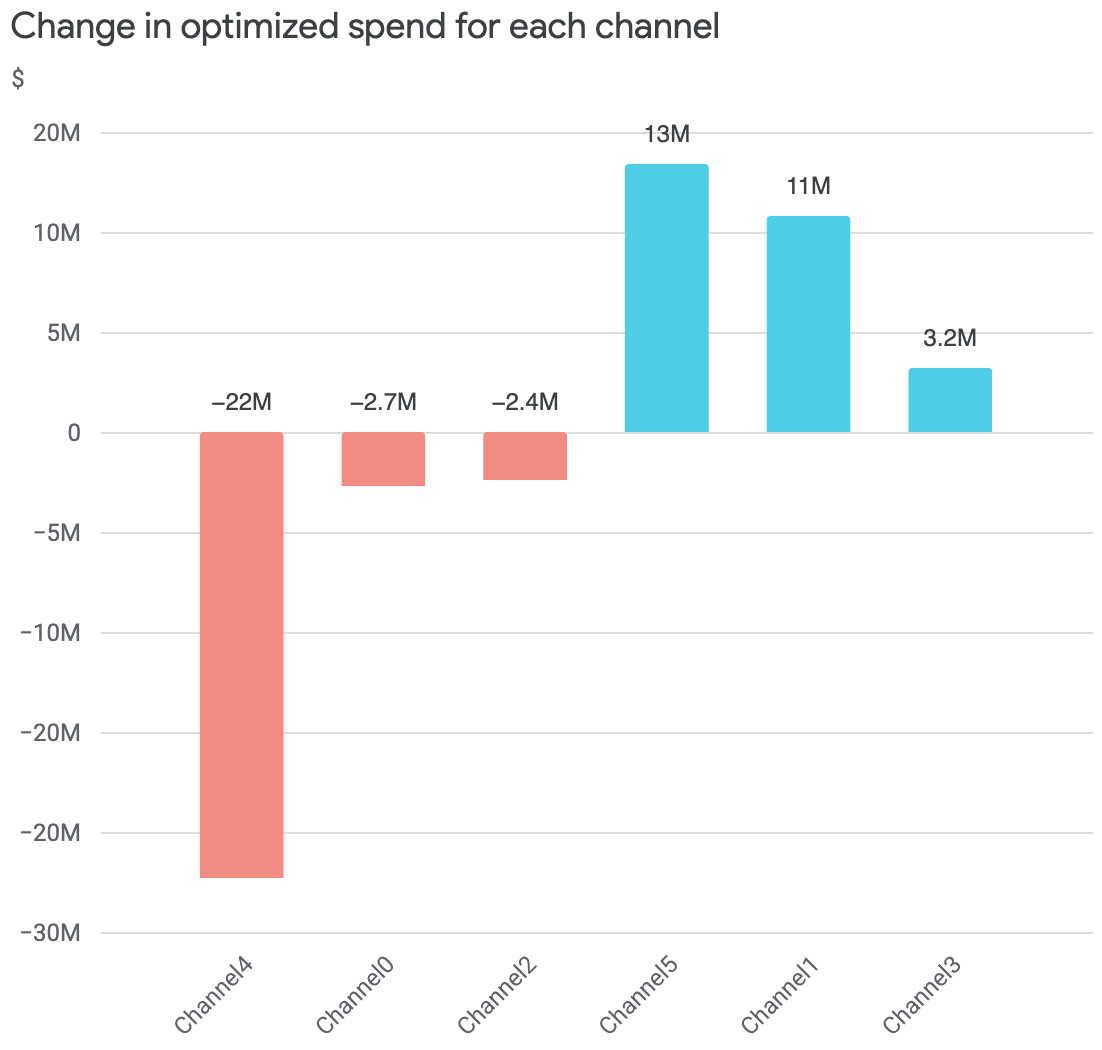
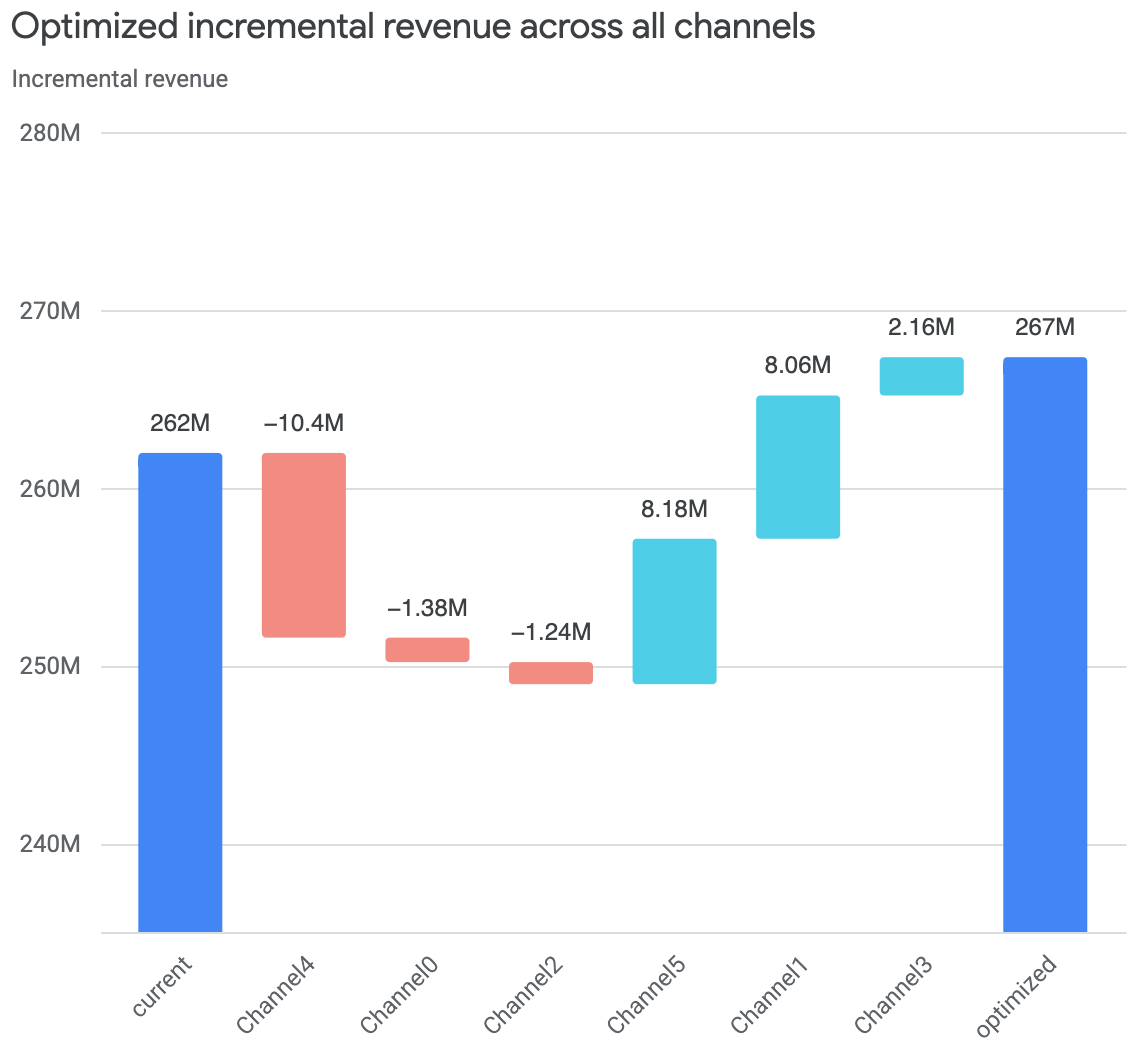
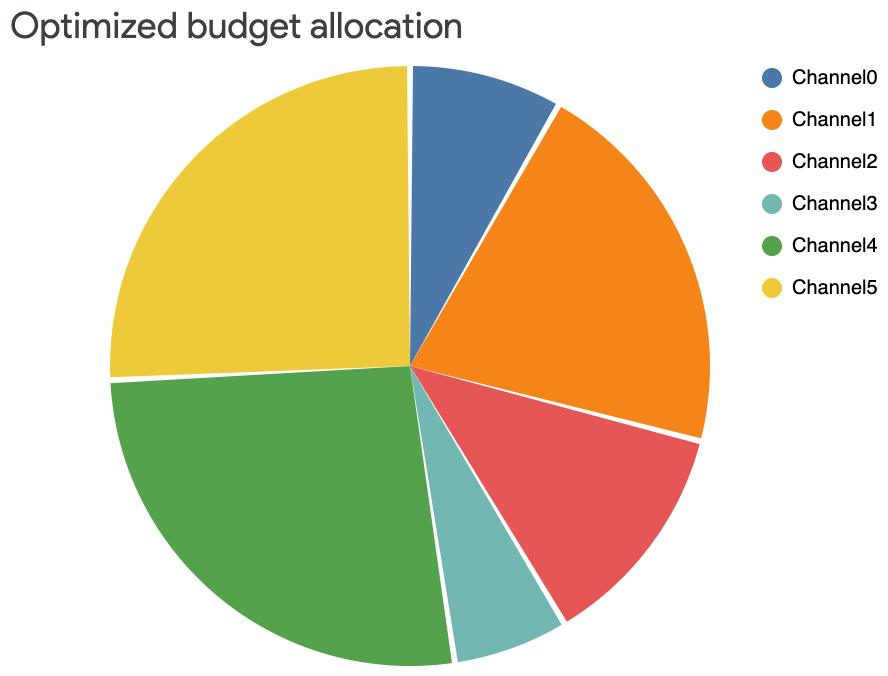
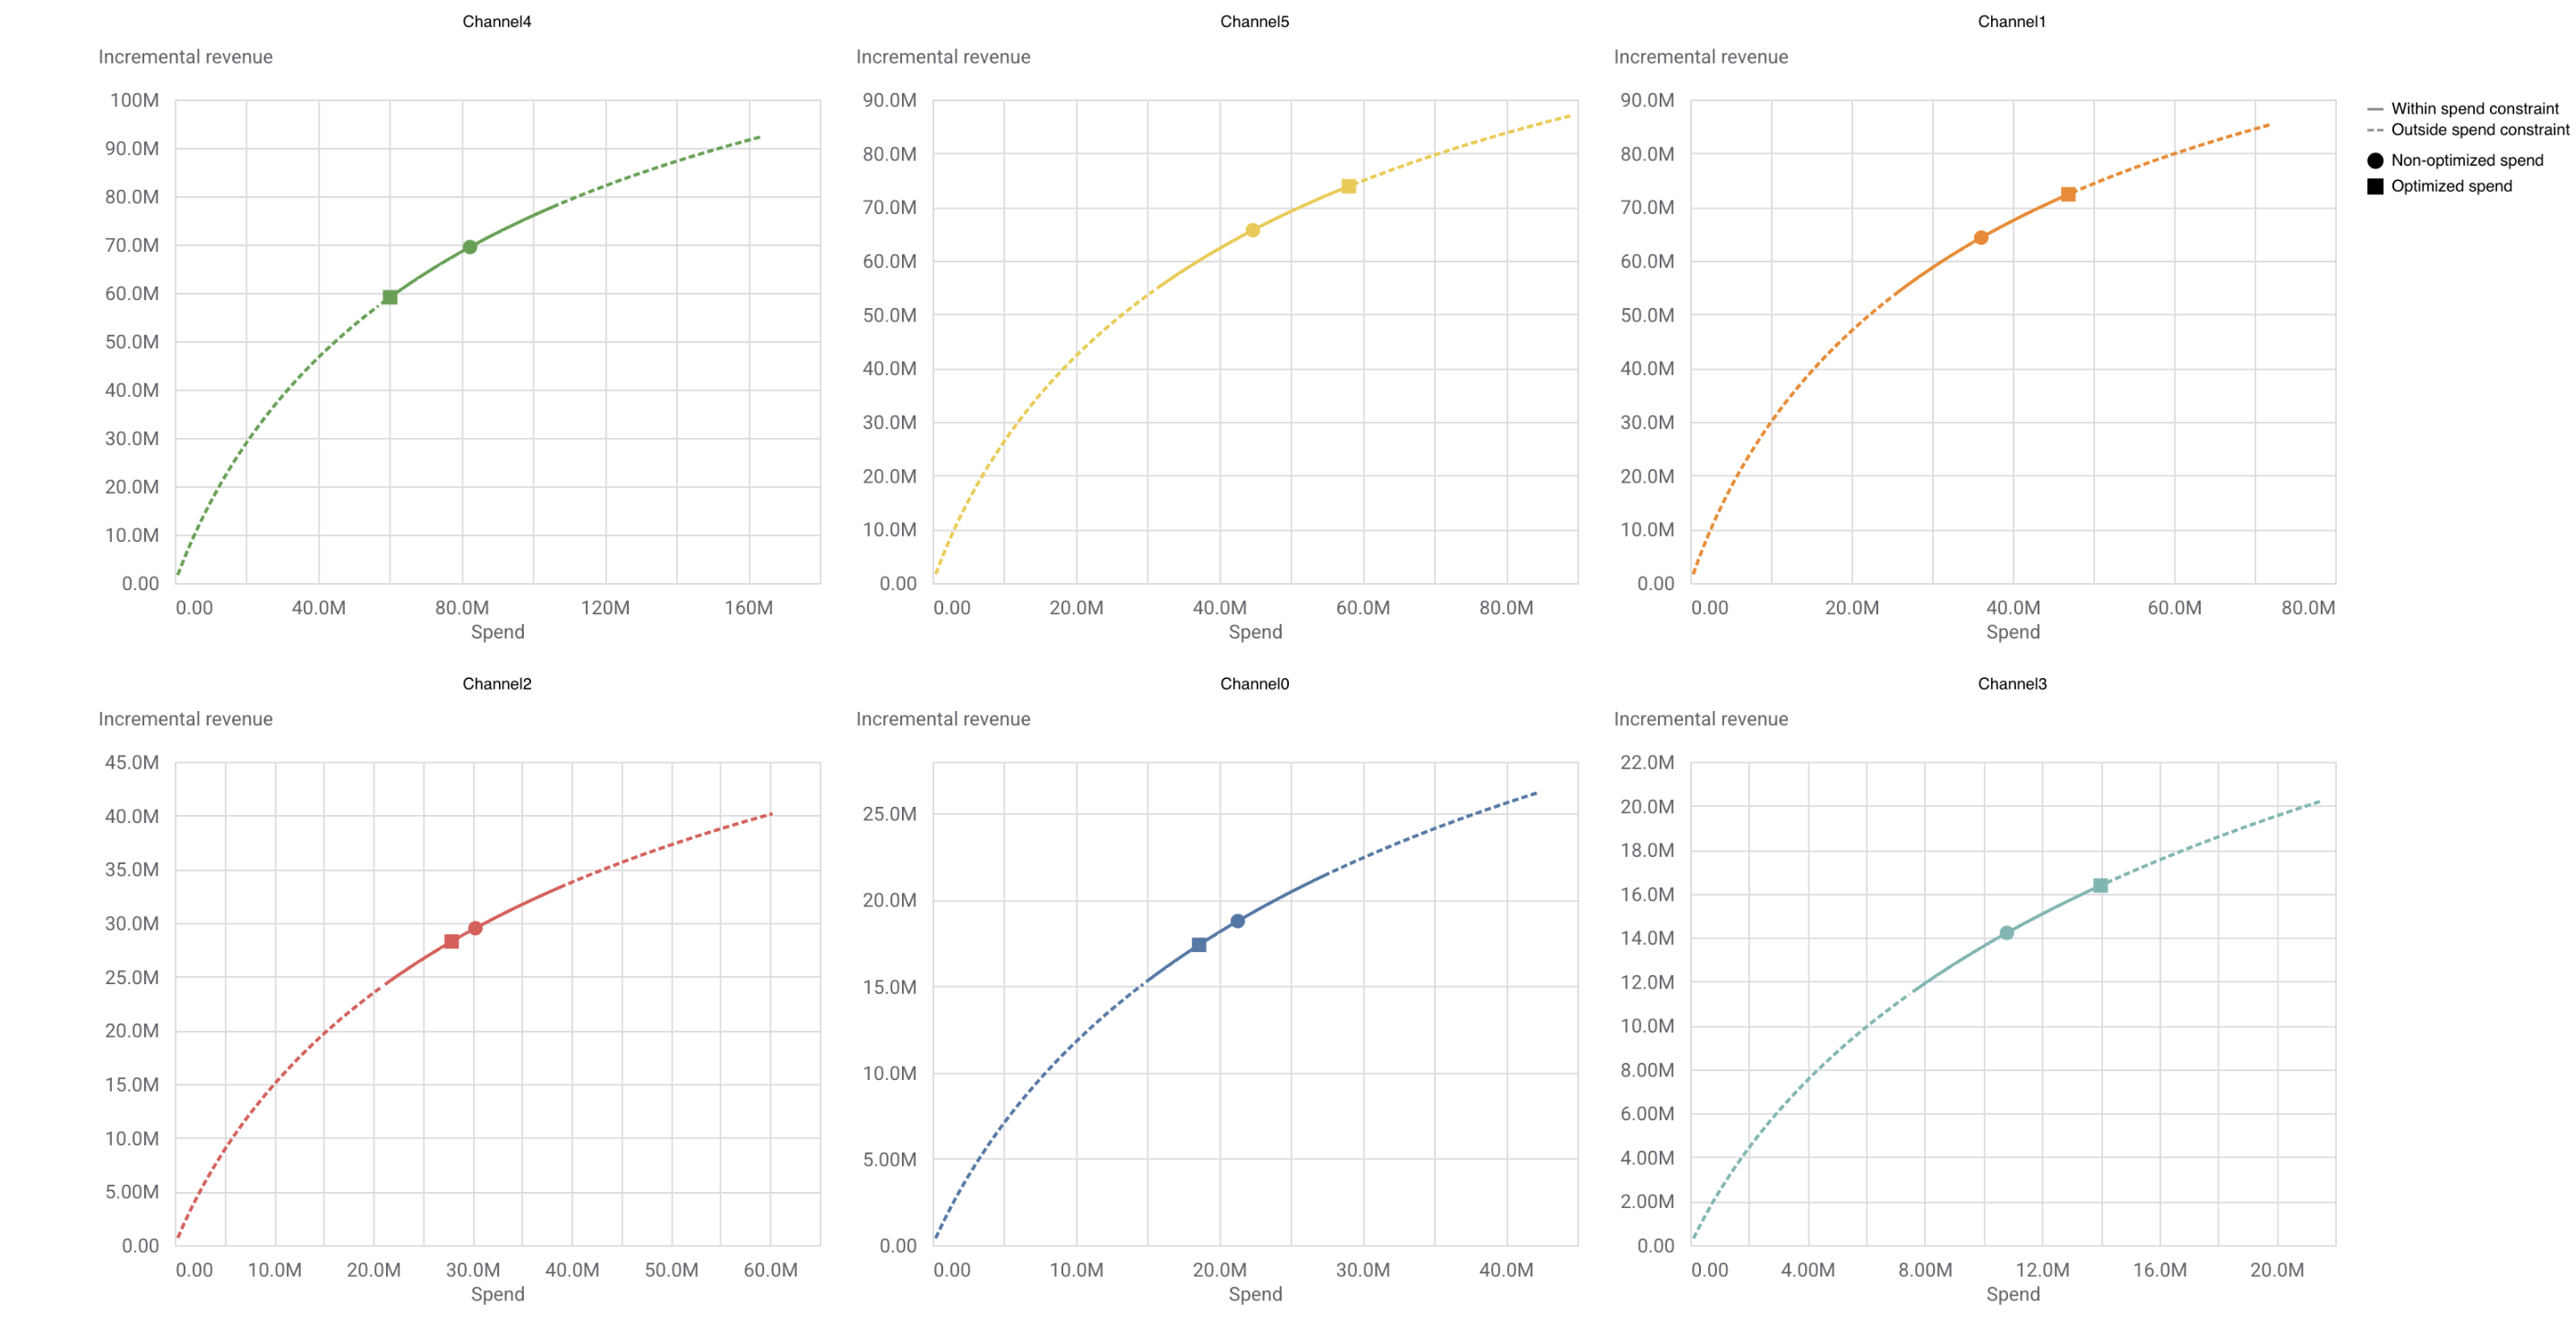
[[["易于理解","easyToUnderstand","thumb-up"],["解决了我的问题","solvedMyProblem","thumb-up"],["其他","otherUp","thumb-up"]],[["没有我需要的信息","missingTheInformationINeed","thumb-down"],["太复杂/步骤太多","tooComplicatedTooManySteps","thumb-down"],["内容需要更新","outOfDate","thumb-down"],["翻译问题","translationIssue","thumb-down"],["示例/代码问题","samplesCodeIssue","thumb-down"],["其他","otherDown","thumb-down"]],["最后更新时间 (UTC):2026-05-25。"],[],["The `OptimizationResults` object provides plotting methods for visualizing optimization data. Key actions include using `plot_spend_delta()` to compare current vs. optimized spend per channel, `plot_incremental_impact_delta()` to visualize changes in incremental revenue/KPI, and `plot_budget_allocation()` to see the optimized budget distribution across channels. `plot_response_curves()` visualizes potential revenue changes with budget increases, highlighting current and optimized spend levels within set constraints. Each function generates a visualization output.\n"]]