
Page Summary
-
Google's Aerial View provides synthetic, drone-like videos offering a bird's-eye perspective of locations, enhancing user experiences across real estate, travel, and retail industries.
-
This article guides businesses in creating a comprehensive measurement strategy to assess Aerial View's impact on user engagement and lead generation through A/B testing and data analysis.
-
Implementing a measurement plan involves defining objectives, identifying key metrics, setting up A/B tests with control and variant groups, collecting quantitative and qualitative data, and analyzing results.
-
Businesses should consider potential risks, such as operational and service-level impacts, and establish guardrail metrics to monitor performance.
Overview
Short form video formats are widely used today because they hold a users' attention for longer periods of time. With this in mind, Google combined the power of short form video with 3D imagery to develop Aerial View; a synthetic drone-like video of a place, landmark or POI offering a birds-eye view of the location.
This creates a host of interesting applications in various industries like:
- Real Estate - Allowing potential buyers and renters to understand additional information about a property and its neighborhood like proximity to a park or a freeway aiding in an informed decision.
- Travel - Allowing tourists to better understand the surroundings of a new location like proximity to restaurants and museums aiding in better trip planning
- Retail - Allowing customers to understand parking facilities , nearby restaurants etc.
Assessing the business impact of new user experiences is always challenging. Hence we recommend businesses do their due diligence and design a comprehensive measurement strategy. To assist businesses with this challenge, this article provides guidelines that can help you create a measurement plan tailored to your goals.
Business Impact Measurement Strategy
A successful measurement strategy for Aerial View begins by asking the right set of questions that spans the following 4 key areas.
| Objectives | Success Metrics | Data Collection | Risks |
|---|---|---|---|
| How do I expect Aerial View to help my business ? What are the key hypotheses I want to test to help me realize my goal ? |
What benchmarks do I use today to measure success? Which other media assets do I use on my website and how do I view their success ? |
How can I programmatically validate my hypothesis? How can I collect and report test data ? |
Does the introduction of Aerial View negatively affect my customer user journey? Are there guardrail metrics I need to monitor? |
Example - Real Estate business - Let's use the above principles to showcase what a measurement plan would look like for a Real Estate business interested in deploying Aerial View on their website. \
Objectives:
Based on customer feedback, we see Aerial View benefiting Real Estate customers in two key areas:
- Augment end user journey - Aerial View can act complementary to Street View or other media assets like photos / 3D tours on a property details page. They provide the user with additional information about the property and its surroundings creating a visually appealing value proposition.
- Increases qualified leads for businesses - An Aerial View of a property can proactively answer a lot of user concerns like proximity to a beach or a park or the nearest freeway without needing to actually tour a property leaving only the interested ones to go tour a property thereby increasing the probability of signing a lease or contract
Based on these benefits, we recommend setting two objectives: Increase User Engagement and Increase Qualified Leads.
Success Metrics:
Adding Aerial View to a real estate property detail page drives user engagement and leads. Visualizing these metrics as a funnel will be critical in determining the return on investment (ROI) that Aerial View can generate for your business.
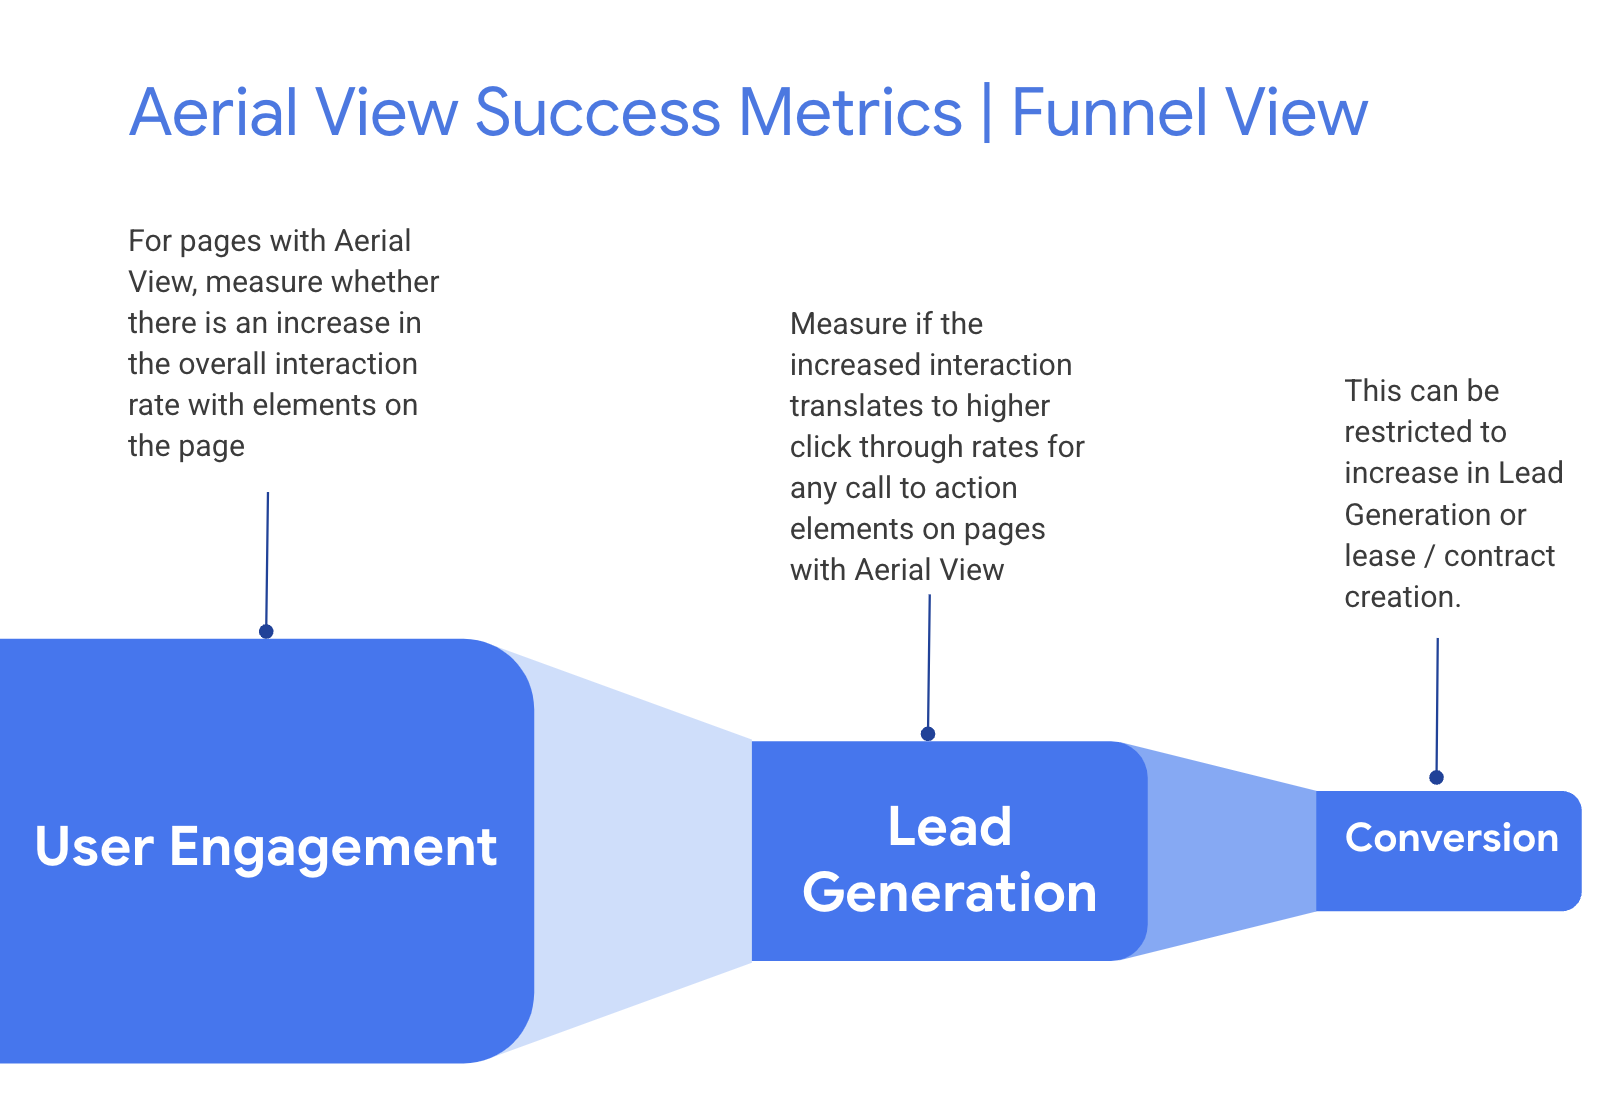
- Upper funnel metrics - Aerial View videos capture user attention, leading to increased user engagement.
| Metric | Description | |
|---|---|---|
| 1 | Interaction Rate with 1+, 2+ , 3+ Aerial View videos | Measure number of users / sessions that engage with >=1 Aerial View videos within the same visit |
| 2 | Interactive Elements Usage | If the page includes elements like 3D Tours, street view etc, track how often users engage with these features. |
| 3 | Shares / Saves | Track number of users saving the property as a favorite or sharing it on social media platforms |
| 4 | Time on Page | Measure the average time spent by a user to view a property supported by an Aerial View |
| 5 | Bounce Rate | Measure the number or users / sessions that exit the site after seeing one page only. |
- Lower funnel metrics - The actions taken by a user post viewing an Aerial View video that drive towards the intended goal will be summarized as Lead Generation metrics
| Metric | Description | |
|---|---|---|
| 1 | Lead Generation Rate (Click through rate) | Measure # users / sessions that click on the various call to Actions like Requesting a Tour / Emailing an agent etc |
| 2 | Lead Conversion Rate |
Measure leads that are converted into contracts and calculate it as a percentage of leads generated. |
- Comparative Analysis - To assess the effectiveness of Aerial View it is
important to collect benchmark data for the primary metrics mentioned above
that are both unique to your business as well as widely used across the
industry and conduct a comparative analysis. A few examples are:
- Collect average engagement data for Google Street View, 2D photos, virtual tours etc
- Collect conversion data for both qualified and unqualified leads
- To further fine tune your measurement consider collecting benchmarks that span other factors such as property distribution across - Urban v/s Rural geographies - MultiFamily v/s Single Family Homes - Premium v/s non premium markets
Data Collection
Here is where the fun begins. This section talks about designing a testing framework that can help you assess Aerial View technology for your business.
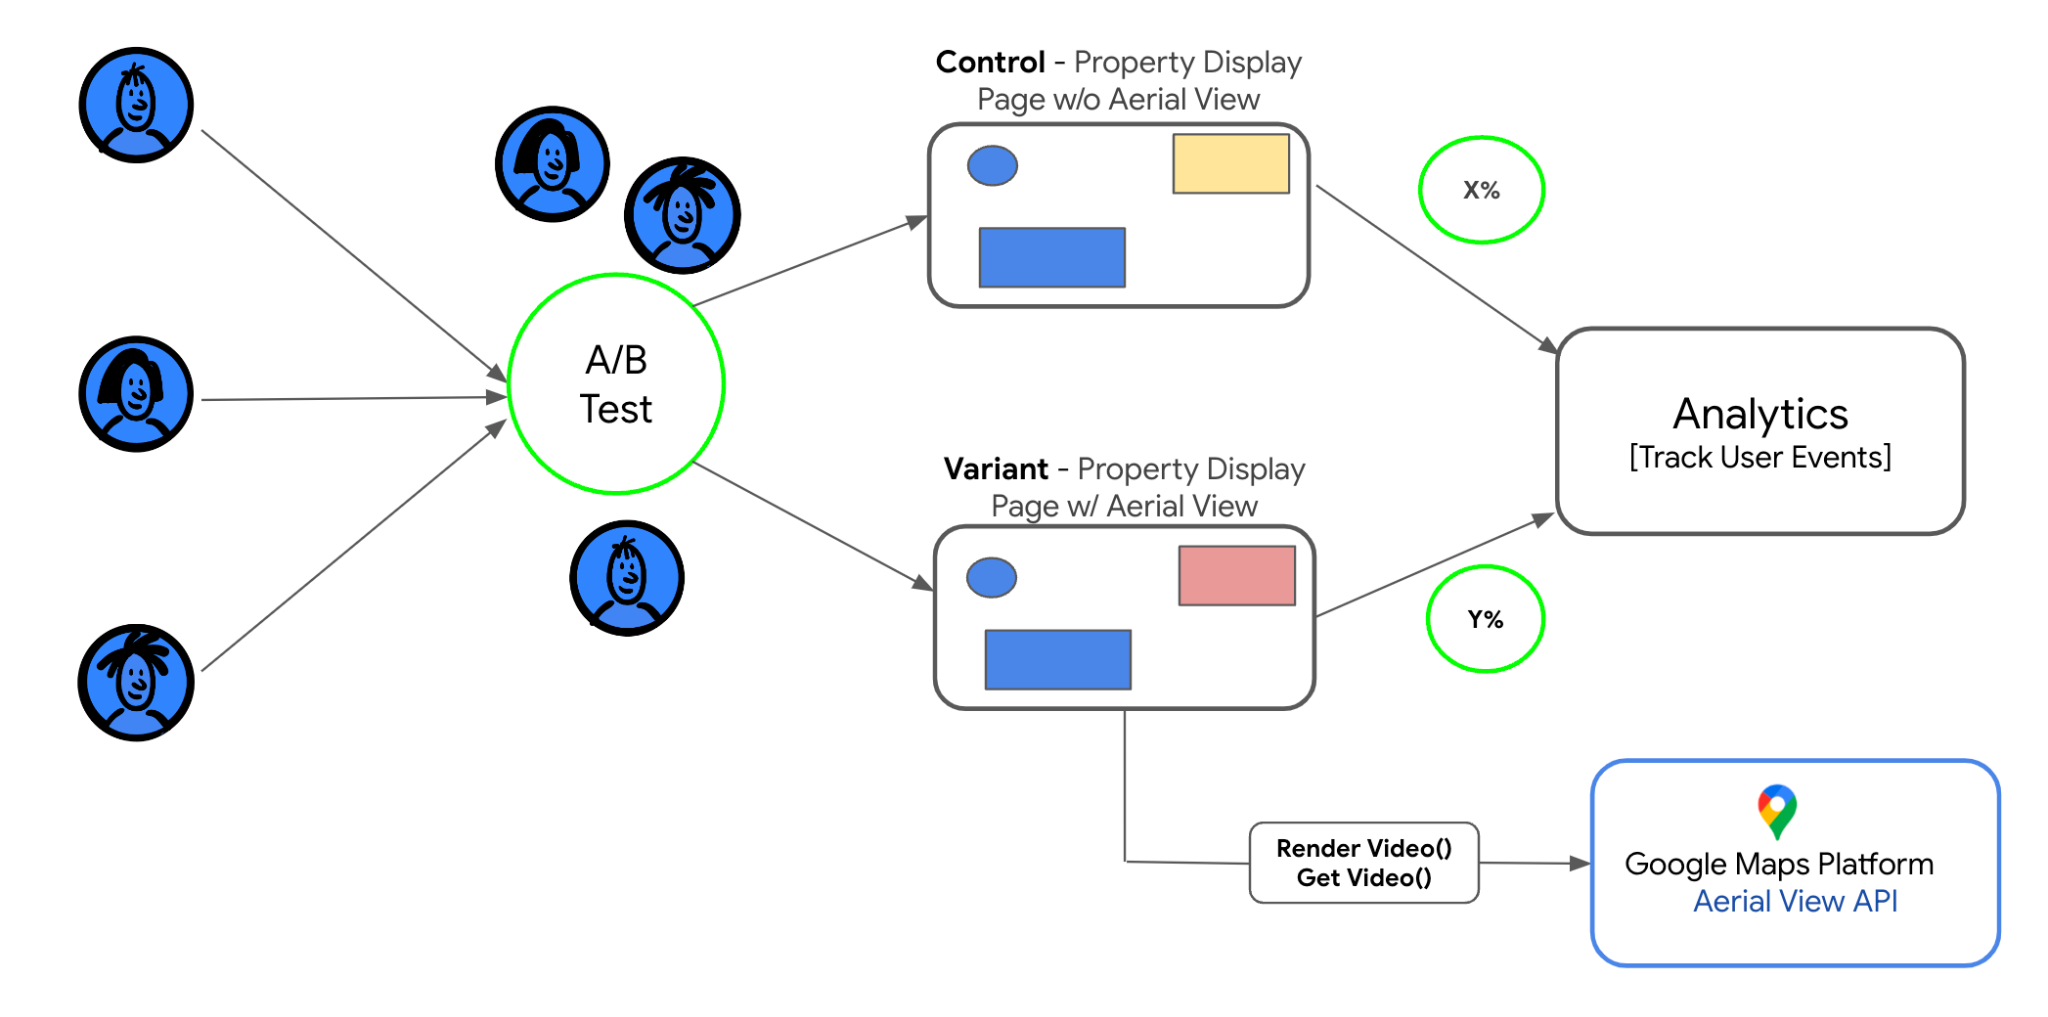
We recommend setting up an A/B test to compare two versions of your website to help you evaluate the effectiveness of Aerial View videos in driving engagement and conversion metrics discussed above.Learn More on A/B testing
Setting up a A/B test involves the following steps:
Hypothesis to Test
Pick one or more of the following or choose one that is more applicable to your use case
- Aerial View leads to higher user engagement.
- Aerial View leads to higher lead generation.
- Aerial View helps in higher customer satisfaction.
- Aerial View helps in better customer retention. (for rental markets where customers are property managers)
Identify Test Groups
An A/B test consists of two groups
- Control - For our use case these will be the properties that do not have an aerial view video attached to it.
- Variant - These will be properties that will have an aerial view video attached to it in addition to all the other media types available for Control group.
To get a statistically significant result , we recommend a testing pool size of around 5% to 20% of the total properties listed on the website as a reasonable starting point
Test Type
There are two ways to carry out this A/B test.
- True A/B test - In this scenario you will need to create an additional landing page for the property in question and assign it to the variant group. Here users of both the control and variant will see the same property in question so it will be easier to analyze the result but will increase the cost of the test as it needs development resources.
- Differentiated A/B test - In this scenario you can choose relatively similar properties in terms of their demographic characteristics , location , traffic volume and other characteristics and split them into control and variant. Upfront cost to run this test is relatively low as you don't have to create a new landing page however the results in this case will be influenced by several factors besides the Aerial View video which might lead to confusion.
Implement the Test
Display property listings to the respective groups according to the assigned
conditions. There are several solutions that can help you perform this test and
analyze the data effectively. Some examples are
Optimizely
, Google Optimize,
Adobe Target.
Few factors to keep in mind:
- Allow a gradual ramp up to ensure no performance glitches.
- Allow for graceful failures in the event of non availability of a video or API endpoint.
- For a true A/B test use a A/B test manager to randomly divide the traffic between Control and Variant.
Track Data
- Quantitative Data - Instrument the Variant version of the web page with functionality to track the metrics described in the Success Metrics section. If you currently do not have web tracking instrumented ; consider using a free tool like Google Analytics that has out of the box tracking for many of the metrics mentioned in question.
- Qualitative Data - To get a well rounded assessment on Aerial View we also recommend offline feedback from both partners ( property managers in case of rental properties ) and end users through email campaigns , in product surveys , 1:1 outreach etc.
Analyze the Result & Draw Conclusions
Now that the test is over, conduct a statistical analysis to compare the
performance of the two groups. Assess if the metrics captured for the variant
outperformed the control.You can use one of the tools mentioned above to do this
or you could simply export the results into a spreadsheet.
If the test is inconclusive, reassess the strategy and consider other factors
that might influence engagement and conversion rates.
Risks
While introducing any new technology onto a webpage it is important to identify guardrail metrics that help establish limits or boundaries for acceptable performance levels within a specific context. Below are a few we recommend to keep in mind while deciding on adopting Aerial View for your business:
- Operational Metrics - Ensure page load times, error rates, page performance etc aren't affected negatively.
- Service Level Metrics - Ensure Aerial View doesn't lead to more down times than usual.
- Quality Control Metrics - Ensure Aerial View videos are rendered at the desired resolution on all devices at various network speeds.
Conclusion
We hope that through this guide we have given you enough insight in creating a comprehensive measurement plan that can generate the required data driven evidence for you to make an informed decision about Aerial View adoption. Visit our developer documentation to commence your Aerial View journey. Happy Testing!
Next Steps
Suggested further reading
Contributors
Principal Authors
Neerav Mehta | Google Maps
Platform Growth Lead
Sarthak Ganguly | Google Maps
Platform Solutions Engineer