After you collect your data, perform an exploratory data analysis (EDA) to find and address any data quality issues. This is a critical step in the marketing mix modeling (MMM) process because it lets you assess the data to confirm that it accurately represents the marketing efforts, customer responses, and other relevant metrics. By correcting issues discovered through the EDA process, you can improve the reliability of the model output.
The basic process for performing an EDA is:
- Run a data review to identify any missing or incomplete data.
- Fix missing values in your raw input files.
- Evaluate the accuracy of the data.
- Correct any anomalies, outliers, or inaccuracies in the data.
- Check the correlation between your KPI, media, and control variables.
Meridian's EDA package
Meridian's EDA package helps in this process by generating an exploratory data analysis (EDA) HTML report that you can export to your Google Drive. This HTML report provides visualizations and data checks to help you identify common potential data issues. Each check or visualization includes a statement describing the data issue and corresponding actionable items.
Findings are categorized into one of three severity levels:
- ERROR: Identifies extremely severe data issues that will very likely
prevent model convergence. Strict default thresholds are used for the
ERRORstatus to ensure that only the most extreme errors – which are usually data input errors – are flagged. Posterior sampling is blocked until you resolve these issues. - ATTENTION: Identifies potential significant data issues. While these issues might not strictly prevent model convergence, they strongly indicate areas you should investigate and potentially correct. Because certain use cases may still warrant running the model, Meridian allows posterior sampling to proceed. However, you should apply your business context to determine whether it is appropriate to continue with your current data.
- INFO: Indicates that no
ERRORorATTENTIONstatuses were triggered, or highlights checks that don't have defined thresholds. While you can reasonably expect to fit a useful model under these conditions, you should still review theINFO-level metrics and visualizations to help identify any underlying data anomalies or inconsistencies.
The EDA HTML output organizes data issues into five categories:
- Spend and media unit: Analyzes channel-level spend share and cross-checks spend against media units.
- Individual explanatory or response variables: Investigates the variability of individual variables, flagging issues like zero standard deviation (lack of variation) or extreme outliers.
- Population scaling of explanatory variables: Evaluates the relationship between population and explanatory variables.
- Relationship among the variables: Explores correlations among variables, as well as relationships between explanatory variables and time or geo main effects.
- Prior specifications: Assesses prior specifications, specifically the prior probability of a negative baseline.
Setup and report generation
Use the following steps to generate the EDA HTML report or run the individual data checks described in this document.
First, instantiate the
Meridianmodel and theMeridianEDAobject. Run the following setup code once:from meridian.model import model from meridian.model.eda import meridian_eda mmm = model.Meridian(...) mmm_eda = meridian_eda.MeridianEDA(mmm)Note: Subsequent code snippets on this page omit this setup and only display the specific method calls using the
mmm_edaobject.Once the setup is complete, run the following code to generate and save the full EDA HTML report:
import IPython

mmm_eda.generate_and_save_report(
    filename=your_filename, filepath=your_filepath
)
IPython.display.HTML(filename=f'{your_filepath}{your_filename}')
Category 1: Spend and media unit
This category analyzes channel-level spend share and cross-checks spend against media units.
Spend share
Example output:
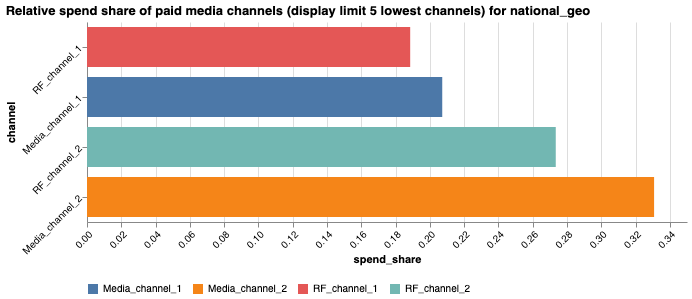
The bar chart on the HTML report displays the percentage of national-level spend (aggregated across geos for geo-level models) for each media and RF channel for the bottom 5 channels by spend.
Review each channel's share of total spend. Channels with a very small spend share can be difficult to estimate; consider combining them with other channels.
You can also plot the spend share for specific geos and for a given number of channels with the lowest spend share:
mmm_eda.plot_relative_spend_share_barchart(
    geos=<list_of_geos>, n_channels=<your_integer_choice>
)
Data-to-parameter ratio
After reviewing the spend-share breakdown, evaluate the ratio of data points to model parameters. This ratio serves as a rough guideline for the amount of data needed to reliably estimate the model parameters. The most accurate way to assess this ratio is to run the model and evaluate the width of the credible intervals.
The ratio is defined as n_data_points / n_parameters, where:
n_data_points=n_geos*n_timesn_parameters=n_geos- 1 +n_knots+n_controls+n_treatments
The components of this calculation include:
n_geos: The number of geos in the dataset. We subtract one for the baseline geo.n_times: The number of time periods.n_knots: The number of knots specified using theknotsargument inModelSpec.n_controls: The number of control variables.n_treatments: The total number of treatment variables, including paid media, organic media, paid RF, ORF, and non-media treatments.
This calculation excludes separate geo-level parameters for n_treatments
and n_controls. In Meridian's hierarchical model, geo-level effects are
not independent; sharing information across geos significantly reduces the
effective parameter count. The national-level count serves as a practical,
lenient baseline. For a comparison with a strict view that assumes no
pooling, see the Amount of data needed section.
A very small ratio may indicate insufficient data for estimation, which leads to
high variance and unreliable estimates. If this occurs, consider dropping or
combining channels, or reducing the number of knots using the knots argument
in ModelSpec. When deciding which channels to modify, use the insights
gained from the Spend share
subsection to identify those with the smallest spend.
For more information on data requirements and geo hierarchical modeling nuances, see Amount of data needed.
Spend, media unit and cost per media unit
For media and RF channels, cross-checks are performed on the spend, media units, and cost per media unit. The media units analyzed here are raw (unscaled) media units. For RF channels, media units are RF impressions, calculated as raw (unscaled) reach multiplied by frequency.
These cross-checks identify inconsistencies between spend and media unit data,
such as zero spend with positive media units, or positive spend with zero
media units. If inconsistencies are found, an ATTENTION status is flagged.
Review the data input for these flagged paid media channels and their spend.
This check also flags an ATTENTION status if there are outliers in the cost
per media unit (calculated as spend divided by media units). Meridian's EDA
package defines an outlier using the interquartile range (IQR) rule-of-thumb:
values smaller than Q1 - 1.5 * IQR or larger than Q3 + 1.5 * IQR. The HTML
table displays the absolute values of the cost per media unit for the top five
most extreme outliers, ranked in descending order. Check these channels for
potential data input errors.
You can run the following code to retrieve the computed cost per media unit of all media and RF channels at each time period (and for each geo in geo models):
# For geo models
[geo_cpm] = mmm_eda.geo_cost_per_media_unit_check_outcome.get_geo_artifacts()
geo_cpm.cost_per_media_unit_da

# For national models
[national_cpm] = (
    mmm_eda.national_cost_per_media_unit_check_outcome
    .get_national_artifacts()
)
national_cpm.cost_per_media_unit_da
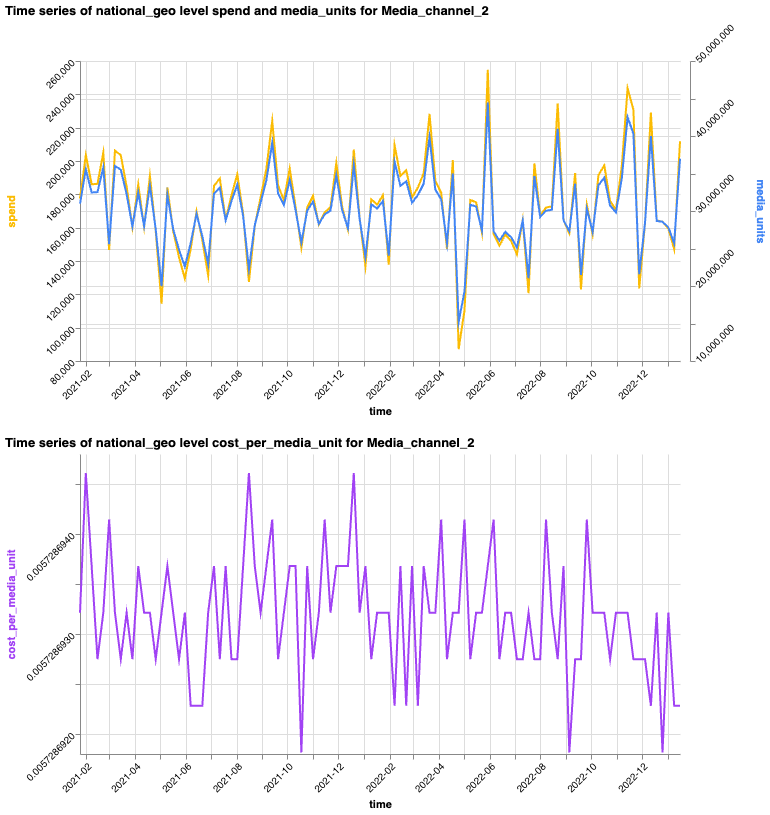
The HTML report also includes two time series plots for channels flagged with an
ATTENTION status (either for inconsistencies or outliers). The first plot
overlays the channel-level time series of spend with the time series of media
units. The second plot shows the channel-level time series of cost per media
unit. Each time series plot is for one channel.
These HTML time series plots are based on national-level quantities. For
geo-level datasets, cost and media units for each channel are aggregated to the
national level before calculating the cost per media unit ratio. If no
ATTENTION statuses are flagged, these plots won't appear on the EDA HTML
report.
Example output:
You can plot the time series of spend, media units, and cost per media unit for specific channels and geos to focus on a subset of your data:
mmm_eda.plot_cost_per_media_unit_time_series(
    geos=<list_of_geos>, channels=<list_of_channels>
)
Note: If the user's spend data lacks time or geo dimensions, it is automatically allocated across those dimensions in proportion to the media units. This results in a constant cost per media unit, and no inconsistencies would occur between spend and media units. Consequently, these specific data checks will always pass.
Category 2: Individual explanatory or response variables
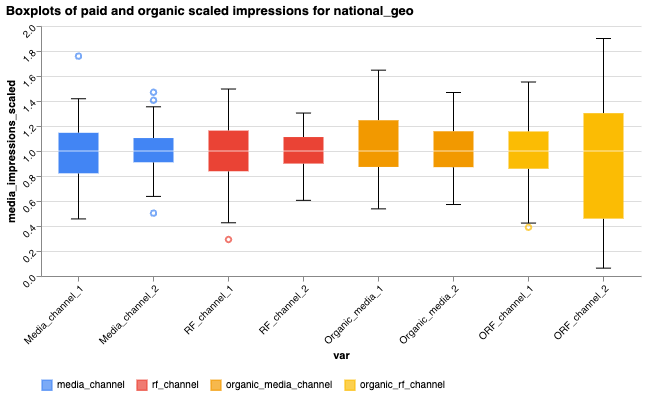
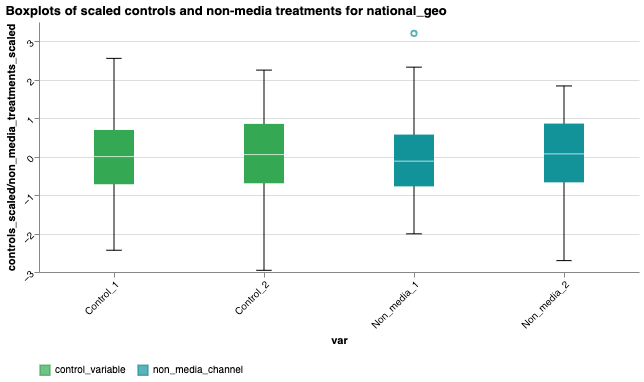
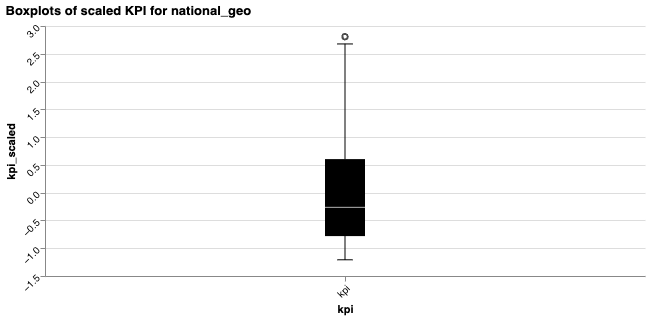
We illustrate the variation of each variable with boxplots.
The charts group the variables as follows:
- Paid and organic scaled impressions: Displayed together in one chart, as they undergo the same transformations detailed in the Input data documentation. These include scaled RF impressions for RF and ORF channels, where scaled RF impressions are calculated as scaled reach multiplied by frequency.
- Scaled controls and non-media treatments: Displayed together in a separate chart, as these variables are transformed in a similar manner.
- Scaled KPI: Displayed in its own boxplot.
For geo-level datasets, Meridian's EDA package first aggregates the raw (unscaled) variables to the national level, then transforms the variables according to the Input data documentation, and then plots the boxplots.
Review the variability of the explanatory variables and response variables shown in the boxplots. Explanatory variables with very low variability can be difficult to estimate and may hinder model convergence. Consider merging or replacing them, dropping negligibly small variables, or using a custom prior if you have relevant information. If outliers are present, verify your data input to ensure they are genuine and not erroneous.
Example output:
You can plot boxplots for specific geos:
# For paid and organic scaled impressions
mmm_eda.plot_treatments_without_non_media_boxplot(geos=<list_of_geos>)

# For controls and non-media treatments
mmm_eda.plot_controls_and_non_media_boxplot(geos=<list_of_geos>)

# For KPI
mmm_eda.plot_kpi_boxplot(geos=<list_of_geos>)
Critical lack of variation
The standard deviation of the transformed KPI is computed across all geos and
times for a geo model, or across all times for a national model. An
ERROR is triggered when the transformed KPI is almost completely constant,
indicated by a standard deviation less than 1e-4. This means no signal in the
response variable. You should check for data input errors, or reconsider the
feasibility of statistical modeling with this dataset.
For the explanatory variables, Meridian first calculates the standard deviation of scaled controls and scaled treatment variables (including scaled reach for RF and ORF channels) along the time dimension and geo dimension (if applicable) separately.
- Variation across geo: The standard deviation of the scaled variables
along the geo dimension is assessed only for geo-level datasets, because a
national model only has one geo. An
ERRORstatus occurs when you have setknots = n_timesand a variable doesn't vary across geos (for example, a national-level variable in a geo-level dataset). Whenknots = n_times, each time period has its own knot parameter. Because a national-level variable varies only across time and not across geos, it is perfectly collinear with time and redundant in a full-knot model. To resolve this redundancy, you can either: (1) keep the national-level variable and setknots < n_times, or (2) drop the variables that don't vary across geos. The choice depends on your specific interpretation goals. - Variation across time: For a geo model, an
ERRORstatus occurs when a variable does not vary across time, as it becomes perfectly collinear with the geo main effect $\tau_g$. Because this redundant variable leads to poor model convergence, you should drop any variable that does not vary across time. For a national model, a variable that does not vary across time acts as a constant term that provides no signal and hurts model convergence. AnERRORstatus will occur, and you should drop this constant variable from the model.
Outliers and potential data sparsity
Meridian's EDA package also checks for outliers in each scaled treatment, scaled control variable, and scaled KPI (this check occurs at the geo level for geo-level datasets) using the standard interquartile range (IQR) rule-of-thumb.
If outliers are present, this check flags an ATTENTION status and displays the
top five most extreme outliers (based on absolute value) in the EDA HTML report.
You should verify your data input to ensure these values are genuine and not
erroneous.
Independent of flagging the outliers, this check also assesses potential data
sparsity by computing the standard deviation of each variable both with and
without these outliers. If the standard deviation drops to zero after removing
the outliers — meaning the variable only shows variation because of the
outliers — this check flags an additional ATTENTION status.
- If treatment or control variables show a zero standard deviation after outlier removal, this may be an indication of data sparsity. While this may be intentional (e.g., data sparsity due to 'go dark' periods), it can impact model convergence and identifiability. Verify if this is by design. If not, consider aggregating these variables to improve model stability.
- If the KPI has a zero standard deviation in certain geos after removing outliers, it indicates a weak or non-existent signal in the response variable for those locations. Review the input data, or consider grouping these geos together.
You can retrieve the standard deviations for each variable (which are computed for specific geos in geo models) and map them into a dictionary for ease of access using the following code:
# For geo models
geo_std = mmm_eda.geo_stdev_check_outcome.analysis_artifacts
geo_std_dict = {a.variable: a.std_ds for a in geo_std}

# For national models
national_std = mmm_eda.national_stdev_check_outcome.analysis_artifacts
national_std_dict = {a.variable: a.std_ds for a in national_std}
Category 3: Population scaling of explanatory variables
This category applies only to geo-level datasets. For national-level datasets, the single (national) geo is treated as having a nominal population of 1.0, and population values don't affect the model because Meridian's internal scaling (median scaling or standardization) cancels out the national population effect.
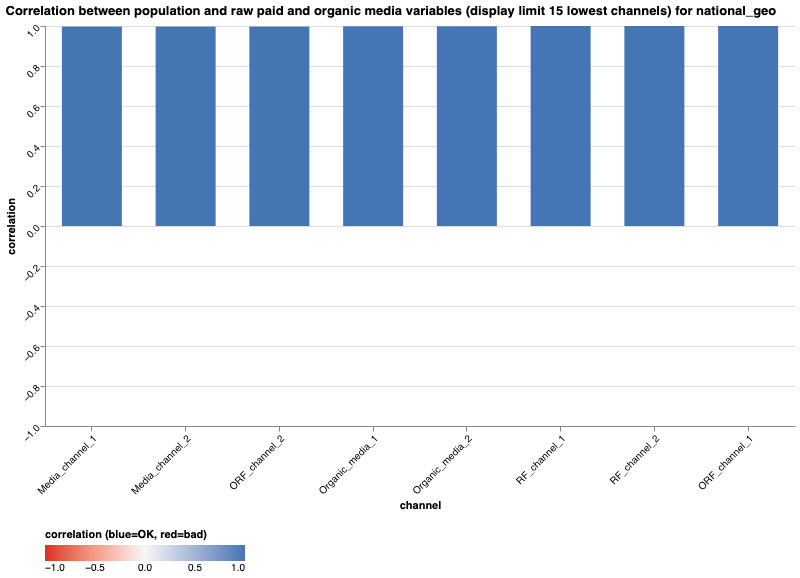
Correlation between population and raw paid or organic media variables
This check evaluates the Spearman correlation between geo population and raw paid or raw organic media variables. These variables include raw media units, raw reach (for RF channels), raw organic media units, and raw organic reach (for ORF channels). We evaluate the Spearman correlation here to assess the loglinear relationship between population and these variables.
You should expect positive Spearman correlation values for these variables. If
you observe a low or negative correlation, check your data input. Meridian's EDA
package labels these checks as INFO only, without triggering ERROR or
ATTENTION statuses, but reviewing the values is highly recommended.
Example output:
You can retrieve the correlation values for each of these aforementioned variables using the following code:
[pop_corr_raw] = (
    mmm_eda.eda_engine.check_population_corr_raw_media()
    .get_overall_artifacts()
)
pop_corr_raw.correlation_ds
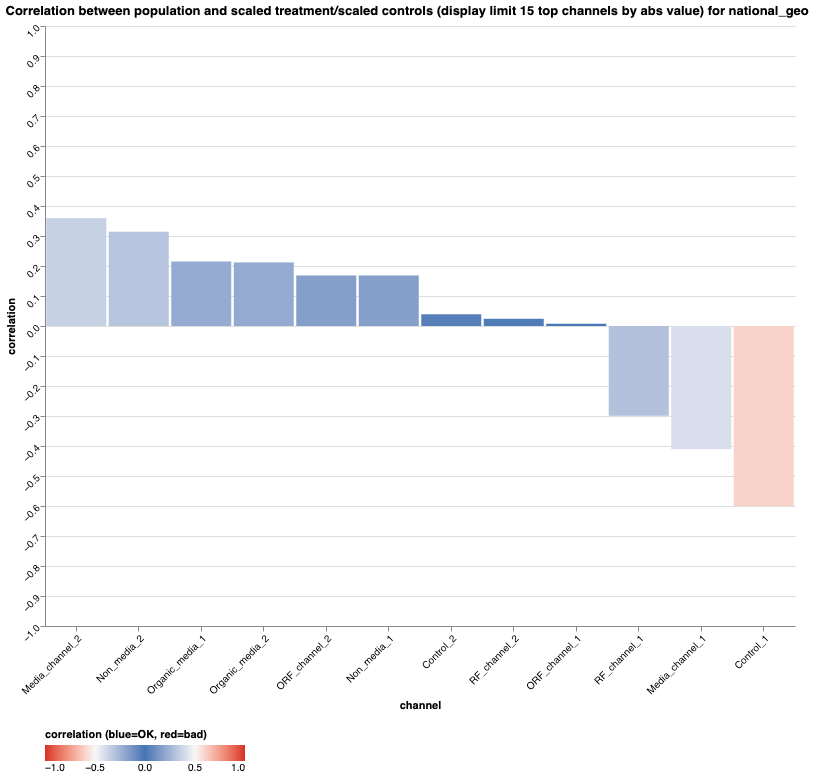
Correlation between population and scaled treatments and controls
The scaled treatments and controls here refer to the transformed quantities
according to the Input data
documentation. For the non-media treatments and controls, they also depend on
the non_media_population_scaling_id and control_population_scaling_id
arguments in ModelSpec respectively. Review the Spearman correlation between
population and scaled treatment units or scaled control variables.
- Controls and non-media channels: Meridian doesn't population-scale these
variables by default. A high correlation indicates you should likely apply
population scaling using the
control_population_scaling_idornon_media_population_scaling_idarguments inModelSpec. For more information, see Population scaling control variables. - Paid and organic media channels: Meridian automatically population-scales these channels by default. A high correlation here suggests the variable might have already been population-scaled before being passed into Meridian. Verify your data input pipeline.
Like the previous check, this check is flagged as INFO only, but you should
review the values.
Example output:
You can retrieve the correlation values using the following code:
[pop_corr_scaled] = (
    mmm_eda.eda_engine.check_population_corr_scaled_treatment_control()
    .get_overall_artifacts()
)
pop_corr_scaled.correlation_ds
Category 4: Relationship among the variables
This category explores correlations among variables, as well as relationships between explanatory variables and time or geo main effects.
Correlation heatmap
High pairwise correlation among variables can cause model identifiability and convergence issues. If you observe high correlation, consider combining the affected variables.
Example output:
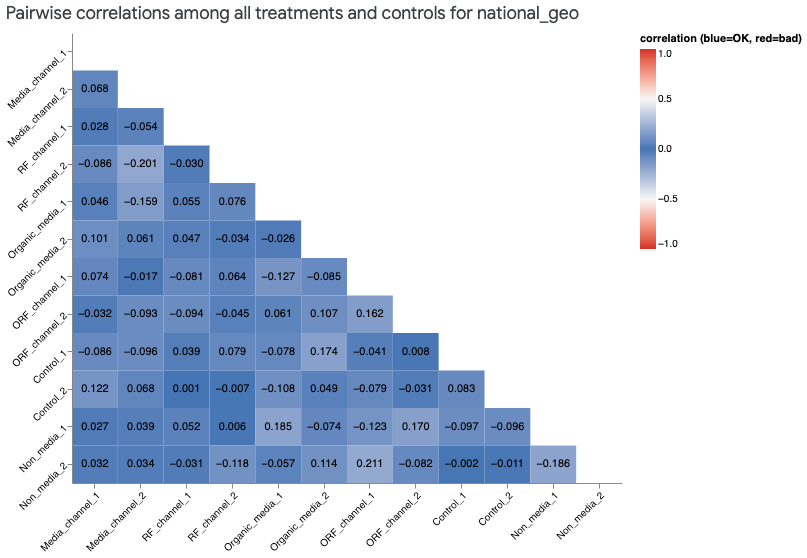
The heatmap illustrates the Pearson correlation between scaled treatments and scaled control variables. Scaled treatments include scaled RF impressions for both RF and ORF channels. The scaled treatments and controls here refer to the transformed quantities according to the Input data documentation. The HTML heatmap displays correlations based on national-level scaled variables. For geo-level datasets, the raw (unscaled) variables are aggregated to the national level, then transformed, and then their pairwise correlation is computed.
You can use the following code to plot the correlation heatmap for any specific geo:
mmm_eda.plot_pairwise_correlation(geos=<list_of_geos>)
Multicollinearity using Variance Inflation Factor (VIF) check
To further assess multicollinearity, the Variance Inflation Factor (VIF) is computed for all scaled treatment units and scaled control variables. The VIF estimates how much the variance of a treatment or control variable is inflated due to collinearity with other treatments or controls. A VIF of 1 indicates no collinearity, while higher values indicate increasing multicollinearity. Perfect pairwise correlation is a common cause of multicollinearity. High multicollinearity widens the credible intervals of coefficients, making posterior inference less reliable.
Depending on the model type, the VIF check evaluates the data and triggers the following statuses:
Geo-model
ERRORstatus: For geo models, the VIF is calculated across all geos and times. Specifically, the values for each variable at all geos and times are flattened into a single array, and then the VIF is calculated for each of these flattened arrays. AnERRORstatus is triggered if any variable can be expressed almost perfectly as a linear combination of others, demonstrated by a VIF that exceeds the default overall threshold of 1000. To address this, drop variables that are linear combinations of others, or consider combining them.You can retrieve the geo model's overall VIFs (computed across all geos and times) using the following code:
[overall_vif] = mmm_eda.eda_engine.check_geo_vif().get_overall_artifacts()
overall_vif.vif_da
National-model
ERRORstatus: For national models, the VIF is calculated across all times, as there is only one geo. AnERRORstatus is triggered if a variable's VIF exceeds the default national threshold of 1000. To address this, drop variables that are linear combinations of others, or consider combining them.You can retrieve the computed VIFs for the national model using the following code:
[national_vif] = mmm_eda.eda_engine.check_national_vif().get_national_artifacts()
national_vif.vif_da
Geo-model
ATTENTIONstatus: For geo models, the VIF is also calculated across all times for each specific geo. AnATTENTIONstatus is raised if variables exceed the default geo threshold of 1000 within individual geos. To address this, check the data or combine these variables, especially if they show high VIF across multiple geos.You can retrieve the geo model's VIFs for individual geos using the following code:
[geo_vif] = mmm_eda.eda_engine.check_geo_vif().get_geo_artifacts()
geo_vif.vif_da
You can tune these extreme thresholds if necessary. For more details on how to set these thresholds, see Custom VIF threshold.
When any of these ERROR or ATTENTION statuses are triggered, the HTML report
tabulates the top five variables with the largest VIF and lists the other
variables they highly correlate with.
Collinearity with geo main effect $\tau_g$
This check regresses each variable against geo as a categorical variable. In
this case, high R-squared indicates low time variation of a variable. This could
lead to a weakly identifiable and non-converging model due to geo main effects.
Consider dropping the variable with very high R-squared. The HTML report
tabulates the top five variables with the largest R-squared values.
This check is INFO level without thresholds to flag ERROR or ATTENTION,
but we recommend that you review the table.
Collinearity with time main effect $\mu_t$
This check regresses each variable against time as a categorical variable. High
R-squared indicates low geo variation of a variable. This could lead to a weakly
identifiable and non-converging model if a large number of knots are used.
Consider dropping the variable with very high R-squared or reducing the knots
argument in ModelSpec. The HTML report tabulates the top five variables with
the largest R-squared values. This check is at the INFO level
(no thresholds to flag ERROR or ATTENTION), but we recommend that you review
the table.
You can retrieve the computed R-squared values for all variables (against geo and time) using the following code:
[mmm_geo_time_collinearity] = (
    mmm_eda.eda_engine.check_variable_geo_time_collinearity()
    .get_overall_artifacts()
)
mmm_geo_time_collinearity.rsquared_ds
Category 5: Prior specifications
This category assesses prior specifications, specifically the prior probability
of a negative baseline. Negative baseline is equivalent to the treatment effects
getting too much credit. Review the prior probability of negative baseline
together with the bar chart for channel-level prior mean of contribution. If the
prior probability of negative baseline is high, consider custom treatment
priors. In particular, a custom contribution prior type may be appropriate.
Example output:
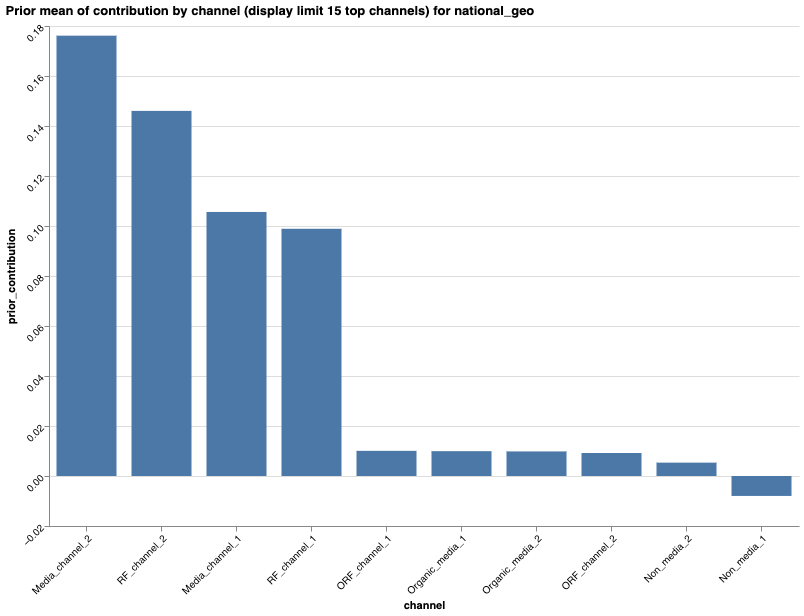
The plot displays only the top 15 channels. You can obtain the prior probability of a negative baseline and the channel-level prior mean of contribution using the following code:
[prior_check] = mmm_eda.eda_engine.check_prior_probability().get_overall_artifacts()

# This returns the prior probability of negative baseline
prior_check.prior_negative_baseline_prob

# This returns the channel-level prior mean of contribution
prior_check.mean_prior_contribution_da
Additional checks, visualizations and customizations
Beyond the HTML report, you can explore additional data diagnostics and custom configurations to tailor the EDA process.
KPI time series with knots
You can visualize the national-level KPI time series superimposed with the knots
specified in your ModelSpec:
mmm_eda.plot_national_kpi_with_knots_time_series()
Example output:
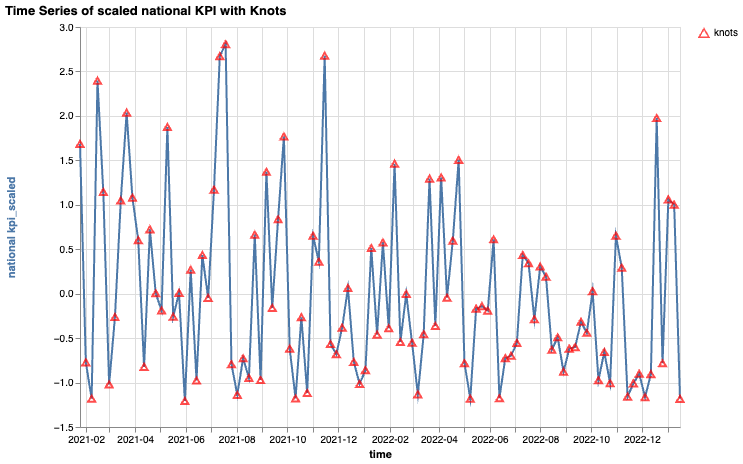
The displayed knots depend on your knots argument configuration in
ModelSpec:
- Default setting: Meridian uses full knots for geo-level datasets, while a single knot is the default for national models (plot omitted if only a single knot).
- AKS algorithm: If
enable_aks = True, this function plots the knots selected by the Automatic Knot Selection (AKS) method. - Manual specification: Plots your manually defined knot locations.
This KPI time series plot with knots is a useful visualization to help you evaluate your knot placement and determine if you need to manually add or drop any knots. For more guidance, see Set knots.
Pairwise correlation check
Meridian's EDA package computes the Pearson pairwise correlation between all scaled treatment units and scaled control variables.
Geo-model
ERRORstatus: For geo models, the pairwise correlation is first computed across all geos and times. Specifically, the values for each variable at all geos and times are flattened into a single array, and the pairwise correlation is calculated between these flattened arrays. AnERRORstatus is triggered if a pair of variables have nearly perfect correlation across all geos and times (the absolute value of their pairwise correlation exceeding the default threshold of 0.999). To resolve this, remove one of the redundant variables from the input data.You can retrieve the geo model's overall pairwise correlation (computed across all geos and times) using the following code:
[overall_corr] = mmm_eda.eda_engine.check_geo_pairwise_corr().get_overall_artifacts()
overall_corr.corr_matrix
National-model
ERRORstatus: For national models, the pairwise correlation is calculated across all times, as there is only one geo. AnERRORstatus is triggered if the absolute value of the pairwise correlation between a pair of variables exceeds the default threshold of 0.999. To resolve this, remove one of the redundant variables from the input data.You can retrieve the computed pairwise correlation for the national model using the following code:
[national_corr] = mmm_eda.eda_engine.check_national_pairwise_corr().get_national_artifacts()
national_corr.corr_matrix
Geo-model
ATTENTIONstatus: For geo models, the pairwise correlation is also calculated across all times for each specific geo. AnATTENTIONstatus is raised if a pair of variables exhibits nearly perfect correlation within individual geos, exceeding the default threshold of 0.999. To address this, check the data or consider combining these variables if they also show high pairwise correlation across multiple geos.You can retrieve the geo model's pairwise correlations for individual geos using the following code:
[geo_corr] = mmm_eda.eda_engine.check_geo_pairwise_corr().get_geo_artifacts()
geo_corr.corr_matrix
You can tune these extreme thresholds if necessary. For more details on how to set these thresholds, see Custom pairwise correlation threshold.
User-configurable customizations
Meridian's EDA package provides several configuration options to tailor the EDA process to your specific dataset and modeling needs.
Custom aggregation method from geo to national level
To perform national-level EDA on a geo-level dataset, Meridian's EDA package internally aggregates the raw (unscaled) geo-level data to the national level before applying transformations. This ensures equivalence to the case where users have to first manually aggregate their own geo-level dataset to national level, then pass in that national-level data into Meridian and apply EDA.
By default, all raw media units, raw organic media units, raw reach, and raw KPI are summed across geos. To aggregate frequency, Meridian's EDA package calculates raw RF impressions (reach multiplied by frequency) for each geo, sums the RF impressions and the reach across all geos, and divides the total national RF impressions by the total national reach. Similar computations apply when rolling up organic frequency.
While the default sum aggregation is appropriate for most variables, you can define a custom aggregation method for specific control variables or non-media treatments. This is particularly useful for variables that are binary or represent rates or percentages.
For example, if you want to take the average of a control variable named
rating across all geos:
from meridian.model import model
from meridian.model.eda import eda_spec
import numpy as np

mmm_agg_config = eda_spec.AggregationConfig(
    control_variables={'rating': np.mean}
)
mmm_eda_spec = eda_spec.EDASpec(aggregation_config=mmm_agg_config)
mmm = model.Meridian(..., eda_spec=mmm_eda_spec)
Custom VIF threshold
Meridian's EDA package triggers an ERROR or ATTENTION status for extreme
data issues, such as near-perfect multicollinearity. To prevent numerical
instability while maintaining flexibility, the package uses a default extreme
VIF threshold of 1000 instead of infinity. You can calibrate these thresholds
based on your business context and judgment:
geo_threshold: For geo-level datasets. If a variable's VIF within a specific geo exceeds this value, it triggers anATTENTIONstatus. Posterior sampling can still proceed.overall_threshold: For geo-level datasets. If a variable's VIF (computed across all geos and times) exceeds this value, it triggers anERRORstatus. Posterior sampling is blocked.national_threshold: For national-level datasets. If a variable's VIF exceeds this value, it triggers anERRORstatus. Posterior sampling is blocked.
For example, to lower the overall_threshold for multicollinearity from 1000
to 50:
from meridian.model import model
from meridian.model.eda import eda_spec

mmm_custom_vif = eda_spec.VIFSpec(overall_threshold=50)
mmm_eda_spec = eda_spec.EDASpec(vif_spec=mmm_custom_vif)
mmm = model.Meridian(..., eda_spec=mmm_eda_spec)
Custom pairwise correlation threshold
An ERROR or ATTENTION status is also triggered for extreme pairwise
correlation. The default extreme correlation threshold is set to 0.999. You can
calibrate these thresholds based on your specific dataset and judgment:
geo_threshold: For geo-level datasets. If the absolute value of the pairwise correlation between two variables within a specific geo exceeds this value, it triggers anATTENTIONstatus. Posterior sampling can still proceed.overall_threshold: For geo-level datasets. If the absolute value of the pairwise correlation (computed across all geos and times) exceeds this value, it triggers anERRORstatus. Posterior sampling is blocked.national_threshold: For national-level datasets. If the absolute value of the pairwise correlation exceeds this value, it triggers anERRORstatus. Posterior sampling is blocked.
For example, to lower the overall_threshold for a geo model's pairwise
correlation from 0.999 to 0.95:
from meridian.model import model
from meridian.model.eda import eda_spec

mmm_custom_corr = eda_spec.PairwiseCorrSpec(overall_threshold=0.95)
mmm_eda_spec = eda_spec.EDASpec(pairwise_corr_spec=mmm_custom_corr)
mmm = model.Meridian(..., eda_spec=mmm_eda_spec)
Other customizations
The Meridian EDA package allows other customizable thresholds in the EDASpec.
These defaults serve as internal guardrails for what the package considers to be
constant variables. You rarely need to adjust these defaults, but they are
available for your own specific edge cases.
Customize
KpiInvariabilitySpec: As outlined in Critical lack of variation, Meridian's EDA package triggers anERRORand blocks posterior sampling when the transformed KPI has an overall standard deviation smaller than the default 1e-4 threshold. You can use theKpiInvariabilitySpecto adjust thestd_thresholdthat determines when a low-variability KPI triggers thisERROR.For example, to lower this
std_thresholdin theKpiInvariabilitySpecto 1e-5:from meridian.model import model from meridian.model.eda import eda_spec custom_kpi_spec = eda_spec.KpiInvariabilitySpec(std_threshold=1e-5) mmm_eda_spec = eda_spec.EDASpec(kpi_invariability_spec=custom_kpi_spec) mmm = model.Meridian(..., eda_spec=mmm_eda_spec)Customize
StandardDeviationSpec: As detailed in Outliers and potential data sparsity, variables with an extremely low standard deviation -- calculated after removing outliers -- indicate potential data sparsity or a lack of signal. You can use theStandardDeviationSpecto adjust the thresholds that determine when these low-variability variables trigger anATTENTIONalert.For example, to lower the standard deviation threshold to 1e-5 for a geo model, adjust the
geo_std_threshold:from meridian.model import model from meridian.model.eda import eda_spec custom_std_spec = eda_spec.StandardDeviationSpec(geo_std_threshold=1e-5) mmm_eda_spec = eda_spec.EDASpec(std_spec=custom_std_spec) mmm = model.Meridian(..., eda_spec=mmm_eda_spec)For a national model, adjust the
national_std_thresholdinstead.Filter constant variables from VIF calculations: Near-constant variables can cause computational errors during Variance Inflation Factor (VIF) calculations. By default, any variable with a standard deviation smaller than 1e-4 is excluded from the VIF calculations. You can adjust this limit using the
std_thresholdparameter inVIFSpec. For example, to increase this threshold to 1e-3:from meridian.model import model from meridian.model.eda import eda_spec custom_vif_std = eda_spec.VIFSpec(std_threshold=1e-3) mmm_eda_spec = eda_spec.EDASpec(vif_spec=custom_vif_std) mmm = model.Meridian(..., eda_spec=mmm_eda_spec)