
Page Summary
-
This guide details how to debug Google Workspace add-ons locally and remotely using ngrok for Node.js, Python, and Java environments.
-
Local debugging involves using ngrok to expose a local server, configuring an IDE debugger, and triggering the add-on within a Google Workspace application.
-
Remote debugging requires deploying the add-on, establishing an SSH tunnel to the remote environment, and configuring a remote debug session in an IDE.
-
Debugging capabilities include setting breakpoints, inspecting variables, and stepping through code execution to identify and resolve issues.
-
The guide offers step-by-step instructions, code examples, and illustrations to facilitate efficient debugging of Google Workspace add-ons.
As a Google Workspace add-on developer you might need to debug code to test changes or troubleshoot complex issues. Debugging Google Workspace add-ons can be done in many different ways depending on your app's architecture, what the app does, how your app is deployed, and your preferences.
This page explains how to debug an HTTP Google Workspace add-on using ngrok,
which is a unified ingress platform that you can use to test local development
environments. In this guide, you test code changes in a local environment and
troubleshoot issues in a remote environment.
Debug from local development environment
In this section, you interact with your Google Workspace add-on that executes in your local environment.

Prerequisites
Node.js
- Latest versions of
nodeandnpminstalled in your local environment. Latest version of
nodemoninstalled in your local environment. It's used for auto-reload purposes:npm install -g nodemonA Google Cloud project. You can follow the sections Prerequisites, and Set up the environment of the Quickstart guide.
The code of the Google Workspace add-on to debug in your local environment. We use the preview link features from the code example
3p-resourcesfrom the GitHub repositorygoogleworkspace/add-ons-samplesin this guide for illustration purposes.An IDE set up in your local environment that can debug. We use the
Visual Studio CodeIDE and its default debugging features in this guide for illustration purposes.A
ngrokaccount.Latest version of
gcloudinstalled and initialized in your local environment.
Python
- Latest version of
python3installed in your local environment. - Latest version of
pipandvirtualenvinstalled in your local environment. They're used to manage Python packages and virtual environments respectively. - A Google Cloud project. You can follow the sections Prerequisites, and Set up the environment of the Quickstart guide.
- The code of the Google Workspace add-on to debug in your local
environment. We use the preview link features from the code example
3p-resourcesfrom the GitHub repositorygoogleworkspace/add-ons-samplesin this guide for illustration purposes. - An IDE set up in your local environment that can debug. We use the
Visual Studio CodeIDE and its default debugging features in this guide for illustration purposes. - A
ngrokaccount. - Latest version of
gcloudinstalled and initialized in your local environment.
Java
- Latest stable version of the
Java SE 11's JDKinstalled in your local environment. - Latest version of
Apache Maveninstalled in your local environment. It's used to manage Java projects. - A Google Cloud project. You can follow the sections Prerequisites, and Set up the environment of the Quickstart guide.
- The code of the Google Workspace add-on to debug in your local
environment. We use the preview link features from the code example
3p-resourcesfrom the GitHub repositorygoogleworkspace/add-ons-samplesin this guide for illustration purposes. - An IDE set up in your local environment that can debug. We use the
Visual Studio CodeIDE and its default debugging features in this guide for illustration purposes. - A
ngrokaccount. - Latest version of
gcloudinstalled and initialized in your local environment.
Make the localhost service available publicly
You need to connect your local environment to the internet so that the
Google Workspace add-on can access it. The ngrok application is used to
redirect HTTP requests made to a public URL to your local environment.
- In a browser in your local environment, sign in to your
ngrokaccount. - Install the application and set up your
authtokenin your local environment. - Create a static domain in your
ngrokaccount, it's referenced asNGROK_STATIC_DOMAINin the instructions of this guide.
Create and install the add-on deployment
Configure the Google Workspace add-on to send all its HTTP requests to your static domain. Your deployment file should look like the following:
{
  "oauthScopes": [
    "https://www.googleapis.com/auth/workspace.linkpreview",
    "https://www.googleapis.com/auth/workspace.linkcreate"
  ],
  "addOns": {
    "common": {
      "name": "Manage support cases",
      "logoUrl": "https://developers.google.com/workspace/add-ons/images/support-icon.png",
      "layoutProperties": {
        "primaryColor": "#dd4b39"
      }
    },
    "docs": {
      "linkPreviewTriggers": [
        {
          "runFunction": "NGROK_STATIC_DOMAIN",
          "patterns": [
            {
              "hostPattern": "example.com",
              "pathPrefix": "support/cases"
            },
            {
              "hostPattern": "*.example.com",
              "pathPrefix": "cases"
            },
            {
              "hostPattern": "cases.example.com"
            }
          ],
          "labelText": "Support case",
          "localizedLabelText": {
            "es": "Caso de soporte"
          },
          "logoUrl": "https://developers.google.com/workspace/add-ons/images/support-icon.png"
        }
      ],
      "createActionTriggers": [
        {
          "id": "createCase",
          "labelText": "Create support case",
          "localizedLabelText": {
            "es": "Crear caso de soporte"
          },
          "runFunction": "$URL2",
          "logoUrl": "https://developers.google.com/workspace/add-ons/images/support-icon.png"
        }
      ]
    },
    "httpOptions": {
      "granularOauthPermissionSupport": "OPT_IN"
    }
  }
}
Replace
NGROK_STATIC_DOMAINwith the static domain in yourngrokaccount.Set the Google Cloud project to use:
gcloud config set project PROJECT_IDAcquire new user credentials to use for Application Default Credentials:
gcloud auth application-default loginReplace
PROJECT_IDwith the project ID for the Google Cloud project of the app.Create the deployment:
gcloud workspace-add-ons deployments create manageSupportCases \
    --deployment-file=DEPLOYMENT_FILE_PATH
Replace
DEPLOYMENT_FILE_PATHwith the path of your deployment file.Install the deployment:
gcloud workspace-add-ons deployments install manageSupportCases
Figure 2. The Google Workspace add-on sends all its HTTP requests to the static domain. The `ngrok` public service acts as a bridge between the Google Workspace add-on and the application code that executes locally.
Test the Google Workspace add-on
You can locally deploy, test, debug, and auto-reload your Google Workspace add-on.
Node.js
From the
Visual Studio CodeIDE installed in your local environment, do the following:- In a new window, open the folder
add-ons-samples/node/3p-resources. Configure the application for local run and auto-reload debug by adding one dependency and two scripts in the
package.jsonfile:{ ... "dependencies": { ... "@google-cloud/functions-framework": "^3.3.0" }, "scripts": { ... "start": "npx functions-framework --target=createLinkPreview --port=9000", "debug-watch": "nodemon --watch ./ --exec npm start" } ... }From the root directory, install the application:
npm installCreate and configure a launch named
Debug Watchthat triggers the scriptdebug-watchby creating the file.vscode/launch.jsonin the root directory:{ "version": "0.2.0", "configurations": [{ "type": "node", "request": "launch", "name": "Debug Watch", "cwd": "${workspaceRoot}", "runtimeExecutable": "npm", "runtimeArgs": ["run-script", "debug-watch"] }] }Add a breakpoint that pauses the HTTP request processing in the
index.jsfile, and start running and debugging with theDebug Watchconfiguration added before. The application is now running and listening for HTTP requests on port9000.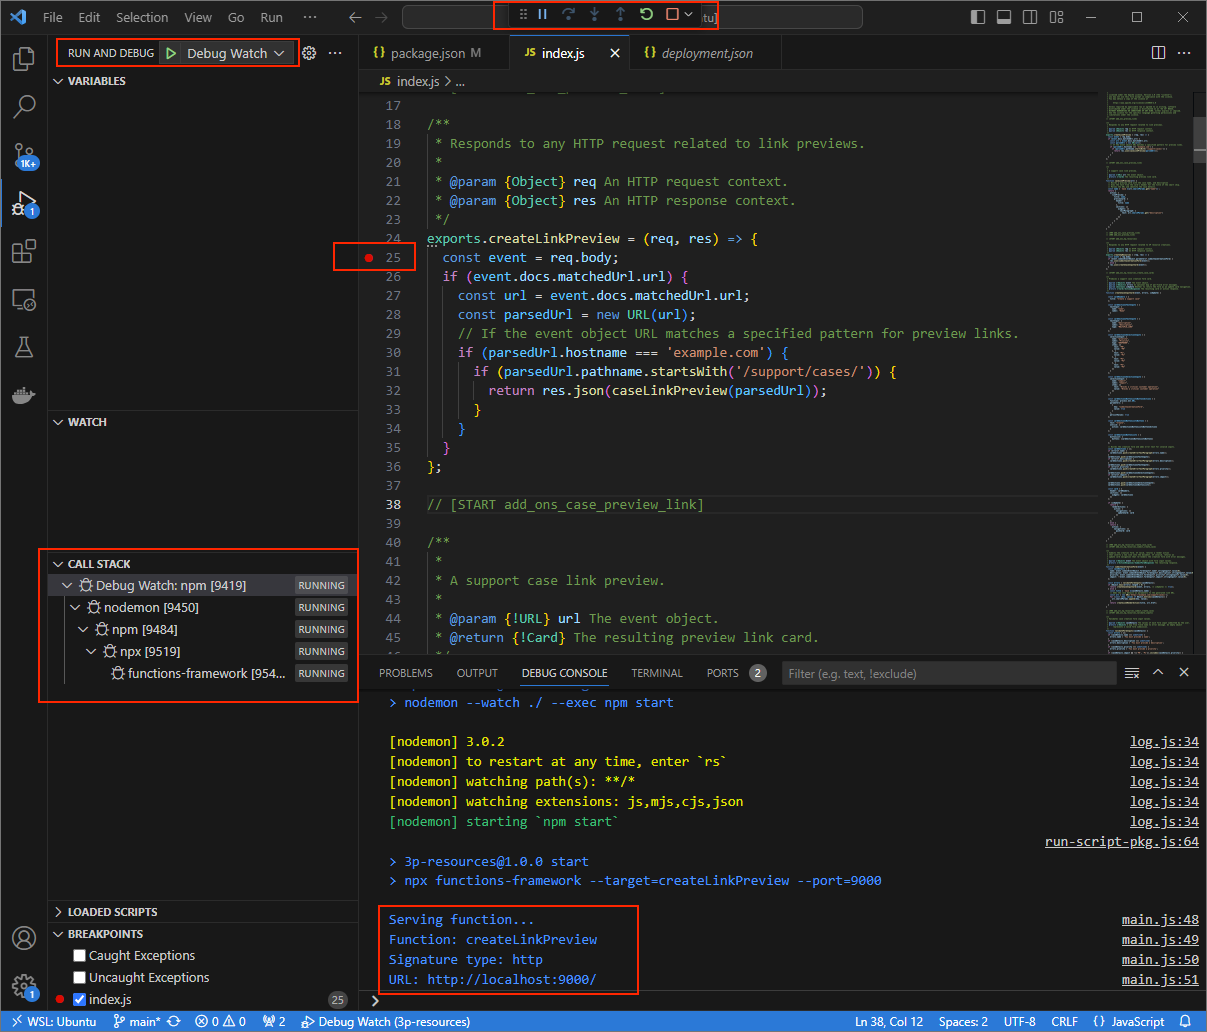
Figure 3. The application is running and listening for HTTP requests on port 9000.
- In a new window, open the folder
Launch the
ngrokapplication in your local environment:ngrok http --domain=NGROK_STATIC_DOMAIN 9000Replace
NGROK_STATIC_DOMAINwith the static domain in yourngrokaccount. All requests are now redirected to your local environment and the port used by the application.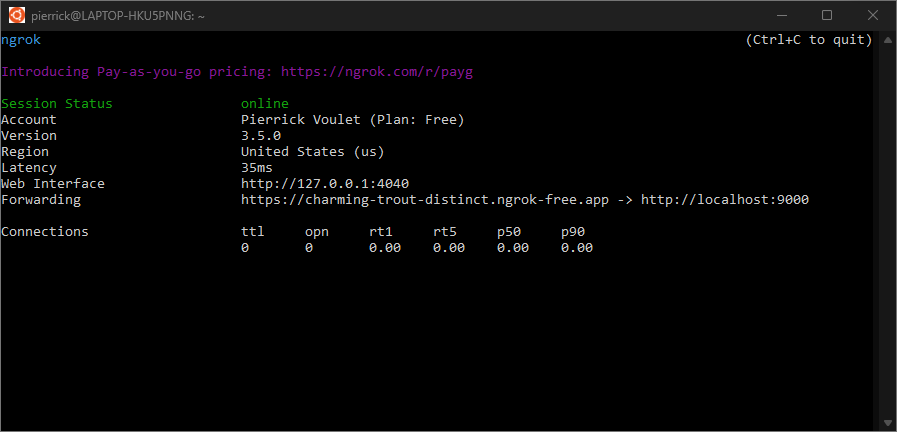
Figure 4. The terminal with ngrokserver running and redirecting.A web interface is also started on your localhost by the
ngrokapplication. You can monitor all activities by opening it in a browser.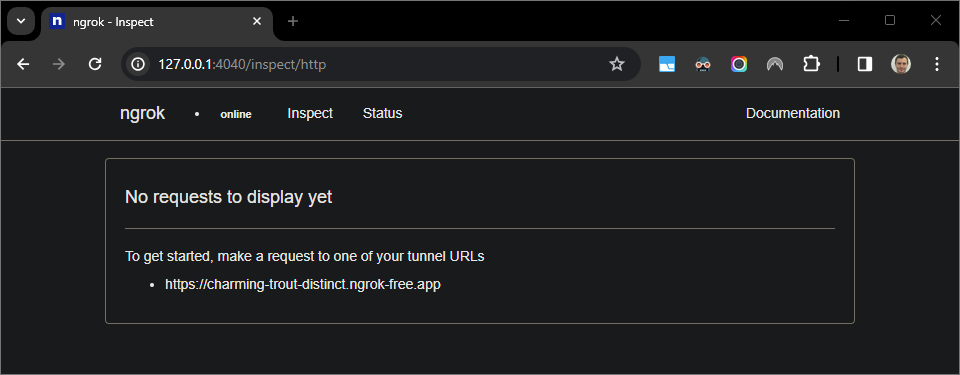
Figure 5. The web interface hosted by the ngrokapplication showing no HTTP requests.Test your Google Workspace add-on by previewing a case URL in a new Google Doc with a tester account:
Create a Google Doc.
Type the following link and press
enter:https://example.com/support/case/?name=Name1&description=Description1&priority=P1Click the link.
In the
Visual Studio Codein your local environment, you can see that the execution is paused at the breakpoint that was set.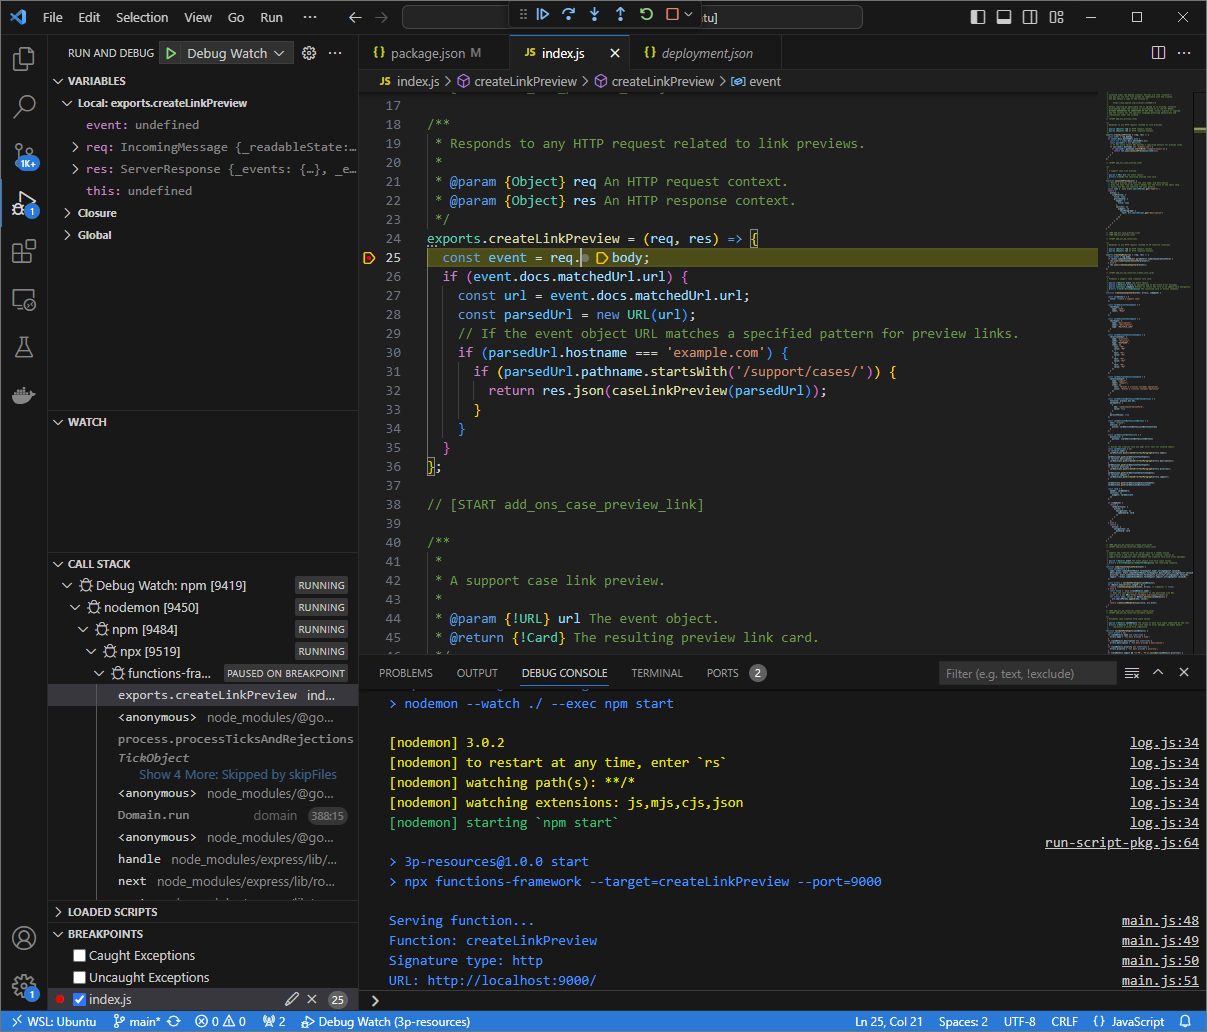
Figure 6. The execution is paused at the breakpoint that was set. When you resume the execution from the
Visual Studio Codedebugger before Google Workspace add-ons times out, the Google Workspace add-on displays the link preview in the Google Doc from the cache.You can check the HTTP request and response logs from the web interface hosted by the
ngrokapplication in your local environment.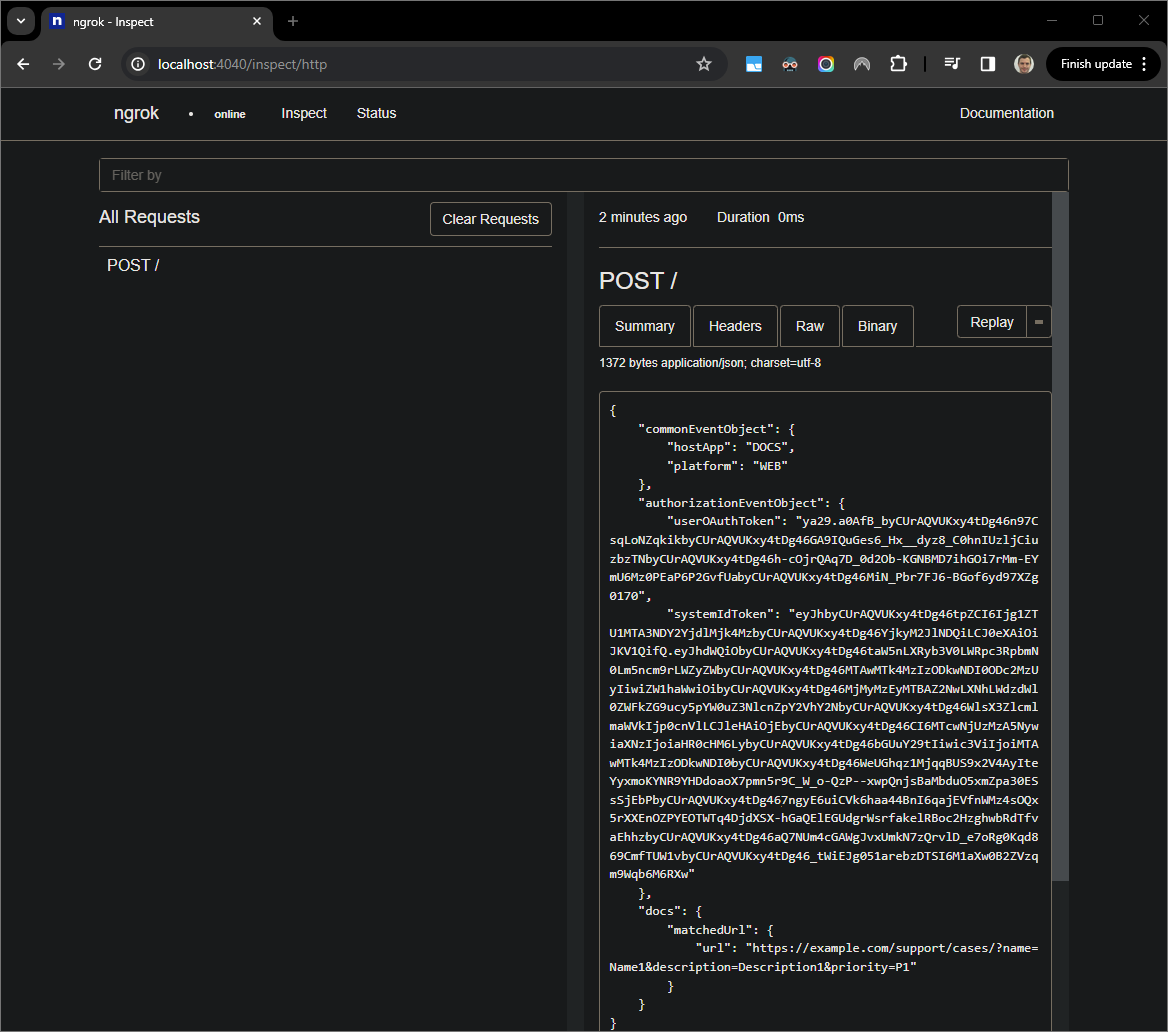
Figure 7. The HTTP request from the web interface hosted by the ngrokapplication.To change the application behavior, replace
CasewithCase:on line51of theindex.js. When you save the file,nodemonautomatically reloads the application with the updated source code andVisual Studio Coderemains in debug mode.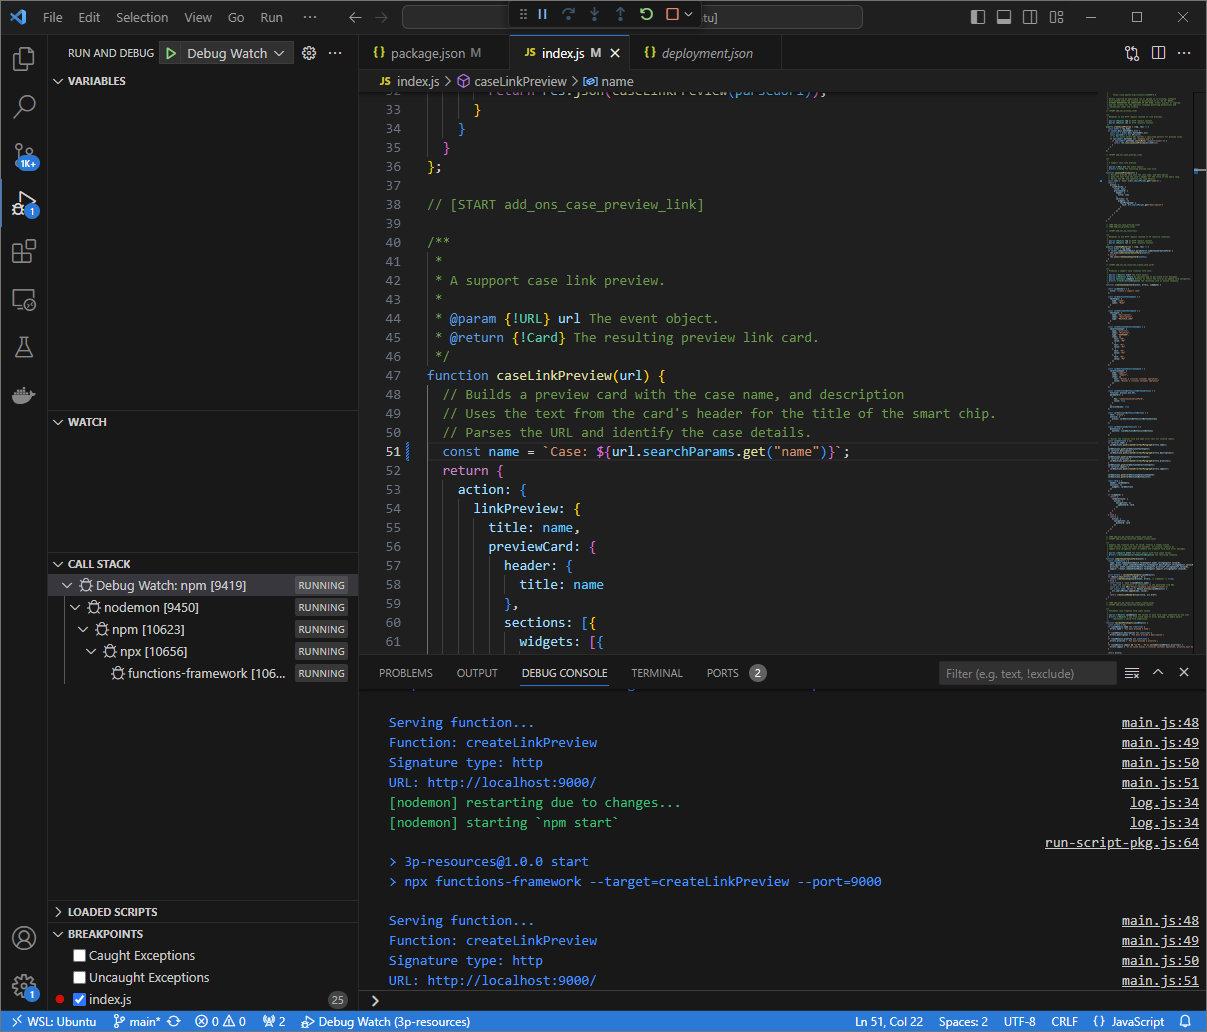
Figure 8. The application is running and listening for HTTP requests on port 9000with the code change loaded.This time, instead of clicking the link and waiting for a few seconds in a new Google Doc, you can select the last HTTP request logged on the web interface hosted by the
ngrokapplication in your local environment and clickReplay. Same as last time, your Google Workspace add-on doesn't reply because it's being actively debugged.When you resume the execution from the
Visual Studio Codedebugger, you can see from the web interface hosted by thengrokapplication in your local environment that the application generates a response with the updated version of the preview card.
Python
From the
Visual Studio CodeIDE installed in your local environment, do the following:- In a new window, open the folder
add-ons-samples/python/3p-resources/create_link_preview. Create a virtual environment for Python
envand activate it:virtualenv envsource env/bin/activateInstall all project dependencies using
pipin the virtual environment:pip install -r requirements.txtCreate the file
.vscode/launch.jsonin the root directory and configure a launch namedDebug Watchthat triggers the application from the modulefunctions-frameworkon port9000in debug mode on the virtual environmentenv:{ "version": "0.2.0", "configurations": [{ "type": "python", "request": "launch", "name": "Debug Watch", "python": "${workspaceFolder}/env/bin/python3", "module": "functions_framework", "args": [ "--target", "create_link_preview", "--port", "9000", "--debug" ] }] }Add a breakpoint that pauses the HTTP request processing in the
main.pyfile, and start running and debugging with theDebug Watchconfiguration added before. The application is now running and listening for HTTP requests on port9000.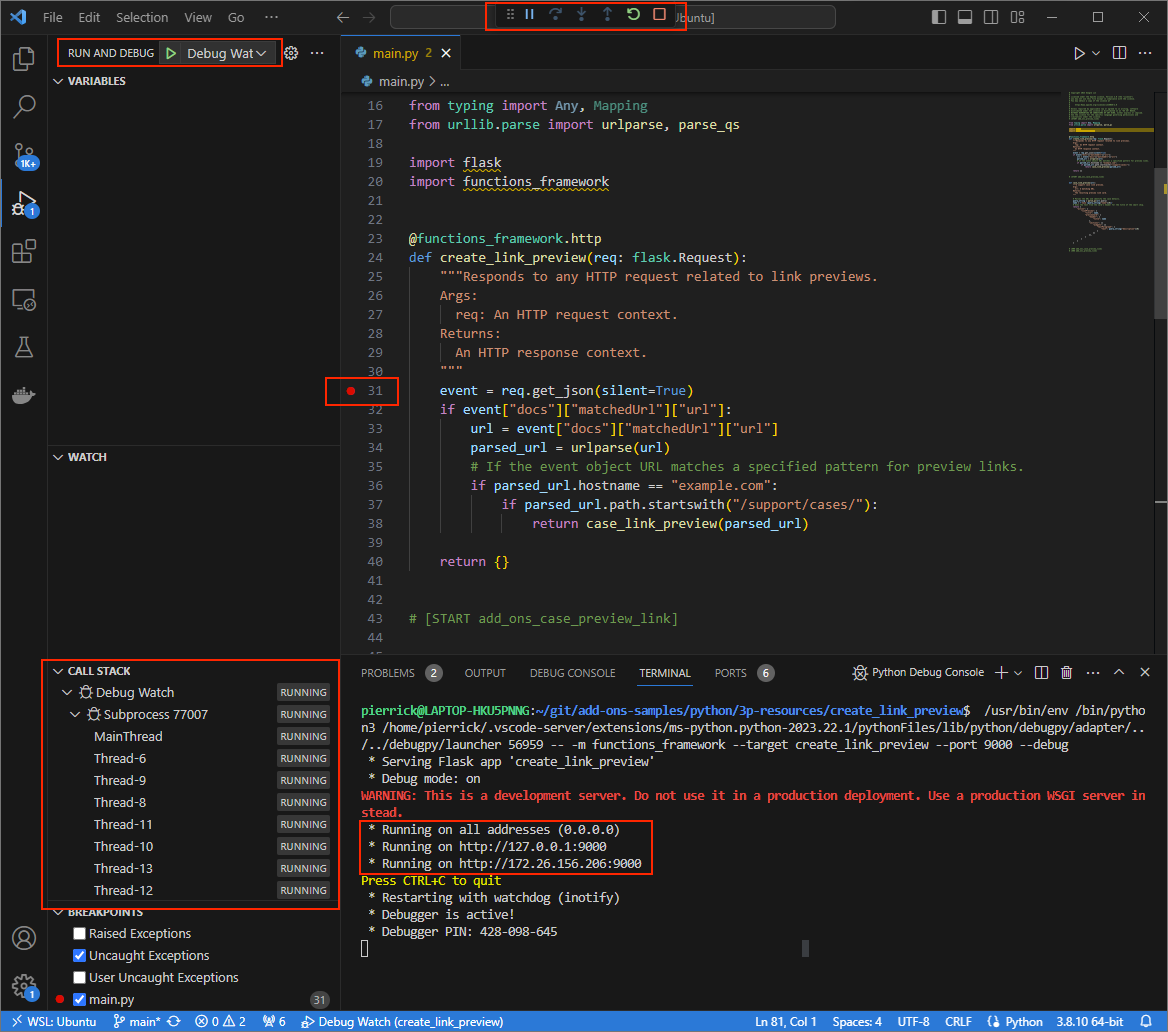
Figure 3. The application is running and listening for HTTP requests on port 9000.
- In a new window, open the folder
Launch the
ngrokapplication in your local environment:ngrok http --domain=NGROK_STATIC_DOMAIN 9000Replace
NGROK_STATIC_DOMAINwith the static domain in yourngrokaccount. All requests are now redirected to your local environment and the port used by the application.
Figure 4. The terminal with ngrokserver running and redirecting.A web interface is also started on your localhost by the
ngrokapplication. Monitor all activities by opening it in a browser.
Figure 5. The web interface hosted by the ngrokapplication showing no HTTP requests.Test your Google Workspace add-on by previewing a case URL in a new Google Doc with a tester account:
Create a Google Doc.
Type the following link and press
enter:https://example.com/support/case/?name=Name1&description=Description1&priority=P1Click the link.
In the
Visual Studio Codein your local environment, you can see that the execution is paused at the breakpoint that was set.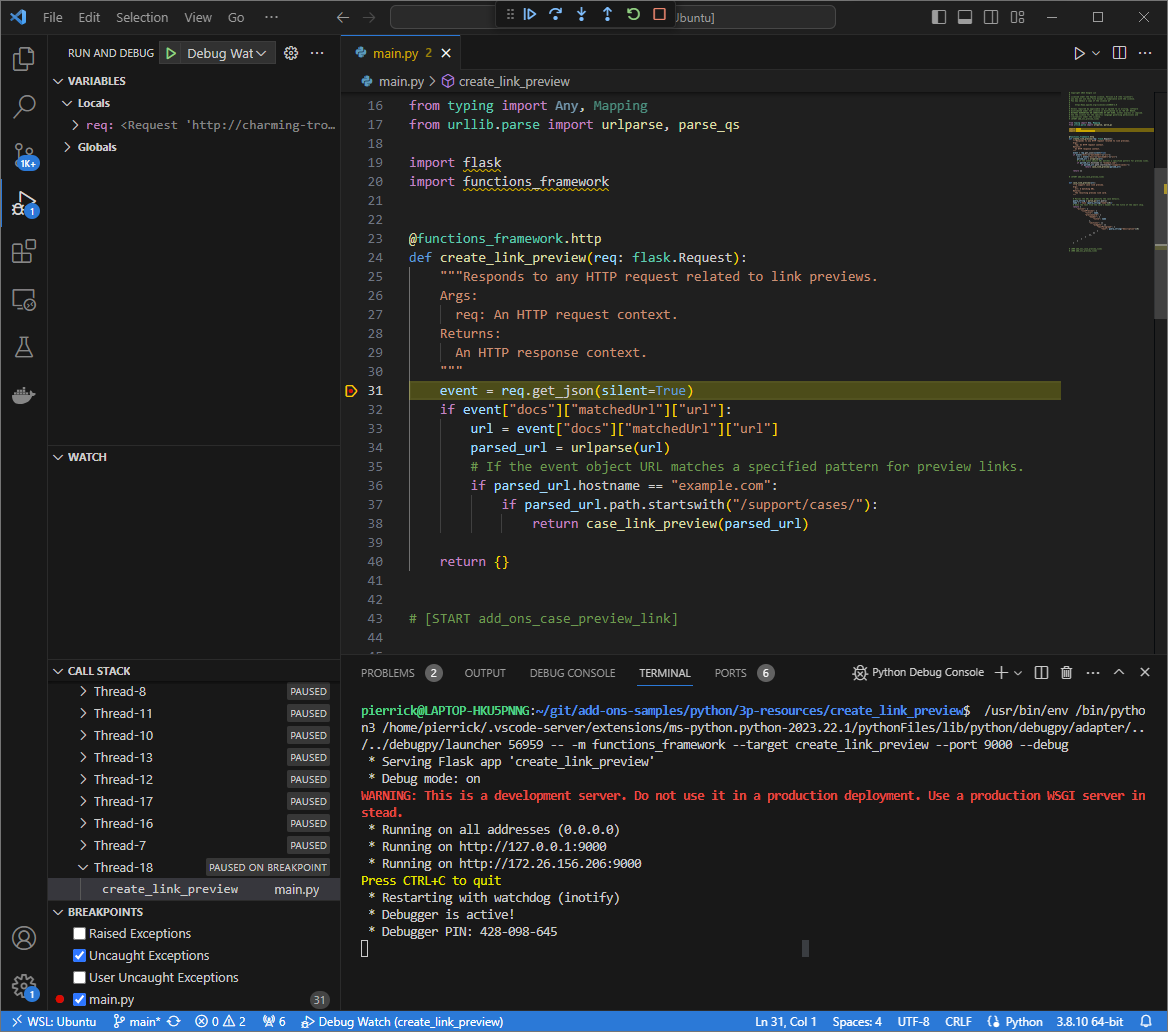
Figure 6. The execution is paused at the breakpoint that was set. When you resume the execution from the
Visual Studio Codedebugger before Google Workspace add-ons times out, the Google Workspace add-on displays the link preview in the Google Doc from the cache.You can check the HTTP request and response logs from the web interface hosted by the
ngrokapplication in your local environment.
Figure 7. The HTTP request from the web interface hosted by the ngrokapplication.To change the application behavior, replace
CasewithCase:on line56of themain.pyfile. When you save the file,Visual Studio Codeautomatically reloads the application with the updated source code and remains in debug mode.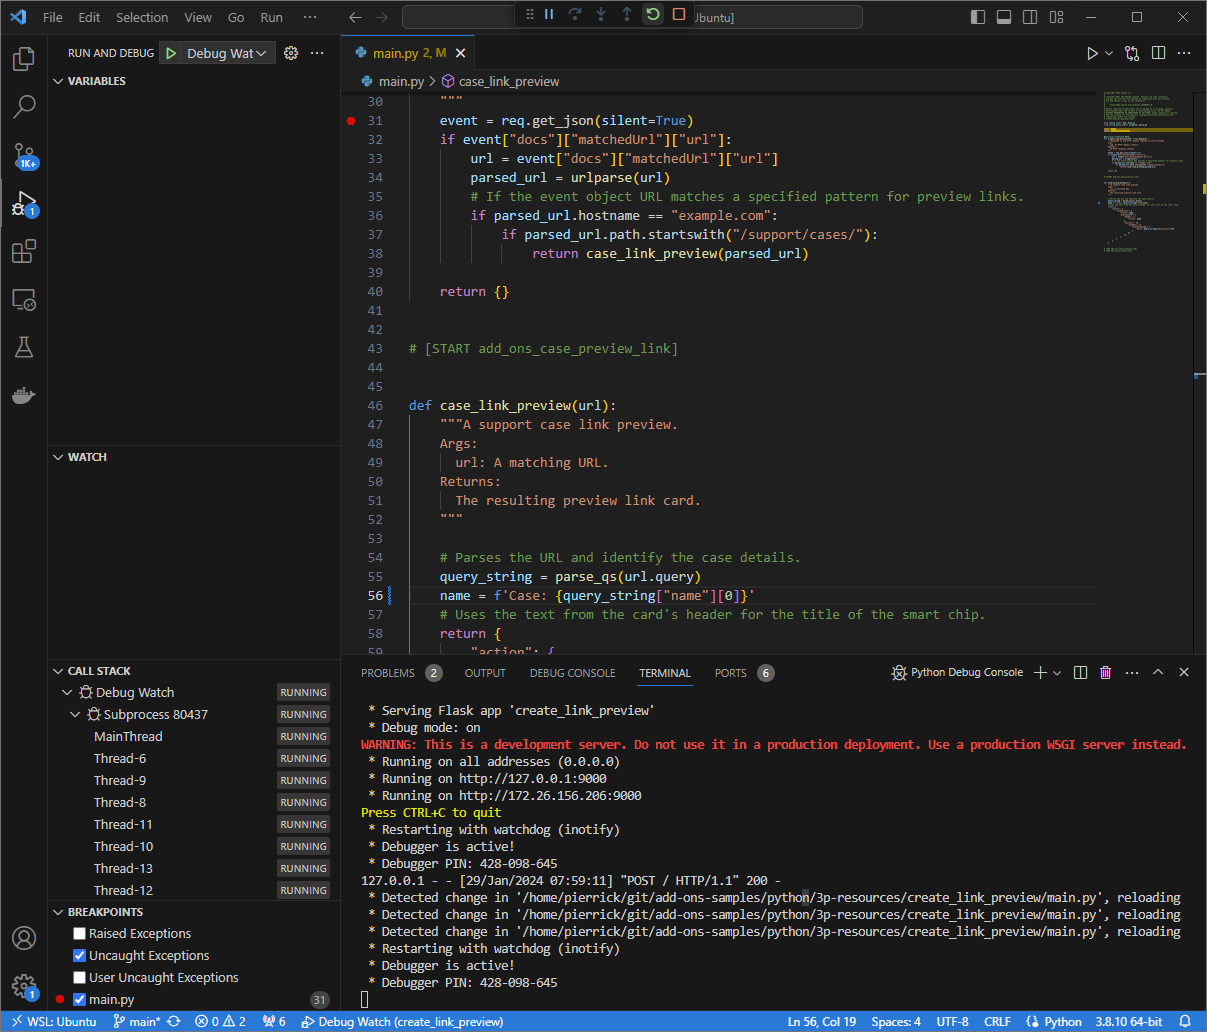
Figure 8. The application is running and listening for HTTP requests on port 9000with the code change loaded.This time, instead of clicking the link and waiting for a few seconds in a new Google Doc, you can select the last HTTP request logged on the web interface hosted by the
ngrokapplication in your local environment and clickReplay. Same as last time, your Google Workspace add-on doesn't reply because it's being actively debugged.When you resume the execution from the
Visual Studio Codedebugger, you can see from the web interface hosted by thengrokapplication in your local environment that the application generates a response with the updated version of the preview card.
Java
From the
Visual Studio CodeIDE installed in your local environment, do the following:- In a new window, open the folder
add-ons-samples/java/3p-resources. Configure the Maven project to run the application
CreateLinkPreviewon port9000locally by adding the Cloud Functions Framework build pluginfunction-maven-pluginto thepom.xmlfile:... <plugin> <groupId>com.google.cloud.functions</groupId> <artifactId>function-maven-plugin</artifactId> <version>0.11.0</version> <configuration> <functionTarget>CreateLinkPreview</functionTarget> <port>9000</port> </configuration> </plugin> ...You can now launch it locally in debug mode:
mvnDebug function:run
Preparing to execute Maven in debug mode
Listening for transport dt_socket at address: 8000
Create the file
.vscode/launch.jsonin the root directory and configure a launch namedRemote Debug Watchthat attaches to the application previously launched on port8000:{ "version": "0.2.0", "configurations": [{ "type": "java", "request": "attach", "name": "Remote Debug Watch", "projectName": "http-function", "hostName": "localhost", "port": 8000 }] }Add a breakpoint that pauses the HTTP request processing in the
CreateLinkPreview.javafile, and start attaching and debugging with theRemote Debug Watchconfiguration added before. The application is now running and listening for HTTP requests on port9000.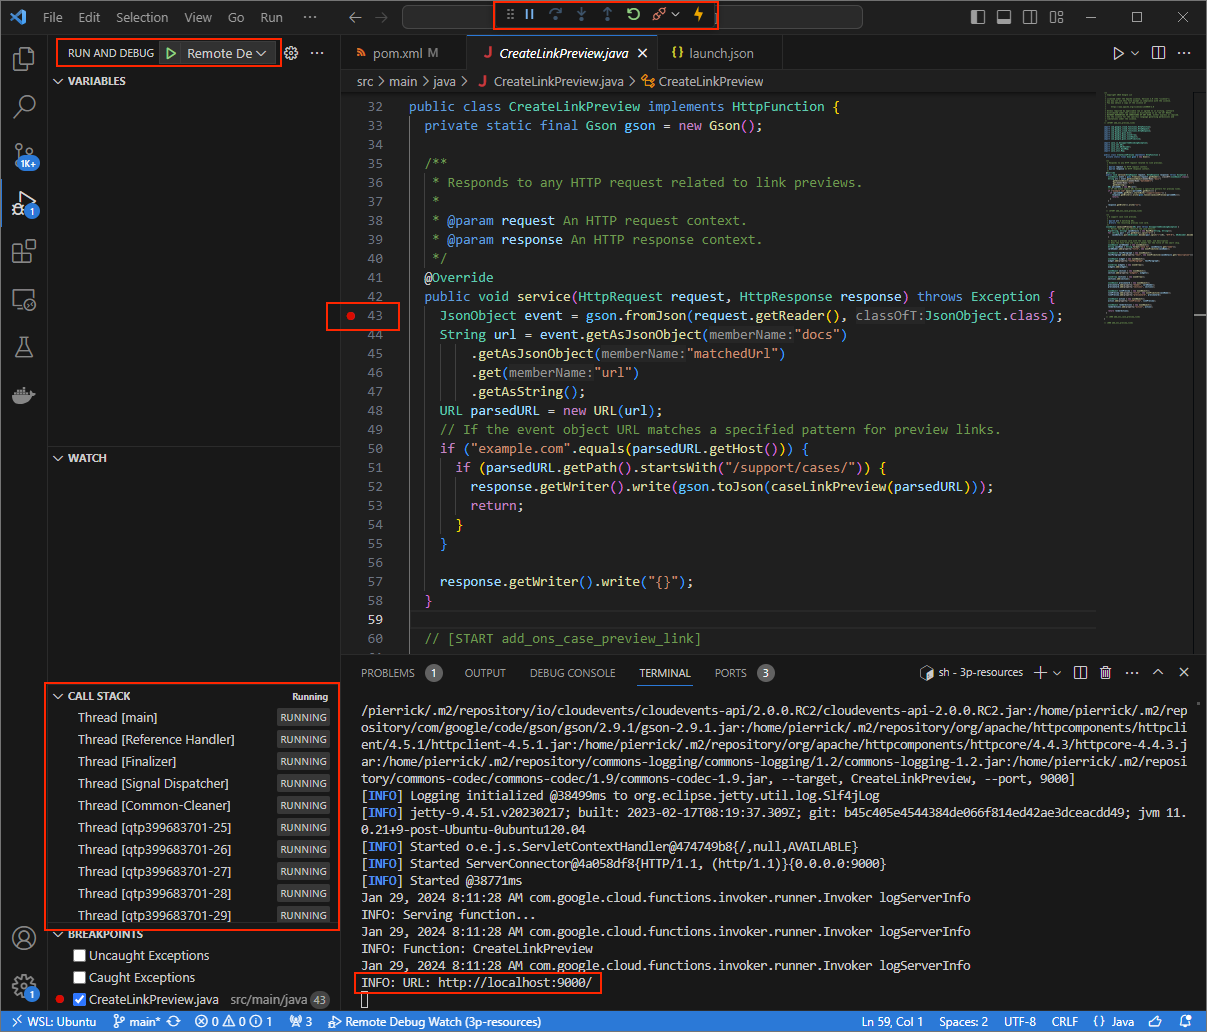
Figure 3. The application is running and listening for HTTP requests on port 9000.
- In a new window, open the folder
Launch the
ngrokapplication in your local environment:ngrok http --domain=NGROK_STATIC_DOMAIN 9000Replace
NGROK_STATIC_DOMAINwith the static domain in yourngrokaccount. All requests are now redirected to your local environment and the port used by the application.
Figure 4. The terminal with ngrokserver running and redirecting.A web interface is also started on your localhost by the
ngrokapplication. Monitor all activities by opening it in a browser.
Figure 5. The web interface hosted by the ngrokapplication showing no HTTP requests.Test your Google Workspace add-on by previewing a case URL in a new Google Doc with a tester account:
Create a Google Doc.
Type the following link and press
enter:https://example.com/support/case/?name=Name1&description=Description1&priority=P1Click the link.
In the
Visual Studio Codein your local environment, you can see that the execution is paused at the breakpoint that was set.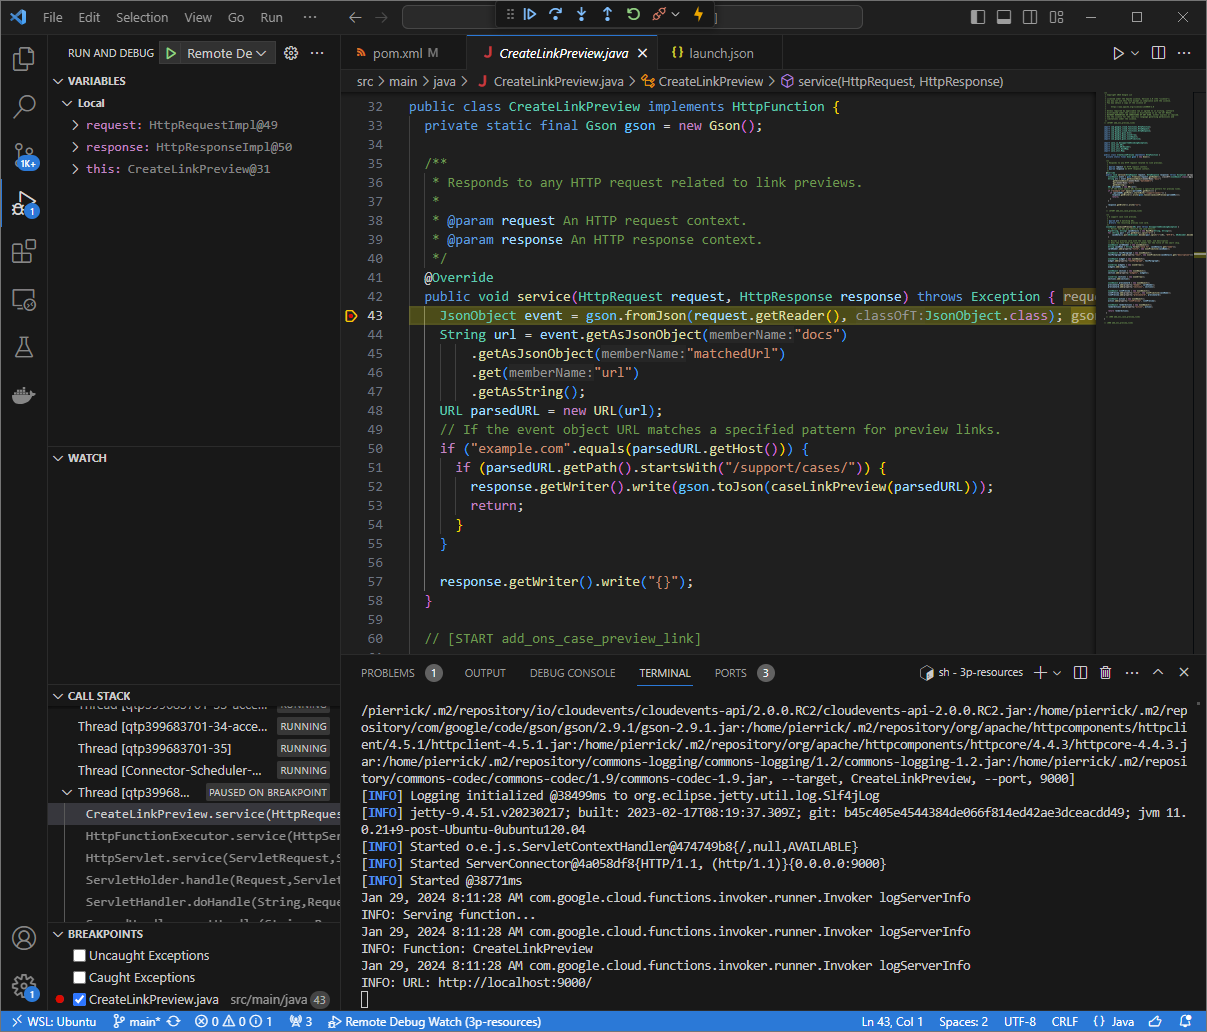
Figure 6. The execution is paused at the breakpoint that was set. When you resume the execution from the
Visual Studio Codedebugger before Google Workspace add-ons times out, the Google Workspace add-on displays the link preview in the Google Doc from the cache.You can check the HTTP request and response logs from the web interface hosted by the
ngrokapplication in your local environment.
Figure 7. The HTTP request from the web interface hosted by the ngrokapplication.To change the application behavior, replace
CasewithCase:on line78of theCreateLinkPreview.javafile, restart themvnDebugprocess, and relaunchRemote Debug Watchto reattach and restart debugging.This time, instead of clicking the link and waiting for a few seconds in a new Google Doc, you can select the last HTTP request logged on the web interface hosted by the
ngrokapplication in your local environment and clickReplay. Same as last time, your Google Workspace add-on doesn't reply because it's being actively debugged.When you resume the execution from the
Visual Studio Codedebugger, you can see from the web interface hosted by thengrokapplication in your local environment that the application generates a response with the updated version of the preview card.
Debug from remote environment
In this section, you interact with your Google Workspace add-on that executes on a remote environment.

Prerequisites
- Your Google Workspace add-on is deployed and installed.
- Your application is running in your remote environment with the debugger
enabled on a given port, and it's referenced as
REMOTE_DEBUG_PORTin the instructions of this guide. - Your local environment can
sshto your remote environment. - An IDE is set up in your local environment that can debug. We use the
Visual Studio CodeIDE and its default debugging features in this guide for illustration purposes.
Connect your local and remote environments
In your local environment from where you want to initiate a debug client connection, set up an SSH tunnel:
ssh -L LOCAL_DEBUG_PORT:localhost:REMOTE_DEBUG_PORT REMOTE_USERNAME@REMOTE_ADDRESSReplace the following:
LOCAL_DEBUG_PORT: The debug port in your local environment.REMOTE_USERNAME: The username in your remote environment.REMOTE_ADDRESS: The address of your remote environment.REMOTE_DEBUG_PORT: The debug port in your remote environment.
The debug port in your local environment is now linked to the debug port in your remote environment.
Start debugging
From the Visual Studio Code IDE installed in your local environment, do the
following:
- In a new window, open the source code of your app.
Create the file
.vscode/launch.jsonin the root directory and configure a launch namedDebug Remotethat attaches to the debug port in your local environment:Node.js
{
    "version": "0.2.0",
    "configurations": [{
        "type": "node",
        "request": "attach",
        "name": "Debug Remote",
        "address": "127.0.0.1",
        "port": LOCAL_DEBUG_PORT
    }]
}
Python
{
    "version": "0.2.0",
    "configurations": [{
        "type": "python",
        "request": "attach",
        "name": "Debug Remote",
        "connect": {
            "host": "127.0.0.1",
            "port": LOCAL_DEBUG_PORT
        }
    }]
}
Java
{
    "version": "0.2.0",
    "configurations": [{
        "type": "java",
        "request": "attach",
        "name": "Debug Remote",
        "hostName": "127.0.0.1",
        "port": LOCAL_DEBUG_PORT
    }]
}
Replace
LOCAL_DEBUG_PORTwith the debug port in your local environment.Add a breakpoint in the source code of your app that pauses the HTTP request processing, and start running and debugging with the
Debug
Remote
configuration added before.Interact with your installed Google Workspace add-on. Your Google Workspace add-on doesn't reply because it's being actively debugged in the
Visual Studio CodeIDE.
Related topics
- Learn how to query error logs.