Gửi ý kiến phản hồi
Tổng quan về Thẻ thông tin 2D
Sử dụng bộ sưu tập để sắp xếp ngăn nắp các trang
Lưu và phân loại nội dung dựa trên lựa chọn ưu tiên của bạn.
Nhà phát triển ở Khu vực kinh tế Châu Âu (EEA)
Ô bản đồ chỉ đơn giản là việc chia thế giới thành một lưới được lập chỉ mục. Thư viện này cho phép bạn truy cập và sử dụng dữ liệu bản đồ một cách hiệu quả và linh hoạt ở nhiều tỷ lệ bản đồ. Map Tiles API cho phép bạn truy cập vào nhiều tập dữ liệu địa lý theo chủ đề, bao gồm cả tập dữ liệu do Google tuyển chọn:
Các ô hình ảnh của lộ trình dựa trên dữ liệu địa hình dạng vectơ theo kiểu lập bản đồ của Google.
Ảnh trực giao được chụp bằng cả camera vệ tinh và camera trên máy bay, cung cấp hình ảnh từ trên xuống (điểm thiên để) của trái đất.
Bản đồ đường đồng mức có bóng đổ.
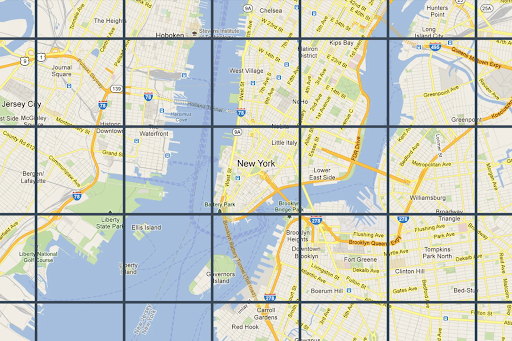
Tất cả các ô bản đồ 2D đều được tham chiếu địa lý và căn chỉnh với nhau. Các ô này được chọn dựa trên phạm vi địa lý của khung nhìn và mức thu phóng. Các mức thu phóng có phạm vi từ 0 (để xem toàn bộ thế giới) đến 22 (để xem đường phố và các khối nhà).
Chủ đề bản đồ
Bạn có thể nhận được các ô bản đồ cho những chủ đề bản đồ sau.
Giao diện bản đồ
Mô tả
Lộ trình
Đường, toà nhà, địa điểm yêu thích và ranh giới hành chính
Vệ tinh
Hình ảnh chụp ảnh từ không gian
Địa hình
Bản đồ đường viền cho thấy các đặc điểm tự nhiên như thảm thực vật
Lưu ý: Các ô bản đồ có thể bao gồm một hoặc nhiều lớp. Ví dụ: bạn có thể phủ một lớp lộ trình lên trên một giao diện bản đồ vệ tinh. Để biết thêm thông tin, hãy xem phần Trường không bắt buộc .
Để yêu cầu các ô bản đồ từ Map Tiles API, trước tiên, bạn phải yêu cầu một mã thông báo phiên . Mã thông báo phiên theo dõi trạng thái hiện tại của bản đồ và khung hiển thị. Khi thiết lập mã thông báo phiên, bạn phải đặt giá trị mapType
sao cho khớp với chủ đề bản đồ mà bạn muốn.
Sau đó, bạn phải thêm mã thông báo phiên vào từng yêu cầu gửi đến Map Tiles API.
Yêu cầu thông tin về khung nhìn
Khung nhìn xác định kích thước của hộp tạo khung cho cảnh thế giới. Các yêu cầu thông tin về khung nhìn sẽ trả về thông tin chi tiết về các ô bản đồ tạo nên khung nhìn hiện tại của bạn. Lý do bạn yêu cầu thông tin về khung hiển thị là để đảm bảo rằng bạn không yêu cầu hình ảnh ở những mức thu phóng không tồn tại.
Ví dụ: hầu hết các thành phố đều có hình ảnh ở mức thu phóng 22, nhưng đại dương thì không vì nó sẽ chỉ hiển thị các ô vuông màu xanh dương không có đối tượng.
Lưu ý: Nội dung phản hồi bao gồm thông tin ghi nhận quyền tác giả mà bạn phải hiển thị cùng với bản đồ và cấp độ thu phóng tối đa – nhờ đó, bạn có thể tạo một thanh trượt thu phóng. Để biết thêm thông tin, hãy xem Chính sách Map Tiles API .
Yêu cầu về khung hiển thị là một yêu cầu HTTPS GET có dạng như sau.
curl "https://tile.googleapis.com/tile/v1/viewport ?session=YOUR_SESSION_TOKEN &key=YOUR_API_KEY &zoom=zoom &north=north &south=south &east=east &west=west "
Yêu cầu này chứa các trường sau:
zoom
Mức thu phóng của khung nhìn.
north
, south
, east
, west
Các điểm cực bắc, cực nam, cực đông và cực tây trong khung hiển thị, được biểu thị bằng độ. Phía bắc và phía nam phải nằm trong phạm vi (-90,90), phía đông và phía tây phải nằm trong phạm vi (-180, 180). Để biểu thị ranh giới vượt qua đường đổi ngày quốc tế, phía tây có thể là số dương (ví dụ: 170) và phía đông có thể là số âm (ví dụ: -170). Bạn phải cung cấp tất cả các tham số.
Thông tin phản hồi về khung nhìn
Phản hồi của khung hiển thị cho biết những khu vực có hình ảnh và mức thu phóng. Phản hồi thông tin về khung hiển thị có dạng như sau.
{
"copyright" : "Map data ©2023" ,
"maxZoomRects" : [
{
"maxZoom" : 19 ,
"north" : 90 ,
"south" : -90 ,
"east" : 180 ,
"west" : -180
},
{
"maxZoom" : 9 ,
"north" : 90 ,
"south" : -90 ,
"east" : 180 ,
"west" : -180
},
{
"maxZoom" : 14 ,
"north" : 84.375 ,
"south" : -84.375 ,
"east" : 180 ,
"west" : -180
}, ...
]
}
Lưu ý: Trong ví dụ này, mảng maxZoomRects
chứa nhiều đối tượng hơn những đối tượng được hiển thị.
Phần nội dung phản hồi chứa các trường sau.
copyright
Chứa một chuỗi ghi nhận quyền tác giả mà bạn phải hiển thị trên bản đồ khi hiển thị các ô đường và ô vệ tinh. Để biết thêm thông tin, hãy xem Chính sách về Map Tiles API .
maxZoomRect
Chứa một mảng các hình chữ nhật bao quanh chồng lên khung hiển thị hiện tại. Cũng chứa mức thu phóng tối đa có trong mỗi hình chữ nhật.
Hàm toạ độ ô vuông
Các công cụ (hàm đơn giản) có trong hầu hết các ngôn ngữ lập trình để chuyển đổi từ cặp vĩ độ/kinh độ sang toạ độ ô ở một mức thu phóng cụ thể.
Hãy xem xét ví dụ về mã JavaScript sau đây. Ví dụ này trước tiên chuyển đổi từ latLng
sang một điểm, sau đó chuyển đổi từ một điểm sang toạ độ ô.
var TILE_SIZE = 256 ;
function fromLatLngToPoint ( latLng ) {
var mercator = - Math . log ( Math . tan (( 0.25 + latLng . lat () / 360 ) * Math . PI ));
return {
x : TILE_SIZE * ( latLng . lng () / 360 + 0.5 ),
y : TILE_SIZE / 2 * ( 1 + mercator / Math . PI )
};
}
function fromLatLngToTileCoord ( latLng , zoom ) {
var point = fromLatLngToPoint ( latLng );
var scale = Math . pow ( 2 , zoom );
return {
x : Math . floor ( point . x * scale / TILE_SIZE ),
y : Math . floor ( point . y * scale / TILE_SIZE ),
z : zoom
};
}
Gửi ý kiến phản hồi
Trừ phi có lưu ý khác, nội dung của trang này được cấp phép theo Giấy phép ghi nhận tác giả 4.0 của Creative Commons và các mẫu mã lập trình được cấp phép theo Giấy phép Apache 2.0 . Để biết thông tin chi tiết, vui lòng tham khảo Chính sách trang web của Google Developers . Java là nhãn hiệu đã đăng ký của Oracle và/hoặc các đơn vị liên kết với Oracle.
Cập nhật lần gần đây nhất: 2025-09-04 UTC.
Bạn muốn chia sẻ thêm với chúng tôi?
[[["Dễ hiểu","easyToUnderstand","thumb-up"],["Giúp tôi giải quyết được vấn đề","solvedMyProblem","thumb-up"],["Khác","otherUp","thumb-up"]],[["Thiếu thông tin tôi cần","missingTheInformationINeed","thumb-down"],["Quá phức tạp/quá nhiều bước","tooComplicatedTooManySteps","thumb-down"],["Đã lỗi thời","outOfDate","thumb-down"],["Vấn đề về bản dịch","translationIssue","thumb-down"],["Vấn đề về mẫu/mã","samplesCodeIssue","thumb-down"],["Khác","otherDown","thumb-down"]],["Cập nhật lần gần đây nhất: 2025-09-04 UTC."],[[["\u003cp\u003eMap Tiles API allows access to various thematic geodatasets like roadmap, orthophotography, and hillshade, dividing the world into an indexed grid for efficient data utilization.\u003c/p\u003e\n"],["\u003cp\u003eMap tiles are available in roadmap, satellite, and terrain themes, and can be overlaid for richer visualizations.\u003c/p\u003e\n"],["\u003cp\u003eA session token is required for accessing Map Tiles API, which tracks the map state and desired theme.\u003c/p\u003e\n"],["\u003cp\u003eViewport information requests help determine available zoom levels and imagery for a specific area to avoid requesting non-existent data.\u003c/p\u003e\n"],["\u003cp\u003eTile coordinate functions can be used to convert latitude/longitude pairs into tile coordinates for specific zoom levels, enabling precise map tile retrieval.\u003c/p\u003e\n"]]],["Map Tiles API provides access to geodatasets, including roadmap, satellite, and terrain themes, divided into an indexed grid. Users request a session token and specify a map theme. Viewport information, obtained via HTTPS GET requests, determines the available imagery and zoom levels (0-22) within a defined area. Responses include copyright attribution and maximum zoom levels. Tile coordinate functions convert latitude/longitude to tile coordinates for specific zoom levels.\n"],null,["# 2D Tiles overview\n\n**European Economic Area (EEA) developers** If your billing address is in the European Economic Area, effective on 8 July 2025, the [Google\n| Maps Platform EEA Terms of Service](https://cloud.google.com/terms/maps-platform/eea) will apply to your use of the Services. [Learn more](/maps/comms/eea/faq). In addition, certain content from the Map Tiles API will no longer be returned. [Learn more](/maps/comms/eea/map-tiles).\n\nMap Tiles are simply the division of the world into an indexed\ngrid. It lets you access and utilize map data efficiently and dynamically\nat multiple cartographic scales. Map Tiles API gives you access to\nmultiple thematic geodatasets, including Google-curated:\n\n- Roadmap image tiles based on vector topographic data with Google's\n cartographic styling.\n\n- Orthophotography captured by both satellite and airborne cameras that deliver\n top down (nadir) imagery of the earth.\n\n- Hillshade contour maps.\n\n2D Map Tiles are all georeferenced and aligned to each other. They're selected\nbased on the geographic extent of the viewport and the zoom level. Zoom levels\nrange from zero (to view the world in its entirety) to 22 (to view streets and\nblocks).\n\nMap themes\n----------\n\nYou can get map tiles for the following map themes.\n\n| Map theme | Description |\n|-------------------------------------------------|----------------------------------------------------------------|\n| [Roadmap](/maps/documentation/tile/roadmap) | Roads, buildings, points of interest, and political boundaries |\n| [Satellite](/maps/documentation/tile/satellite) | Photographic imagery taken from space |\n| [Terrain](/maps/documentation/tile/terrain) | A contour map that shows natural features such as vegetation |\n\n| **Note:** Map tiles can consist of one or more layers. For example, a roadmap layer can be overlaid on top of a satellite map theme. For more information, see [Optional fields](/maps/documentation/tile/session_tokens#optional_fields).\n\nTo request map tiles from Map Tiles API, you must first request a\n[session token](/maps/documentation/tile/session_tokens). The session token\ntracks the current state of your map and viewport. When you set up your session\ntoken, you must set the `mapType` value to match the map theme that you want.\nThen, you must include the session token in each of your requests to\nMap Tiles API.\n\nViewport information requests\n-----------------------------\n\nThe viewport defines the size of the box that frames the world scene. Viewport\ninformation requests return details about the map tiles that make up your\ncurrent viewport. The reason that you request viewport information is to ensure\nthat you avoid requesting imagery at zoom levels that don't exist.\n\nFor example, most cities have imagery at zoom level 22, but not the ocean since\nit would just end up displaying featureless blue squares.\n| **Note:** Included in the response is the attribution that you must display with your map, and the maximum zoom level---so you can build a zoom slider. For more information, see the [Map Tiles API Policies](/maps/documentation/tile/policies#map-tiles-api).\n\nThe viewport request is an HTTPS GET request in the following form. \n\n```json\ncurl \"https://tile.googleapis.com/tile/v1/viewport?session=\u003cvar class=\"apiparam\" translate=\"no\"\u003eYOUR_SESSION_TOKEN\u003c/var\u003e&key=YOUR_API_KEY&zoom=\u003cvar class=\"apiparam\" translate=\"no\"\u003ezoom\u003c/var\u003e&north=\u003cvar class=\"apiparam\" translate=\"no\"\u003enorth\u003c/var\u003e&south=\u003cvar class=\"apiparam\" translate=\"no\"\u003esouth\u003c/var\u003e&east=\u003cvar class=\"apiparam\" translate=\"no\"\u003eeast\u003c/var\u003e&west=\u003cvar class=\"apiparam\" translate=\"no\"\u003ewest\u003c/var\u003e\"\n```\n\nThe request contains the following fields:\n\n`zoom`\n: The zoom level of the viewport.\n\n`north`, `south`, `east`, `west`\n: The furthest north, south, east, and west points in the viewport, expressed in\n degrees. North and south must be in the range (-90,90), east and west must be in\n the range (-180, 180). To express bounds crossing the antimeridian, west can be\n positive (for example, 170) and east can be negative (for example, -170). All\n parameters are required.\n\nViewport information responses\n------------------------------\n\nThe viewport response tells you which areas have imagery, and at which zoom\nlevels. A viewport information response has the following form. \n\n {\n \"copyright\": \"Map data ©2023\",\n \"maxZoomRects\": [\n {\n \"maxZoom\": 19,\n \"north\": 90,\n \"south\": -90,\n \"east\": 180,\n \"west\": -180\n },\n {\n \"maxZoom\": 9,\n \"north\": 90,\n \"south\": -90,\n \"east\": 180,\n \"west\": -180\n },\n {\n \"maxZoom\": 14,\n \"north\": 84.375,\n \"south\": -84.375,\n \"east\": 180,\n \"west\": -180\n }, ...\n ]\n }\n\n| **Note:** In this example, the `maxZoomRects` array contains more objects than is shown.\n\nThe response body contains the following fields.\n\n`copyright`\n: Contains an attribution string that you must display on your map when you\n display roadmap and satellite tiles. For more information, see the\n [Map Tiles API Policies](/maps/documentation/tile/policies#map-tiles-api).\n\n`maxZoomRect`\n: Contains an array of bounding rectangles that overlap with the current\n viewport. Also contains the maximum zoom level available within each rectangle.\n\nTile coordinate functions\n-------------------------\n\nTools (simple functions) are available in most programming languages to convert\nfrom latitude/longitude pairs to tile coordinates at a specific zoom level.\nConsider the following JavaScript code example that first converts from a\n`latLng` to a point, and then from a point to tile coordinates. \n\n var TILE_SIZE = 256;\n\n function fromLatLngToPoint(latLng) {\n var mercator = -Math.log(Math.tan((0.25 + latLng.lat() / 360) * Math.PI));\n return {\n x: TILE_SIZE * (latLng.lng() / 360 + 0.5),\n y: TILE_SIZE / 2 * (1 + mercator / Math.PI)\n };\n }\n\n function fromLatLngToTileCoord(latLng, zoom) {\n var point = fromLatLngToPoint(latLng);\n var scale = Math.pow(2, zoom);\n\n return {\n x: Math.floor(point.x * scale / TILE_SIZE),\n y: Math.floor(point.y * scale / TILE_SIZE),\n z: zoom\n };\n }"]]