Geri bildirim gönderin
2D Kartlara genel bakış
Koleksiyonlar ile düzeninizi koruyun
İçeriği tercihlerinize göre kaydedin ve kategorilere ayırın.
Avrupa Ekonomik Alanı (AEA) geliştiricileri
Harita döşemeleri, dünyanın indekslenmiş bir ızgaraya bölünmesidir. Bu API, harita verilerine birden fazla kartografik ölçekte verimli ve dinamik bir şekilde erişmenizi ve bu verilerden yararlanmanızı sağlar. Map Tiles API, Google tarafından derlenenler de dahil olmak üzere birden fazla tematik coğrafi veri kümesine erişmenizi sağlar:
Google'ın kartografik stiline sahip, vektörel topografik verilere dayalı yol haritası resim döşemeleri.
Hem uydu hem de havadan çekilen kameralarla elde edilen, dünyanın yukarıdan (nadir) görüntülerini sağlayan ortofotoğraflar.
Eğimli arazi kontur haritaları.
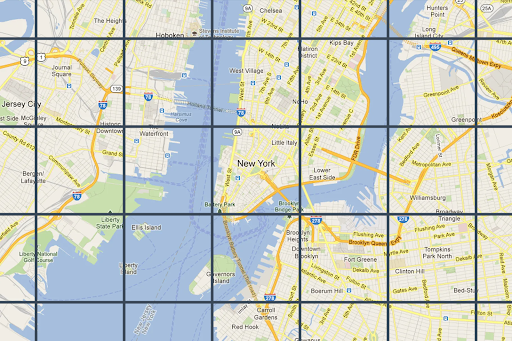
2D harita döşemelerinin tümü coğrafi olarak referanslandırılmıştır ve birbirleriyle hizalanmıştır. Görüntü alanının coğrafi kapsamına ve yakınlaştırma düzeyine göre seçilir. Yakınlaştırma düzeyleri, sıfır (dünyanın tamamını görüntülemek için) ile 22 (sokakları ve blokları görüntülemek için) arasında değişir.
Harita temaları
Aşağıdaki harita temaları için harita döşemeleri alabilirsiniz.
Harita teması
Açıklama
Yol haritası
Yollar, binalar, ilgi çekici yerler ve siyasi sınırlar
Uydu
Uzaydan çekilmiş fotoğraf görüntüleri
Arazi
Bitki örtüsü gibi doğal özellikleri gösteren bir kontur haritası
Not: Harita döşemeleri bir veya daha fazla katmandan oluşabilir. Örneğin, bir yol haritası katmanı uydu haritası temasının üzerine yerleştirilebilir. Daha fazla bilgi için İsteğe bağlı alanlar başlıklı makaleyi inceleyin.
Map Tiles API'den harita döşemeleri istemek için önce oturum jetonu istemeniz gerekir. Oturum jetonu, haritanızın ve görünüm alanınızın mevcut durumunu izler. Oturum jetonunuzu ayarlarken mapType
değerini istediğiniz harita temasıyla eşleşecek şekilde ayarlamanız gerekir.
Ardından, Harita Döşemeleri API'sine yaptığınız her isteğe oturum jetonunu eklemeniz gerekir.
Görüntü alanı bilgi istekleri
Görüntü alanı, dünya sahnesini çerçeveleyen kutunun boyutunu tanımlar. Görüntü alanı
bilgi istekleri, mevcut görüntü alanınızı oluşturan harita döşemeleriyle ilgili ayrıntıları döndürür. Görünüm alanı bilgilerini istemenizin nedeni, mevcut olmayan yakınlaştırma düzeylerinde görüntü istemekten kaçınmaktır.
Örneğin, çoğu şehirde 22. yakınlaştırma düzeyinde görüntüler bulunur ancak okyanuslarda bulunmaz. Çünkü okyanuslar, yalnızca özellik içermeyen mavi kareler olarak gösterilir.
Not: Yanıtta, haritanızla birlikte göstermeniz gereken atıf ve maksimum yakınlaştırma düzeyi yer alır. Böylece, yakınlaştırma kaydırıcı oluşturabilirsiniz. Daha fazla bilgi için Map Tiles API Politikaları 'na bakın.
Görüntü alanı isteği, aşağıdaki biçimde bir HTTPS GET isteğidir.
curl "https://tile.googleapis.com/tile/v1/viewport ?session=YOUR_SESSION_TOKEN &key=YOUR_API_KEY &zoom=zoom &north=north &south=south &east=east &west=west "
İstek aşağıdaki alanları içerir:
zoom
Görüntü alanının yakınlaştırma düzeyi.
north
, south
, east
, west
Görüntü alanındaki en kuzey, güney, doğu ve batı noktaları derece cinsinden ifade edilir. Kuzey ve güney (-90,90) aralığında, doğu ve batı ise (-180, 180) aralığında olmalıdır. Antimeridyeni geçen sınırları ifade etmek için batı pozitif (örneğin, 170), doğu ise negatif (örneğin, -170) olabilir. Tüm
parametreler gereklidir.
Görüntü alanı bilgisi yanıtları
Görüntü alanı yanıtı, hangi alanlarda görüntü olduğunu ve hangi yakınlaştırma düzeylerinde olduğunu gösterir. Görüntü alanı bilgisi yanıtı aşağıdaki biçimdedir.
{
"copyright" : "Map data ©2023" ,
"maxZoomRects" : [
{
"maxZoom" : 19 ,
"north" : 90 ,
"south" : -90 ,
"east" : 180 ,
"west" : -180
},
{
"maxZoom" : 9 ,
"north" : 90 ,
"south" : -90 ,
"east" : 180 ,
"west" : -180
},
{
"maxZoom" : 14 ,
"north" : 84.375 ,
"south" : -84.375 ,
"east" : 180 ,
"west" : -180
}, ...
]
}
Not: Bu örnekte, maxZoomRects
dizisi gösterilenden daha fazla nesne içeriyor.
Yanıt gövdesinde aşağıdaki alanlar bulunur.
copyright
Yol haritası ve uydu döşemelerini gösterdiğinizde haritanızda göstermeniz gereken bir ilişkilendirme dizesi içerir. Daha fazla bilgi için Map Tiles API Politikaları 'na bakın.
maxZoomRect
Geçerli görünüm penceresiyle çakışan sınırlayıcı dikdörtgenler dizisini içerir. Ayrıca, her dikdörtgen içinde kullanılabilen maksimum yakınlaştırma düzeyini de içerir.
Parça koordinatı işlevleri
Enlem/boylam çiftlerini belirli bir yakınlaştırma düzeyinde karo koordinatlarına dönüştürmek için çoğu programlama dilinde araçlar (basit işlevler) mevcuttur.
Önce latLng
işaretinden noktaya, ardından noktadan karo koordinatlarına dönüştüren aşağıdaki JavaScript kodu örneğini inceleyin.
var TILE_SIZE = 256 ;
function fromLatLngToPoint ( latLng ) {
var mercator = - Math . log ( Math . tan (( 0.25 + latLng . lat () / 360 ) * Math . PI ));
return {
x : TILE_SIZE * ( latLng . lng () / 360 + 0.5 ),
y : TILE_SIZE / 2 * ( 1 + mercator / Math . PI )
};
}
function fromLatLngToTileCoord ( latLng , zoom ) {
var point = fromLatLngToPoint ( latLng );
var scale = Math . pow ( 2 , zoom );
return {
x : Math . floor ( point . x * scale / TILE_SIZE ),
y : Math . floor ( point . y * scale / TILE_SIZE ),
z : zoom
};
}
Geri bildirim gönderin
Aksi belirtilmediği sürece bu sayfanın içeriği Creative Commons Atıf 4.0 Lisansı altında ve kod örnekleri Apache 2.0 Lisansı altında lisanslanmıştır. Ayrıntılı bilgi için Google Developers Site Politikaları 'na göz atın. Java, Oracle ve/veya satış ortaklarının tescilli ticari markasıdır.
Son güncelleme tarihi: 2025-09-04 UTC.
Bize geri bildirimde bulunmak mı istiyorsunuz?
[[["Anlaması kolay","easyToUnderstand","thumb-up"],["Sorunumu çözdü","solvedMyProblem","thumb-up"],["Diğer","otherUp","thumb-up"]],[["İhtiyacım olan bilgiler yok","missingTheInformationINeed","thumb-down"],["Çok karmaşık / çok fazla adım var","tooComplicatedTooManySteps","thumb-down"],["Güncel değil","outOfDate","thumb-down"],["Çeviri sorunu","translationIssue","thumb-down"],["Örnek veya kod sorunu","samplesCodeIssue","thumb-down"],["Diğer","otherDown","thumb-down"]],["Son güncelleme tarihi: 2025-09-04 UTC."],[[["\u003cp\u003eMap Tiles API allows access to various thematic geodatasets like roadmap, orthophotography, and hillshade, dividing the world into an indexed grid for efficient data utilization.\u003c/p\u003e\n"],["\u003cp\u003eMap tiles are available in roadmap, satellite, and terrain themes, and can be overlaid for richer visualizations.\u003c/p\u003e\n"],["\u003cp\u003eA session token is required for accessing Map Tiles API, which tracks the map state and desired theme.\u003c/p\u003e\n"],["\u003cp\u003eViewport information requests help determine available zoom levels and imagery for a specific area to avoid requesting non-existent data.\u003c/p\u003e\n"],["\u003cp\u003eTile coordinate functions can be used to convert latitude/longitude pairs into tile coordinates for specific zoom levels, enabling precise map tile retrieval.\u003c/p\u003e\n"]]],["Map Tiles API provides access to geodatasets, including roadmap, satellite, and terrain themes, divided into an indexed grid. Users request a session token and specify a map theme. Viewport information, obtained via HTTPS GET requests, determines the available imagery and zoom levels (0-22) within a defined area. Responses include copyright attribution and maximum zoom levels. Tile coordinate functions convert latitude/longitude to tile coordinates for specific zoom levels.\n"],null,["# 2D Tiles overview\n\n**European Economic Area (EEA) developers** If your billing address is in the European Economic Area, effective on 8 July 2025, the [Google\n| Maps Platform EEA Terms of Service](https://cloud.google.com/terms/maps-platform/eea) will apply to your use of the Services. [Learn more](/maps/comms/eea/faq). In addition, certain content from the Map Tiles API will no longer be returned. [Learn more](/maps/comms/eea/map-tiles).\n\nMap Tiles are simply the division of the world into an indexed\ngrid. It lets you access and utilize map data efficiently and dynamically\nat multiple cartographic scales. Map Tiles API gives you access to\nmultiple thematic geodatasets, including Google-curated:\n\n- Roadmap image tiles based on vector topographic data with Google's\n cartographic styling.\n\n- Orthophotography captured by both satellite and airborne cameras that deliver\n top down (nadir) imagery of the earth.\n\n- Hillshade contour maps.\n\n2D Map Tiles are all georeferenced and aligned to each other. They're selected\nbased on the geographic extent of the viewport and the zoom level. Zoom levels\nrange from zero (to view the world in its entirety) to 22 (to view streets and\nblocks).\n\nMap themes\n----------\n\nYou can get map tiles for the following map themes.\n\n| Map theme | Description |\n|-------------------------------------------------|----------------------------------------------------------------|\n| [Roadmap](/maps/documentation/tile/roadmap) | Roads, buildings, points of interest, and political boundaries |\n| [Satellite](/maps/documentation/tile/satellite) | Photographic imagery taken from space |\n| [Terrain](/maps/documentation/tile/terrain) | A contour map that shows natural features such as vegetation |\n\n| **Note:** Map tiles can consist of one or more layers. For example, a roadmap layer can be overlaid on top of a satellite map theme. For more information, see [Optional fields](/maps/documentation/tile/session_tokens#optional_fields).\n\nTo request map tiles from Map Tiles API, you must first request a\n[session token](/maps/documentation/tile/session_tokens). The session token\ntracks the current state of your map and viewport. When you set up your session\ntoken, you must set the `mapType` value to match the map theme that you want.\nThen, you must include the session token in each of your requests to\nMap Tiles API.\n\nViewport information requests\n-----------------------------\n\nThe viewport defines the size of the box that frames the world scene. Viewport\ninformation requests return details about the map tiles that make up your\ncurrent viewport. The reason that you request viewport information is to ensure\nthat you avoid requesting imagery at zoom levels that don't exist.\n\nFor example, most cities have imagery at zoom level 22, but not the ocean since\nit would just end up displaying featureless blue squares.\n| **Note:** Included in the response is the attribution that you must display with your map, and the maximum zoom level---so you can build a zoom slider. For more information, see the [Map Tiles API Policies](/maps/documentation/tile/policies#map-tiles-api).\n\nThe viewport request is an HTTPS GET request in the following form. \n\n```json\ncurl \"https://tile.googleapis.com/tile/v1/viewport?session=\u003cvar class=\"apiparam\" translate=\"no\"\u003eYOUR_SESSION_TOKEN\u003c/var\u003e&key=YOUR_API_KEY&zoom=\u003cvar class=\"apiparam\" translate=\"no\"\u003ezoom\u003c/var\u003e&north=\u003cvar class=\"apiparam\" translate=\"no\"\u003enorth\u003c/var\u003e&south=\u003cvar class=\"apiparam\" translate=\"no\"\u003esouth\u003c/var\u003e&east=\u003cvar class=\"apiparam\" translate=\"no\"\u003eeast\u003c/var\u003e&west=\u003cvar class=\"apiparam\" translate=\"no\"\u003ewest\u003c/var\u003e\"\n```\n\nThe request contains the following fields:\n\n`zoom`\n: The zoom level of the viewport.\n\n`north`, `south`, `east`, `west`\n: The furthest north, south, east, and west points in the viewport, expressed in\n degrees. North and south must be in the range (-90,90), east and west must be in\n the range (-180, 180). To express bounds crossing the antimeridian, west can be\n positive (for example, 170) and east can be negative (for example, -170). All\n parameters are required.\n\nViewport information responses\n------------------------------\n\nThe viewport response tells you which areas have imagery, and at which zoom\nlevels. A viewport information response has the following form. \n\n {\n \"copyright\": \"Map data ©2023\",\n \"maxZoomRects\": [\n {\n \"maxZoom\": 19,\n \"north\": 90,\n \"south\": -90,\n \"east\": 180,\n \"west\": -180\n },\n {\n \"maxZoom\": 9,\n \"north\": 90,\n \"south\": -90,\n \"east\": 180,\n \"west\": -180\n },\n {\n \"maxZoom\": 14,\n \"north\": 84.375,\n \"south\": -84.375,\n \"east\": 180,\n \"west\": -180\n }, ...\n ]\n }\n\n| **Note:** In this example, the `maxZoomRects` array contains more objects than is shown.\n\nThe response body contains the following fields.\n\n`copyright`\n: Contains an attribution string that you must display on your map when you\n display roadmap and satellite tiles. For more information, see the\n [Map Tiles API Policies](/maps/documentation/tile/policies#map-tiles-api).\n\n`maxZoomRect`\n: Contains an array of bounding rectangles that overlap with the current\n viewport. Also contains the maximum zoom level available within each rectangle.\n\nTile coordinate functions\n-------------------------\n\nTools (simple functions) are available in most programming languages to convert\nfrom latitude/longitude pairs to tile coordinates at a specific zoom level.\nConsider the following JavaScript code example that first converts from a\n`latLng` to a point, and then from a point to tile coordinates. \n\n var TILE_SIZE = 256;\n\n function fromLatLngToPoint(latLng) {\n var mercator = -Math.log(Math.tan((0.25 + latLng.lat() / 360) * Math.PI));\n return {\n x: TILE_SIZE * (latLng.lng() / 360 + 0.5),\n y: TILE_SIZE / 2 * (1 + mercator / Math.PI)\n };\n }\n\n function fromLatLngToTileCoord(latLng, zoom) {\n var point = fromLatLngToPoint(latLng);\n var scale = Math.pow(2, zoom);\n\n return {\n x: Math.floor(point.x * scale / TILE_SIZE),\n y: Math.floor(point.y * scale / TILE_SIZE),\n z: zoom\n };\n }"]]