 मैप टाइलें, दुनिया को इंडेक्स किए गए ग्रिड में बांटने का तरीका है. इससे आपको कई कार्टोग्राफ़िक स्केल पर, मैप डेटा को बेहतर तरीके से और डाइनैमिक तरीके से ऐक्सेस करने और इस्तेमाल करने में मदद मिलती है. Map Tiles API की मदद से, आपको कई थीम वाले जियोडेटासेट का ऐक्सेस मिलता है. इनमें Google के चुने हुए ये जियोडेटासेट शामिल हैं:
Google की कार्टोग्राफ़िक स्टाइलिंग के साथ, वेक्टर टोपोग्राफ़िक डेटा पर आधारित रोडमैप इमेज टाइल.
सैटलाइट और एयरबोर्न कैमरे, दोनों से ली गई ऑर्थोफ़ोटोग्राफ़ी. इससे पृथ्वी की ऊपर से (नादिर) इमेज मिलती है.
हिलशेड कॉन्टूर मैप.
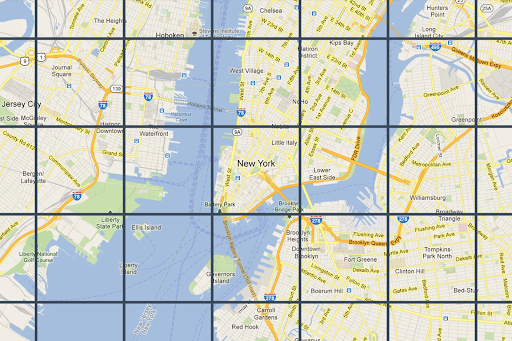
2D मैप टाइलें, सभी जियोरेफ़रंस की गई हैं और एक-दूसरे के साथ अलाइन की गई हैं. इन्हें व्यूपोर्ट के भौगोलिक दायरे और ज़ूम लेवल के आधार पर चुना जाता है. ज़ूम लेवल, शून्य से लेकर 22 तक होते हैं. शून्य का मतलब है कि पूरी दुनिया को देखा जा सकता है, जबकि 22 का मतलब है कि सड़कों और ब्लॉक को देखा जा सकता है.
मैप की थीम
आपको मैप की इन थीम के लिए मैप टाइल मिल सकती हैं.
| मैप की थीम | ब्यौरा |
|---|---|
| रोडमैप | सड़कें, इमारतें, लोकप्रिय जगहें, और राजनैतिक सीमाएं |
| सैटलाइट | अंतरिक्ष से ली गई फ़ोटोग्राफ़िक इमेज |
| इलाका | वनस्पति जैसी प्राकृतिक चीज़ों को दिखाने वाला कॉन्टूर मैप |
Map Tiles API से मैप टाइल का अनुरोध करने के लिए, आपको सबसे पहले सेशन टोकन का अनुरोध करना होगा. सेशन टोकन, आपके मैप और व्यूपोर्ट की मौजूदा स्थिति को ट्रैक करता है. सेशन टोकन सेट अप करते समय, आपको mapType वैल्यू को उस मैप थीम से मैच करना होगा जो आपको चाहिए.
इसके बाद, आपको Map Tiles API को भेजे जाने वाले हर अनुरोध में सेशन टोकन शामिल करना होगा.
व्यूपोर्ट की जानकारी के अनुरोध
व्यूपोर्ट से, दुनिया के सीन को फ़्रेम करने वाले बॉक्स का साइज़ तय होता है. व्यूपोर्ट की जानकारी के अनुरोधों से, मैप की उन टाइलों के बारे में जानकारी मिलती है जो आपके मौजूदा व्यूपोर्ट को बनाती हैं. व्यू पोर्ट की जानकारी का अनुरोध करने की वजह यह है कि आप ऐसे ज़ूम लेवल पर इमेज का अनुरोध न करें जो मौजूद नहीं हैं.
उदाहरण के लिए, ज़्यादातर शहरों की इमेज, ज़ूम लेवल 22 पर उपलब्ध होती हैं. हालांकि, महासागर की इमेज इस लेवल पर उपलब्ध नहीं होती, क्योंकि इसमें सिर्फ़ नीले रंग के स्क्वेयर दिखते हैं.
व्यू पोर्ट का अनुरोध, इस तरह का एचटीटीपीएस GET अनुरोध होता है.
curl "https://tile.googleapis.com/tile/v1/viewport?session=YOUR_SESSION_TOKEN &key=YOUR_API_KEY &zoom=zoom &north=north &south=south &east=east &west=west"
अनुरोध में ये फ़ील्ड शामिल होते हैं:
zoom- व्यूपोर्ट का ज़ूम लेवल.
north,south,east,west- व्यू पोर्ट में सबसे उत्तरी, दक्षिणी, पूर्वी, और पश्चिमी बिंदु, डिग्री में दिखाए जाते हैं. उत्तर और दक्षिण, (-90,90) की रेंज में होने चाहिए. साथ ही, पूरब और पश्चिम, (-180, 180) की रेंज में होने चाहिए. एंटीमेरिडियन को पार करने वाले बाउंड्री बॉक्स को दिखाने के लिए, पश्चिम को पॉज़िटिव (उदाहरण के लिए, 170) और पूरब को नेगेटिव (उदाहरण के लिए, -170) के तौर पर दिखाया जा सकता है. सभी पैरामीटर ज़रूरी हैं.
व्यूपोर्ट की जानकारी से जुड़े जवाब
व्यूपोर्ट रिस्पॉन्स से पता चलता है कि किन इलाकों की इमेज उपलब्ध हैं और उन्हें किस ज़ूम लेवल पर देखा जा सकता है. व्यू पोर्ट की जानकारी देने वाले रिस्पॉन्स का फ़ॉर्मैट यहां दिया गया है.
{
  "copyright": "Map data ©2023",
  "maxZoomRects": [
    {
      "maxZoom": 19,
      "north": 90,
      "south": -90,
      "east": 180,
      "west": -180
    },
    {
      "maxZoom": 9,
      "north": 90,
      "south": -90,
      "east": 180,
      "west": -180
    },
    {
      "maxZoom": 14,
      "north": 84.375,
      "south": -84.375,
      "east": 180,
      "west": -180
    }, ...
  ]
}
जवाब के मुख्य हिस्से में ये फ़ील्ड शामिल होते हैं.
copyright- इसमें एट्रिब्यूशन स्ट्रिंग होती है. रोडमैप और सैटेलाइट टाइलें दिखाते समय, आपको इसे अपने मैप पर दिखाना होगा. ज़्यादा जानकारी के लिए, Map Tiles API की नीतियां देखें.
maxZoomRect- इसमें बाउंडिंग रेक्टैंगल का एक ऐसा कलेक्शन होता है जो मौजूदा व्यूपोर्ट के साथ ओवरलैप होता है. इसमें हर रेक्टैंगल में उपलब्ध ज़्यादा से ज़्यादा ज़ूम लेवल भी शामिल होता है.
टाइल कोऑर्डिनेट फ़ंक्शन
ज़्यादातर प्रोग्रामिंग भाषाओं में टूल (सामान्य फ़ंक्शन) उपलब्ध होते हैं. इनका इस्तेमाल करके, किसी खास ज़ूम लेवल पर अक्षांश/देशांतर के जोड़े को टाइल के निर्देशांकों में बदला जा सकता है.
यहां JavaScript कोड का एक उदाहरण दिया गया है. इसमें पहले latLng को पॉइंट में बदला जाता है. इसके बाद, पॉइंट को टाइल के कोऑर्डिनेट में बदला जाता है.
var TILE_SIZE = 256;

function fromLatLngToPoint(latLng) {
  var mercator = -Math.log(Math.tan((0.25 + latLng.lat() / 360) * Math.PI));
  return {
    x: TILE_SIZE * (latLng.lng() / 360 + 0.5),
    y: TILE_SIZE / 2 * (1 +  mercator / Math.PI)
  };
}

function fromLatLngToTileCoord(latLng, zoom) {
  var point = fromLatLngToPoint(latLng);
  var scale = Math.pow(2, zoom);

  return {
    x: Math.floor(point.x * scale / TILE_SIZE),
    y: Math.floor(point.y * scale / TILE_SIZE),
    z: zoom
  };
}