The PLACES_COUNT_PER_GEO function takes an array of geographic areas to search
and returns a table of places counts per area. For example, if you specify an
array of zip codes as the search area, the response contains a table with a
separate row for each zip code.
Because the PLACES_COUNT_PER_GEO function returns a table, call it using
a FROM clause.
Input parameters:
Required: The
geographiesfilter parameter that specifies the search area. Thegeographiesparameter takes an array of values defined by the BigQueryGEOGRAPHYdata type, which supports points, linestrings, and polygons.Optional: Additional filter parameters to refine your search.
Returns:
- A table with one row per geographic area. The table contains the columns
geography(GEOGRAPHY),count(INT64), andplace_ids(ARRAY<STRING>) whereplace_idscontains up to 250 place IDs for each geographic area.
- A table with one row per geographic area. The table contains the columns
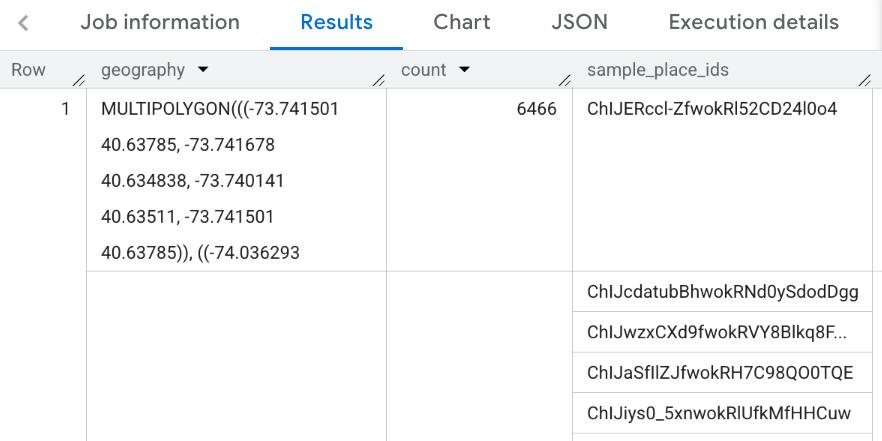
Example: Calculate the number of restaurants in each county of New York City
This example generates a table of counts of operational restaurants per county in New York City.
This example uses the United States Census Bureau
Data
BigQuery public dataset to get
the boundaries for the three counties in New York City: "Queens","Kings", "New
York". The boundaries of each county are contained in the county_geom column.
This example then uses the BigQuery
ST_SIMPLIFY
function to return a simplified version of county_geom. The ST_SIMPLIFY
function replaces nearly straight chains of edges with a single long edge.
DECLARE geos ARRAY<GEOGRAPHY>;

SET geos = (SELECT ARRAY_AGG(ST_SIMPLIFY(county_geom, 100))
            FROM `bigquery-public-data.geo_us_boundaries.counties`
            WHERE county_name IN ("Queens","Kings", "New York") AND state_fips_code = "36");

SELECT * FROM `PROJECT_NAME.places_insights___us.PLACES_COUNT_PER_GEO`(
  JSON_OBJECT(
      'geographies', geos,
      'types', ["restaurant"],
      'business_status', ["OPERATIONAL"]
      )
);
The response for the function:
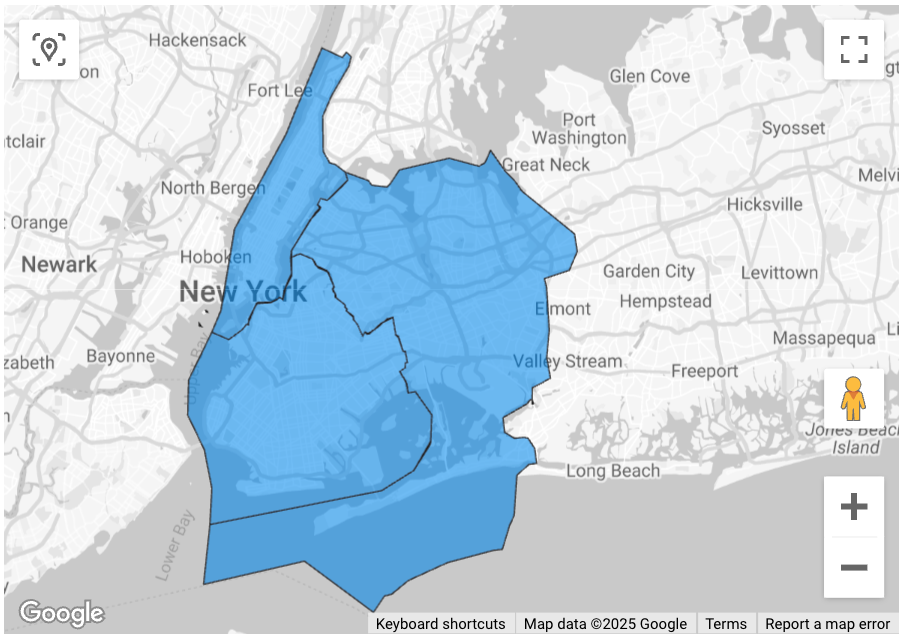
Visualize results
The following images show this data displayed in Looker Studio as a filled map, including the outline of each county:
To import your data into Looker Studio:
Run the function above to generate the results.
In the BigQuery results, click Open in -> Looker Studio. Your results are automatically imported into Looker Studio.
Looker Studio creates a default report page and initializes it with a title, table, and bar graph of the results.
Select everything on the page and delete it.
Click Insert -> Filled map to add a filled map to your report.
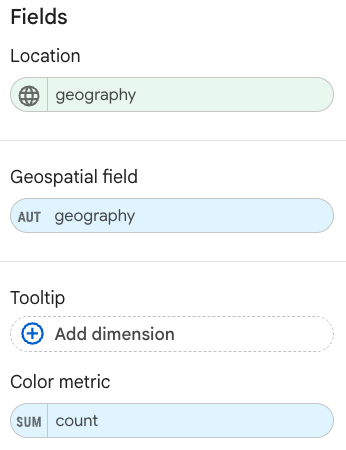
Under Chart types -> Setup configure the fields as shown below::
The filled map appears as above. You can optionally select Chart types -> Styles to further configure the appearance of the map.
For more information and example on visualizing Places Insights results, see Visualize query results.