Page Summary
-
Multiple datasets provide land surface temperature and emissivity data from various satellite sensors including ASTER, GCOM-C/SGLI, MODIS (Terra and Aqua), and Landsat (4, 5, 7, 8, and 9).
-
Land surface temperature products are available at different temporal resolutions, including daily, 8-day composites, monthly, and long-term averages, and may include daytime, nighttime, or day-night difference temperatures.
-
Some land surface temperature datasets, like those from the Malaria Atlas Project, are gap-filled to address missing data due to factors like cloud cover.
-
Several datasets provide both land surface temperature and emissivity, while some focus specifically on land surface temperature or emissivity.
-
The datasets originate from different organizations including NASA's JPL, JAXA, and USGS.
-
AG100: ASTER Global Emissivity Dataset 100-meter V003
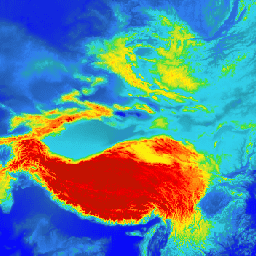
The Advanced Spaceborne Thermal Emission and Reflection Radiometer Global Emissivity Database (ASTER-GED) was developed by the National Aeronautics and Space Administration's (NASA) Jet Propulsion Laboratory (JPL), California Institute of Technology. This product includes the mean emissivity and standard deviation for all 5 ASTER Thermal Infrared … aster elevation emissivity geophysical infrared jpl -
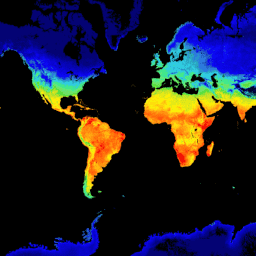
GCOM-C/SGLI L3 Land Surface Temperature (V1)

This product is the temperature of terrestrial land surface. A newer version JAXA/GCOM-C/L3/LAND/LST/V3 is also available for this dataset which uses this algorithm for processing. GCOM-C conducts long-term and continuous global observation and data collection to elucidate the mechanism behind fluctuations in radiation budget and … climate g-portal gcom gcom-c jaxa land -
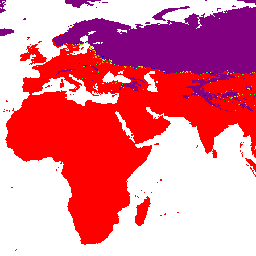
GCOM-C/SGLI L3 Land Surface Temperature (V2)
This product is the temperature of terrestrial land surface. For data after 2021-11-28, see the V3 dataset. GCOM-C conducts long-term and continuous global observation and data collection to elucidate the mechanism behind fluctuations in radiation budget and carbon cycle needed to make accurate projections regarding … climate g-portal gcom gcom-c jaxa land -
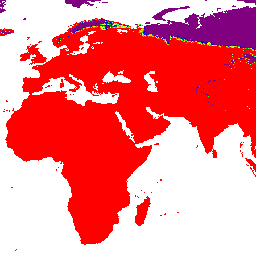
GCOM-C/SGLI L3 Land Surface Temperature (V3)

This product is the temperature of terrestrial land surface. This is an ongoing dataset with a latency of 3-4 days. GCOM-C conducts long-term and continuous global observation and data collection to elucidate the mechanism behind fluctuations in radiation budget and carbon cycle needed to make … climate g-portal gcom gcom-c jaxa land -
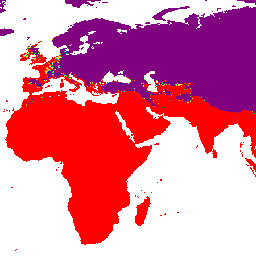
LST Day: Malaria Atlas Project Gap-Filled Daytime Land Surface Temperature (8-Daily 1km)
Daytime Land Surface Temperature (LST) are derived from the ~1km MODIS MOD11A2 v6.1 products. The 8-daily composites are converted to degrees Celsius and then gap-filled using the approach outlined in Weiss et al (2014) to eliminate missing data caused by factors such as cloud cover. … climate lst malariaatlasproject map publisher-dataset surface-temperature -
LST Day: Malaria Atlas Project Gap-Filled Daytime Land Surface Temperature (Annual 1km)

Daytime Land Surface Temperature (LST) are derived from the ~1km MODIS MOD11A2 v6.1 products. The 8-daily composites are converted to degrees Celsius and then gap-filled using the approach outlined in Weiss et al (2014) to eliminate missing data caused by factors such as cloud cover. … climate lst malariaatlasproject map publisher-dataset surface-temperature -
LST Day: Malaria Atlas Project Gap-Filled Daytime Land Surface Temperature (Monthly 1km)
Daytime Land Surface Temperature (LST) are derived from the ~1km MODIS MOD11A2 v6.1 products. The 8-daily composites are converted to degrees Celsius and then gap-filled using the approach outlined in Weiss et al (2014) to eliminate missing data caused by factors such as cloud cover. … climate lst malariaatlasproject map publisher-dataset surface-temperature -
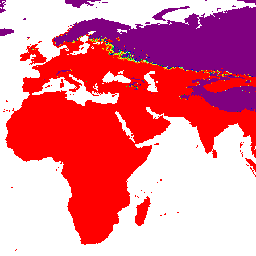
LST Night: Malaria Atlas Project Gap-Filled Nighttime Land Surface Temperature (8-Daily 1km)
Nighttime Land Surface Temperature (LST) are derived from the ~1km MODIS MOD11A2 v6.1 products. The 8-daily composites are converted to degrees Celsius and then gap-filled using the approach outlined in Weiss et al (2014) to eliminate missing data caused by factors such as cloud cover. … climate lst malariaatlasproject map publisher-dataset surface-temperature -
LST Night: Malaria Atlas Project Gap-Filled Nighttime Land Surface Temperature (Annual 1km)
Nighttime Land Surface Temperature (LST) are derived from the ~1km MODIS MOD11A2 v6.1 products. The 8-daily composites are converted to degrees Celsius and then gap-filled using the approach outlined in Weiss et al (2014) to eliminate missing data caused by factors such as cloud cover. … climate lst malariaatlasproject map publisher-dataset surface-temperature -
LST Night: Malaria Atlas Project Gap-Filled Nighttime Land Surface Temperature (Monthly 1km)

Nighttime Land Surface Temperature (LST) are derived from the ~1km MODIS MOD11A2 v6.1 products. The 8-daily composites are converted to degrees Celsius and then gap-filled using the approach outlined in Weiss et al (2014) to eliminate missing data caused by factors such as cloud cover. … climate lst malariaatlasproject map publisher-dataset surface-temperature -
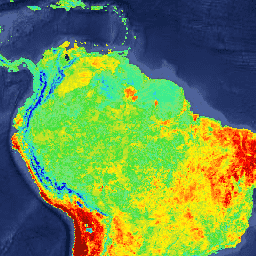
MOD11A1.061 Terra Land Surface Temperature and Emissivity Daily Global 1km

The MOD11A1 V6.1 product provides daily land surface temperature (LST) and emissivity values in a 1200 x 1200 kilometer grid. The temperature value is derived from the MOD11_L2 swath product. Above 30 degrees latitude, some pixels may have multiple observations where the criteria for clear-sky … climate daily emissivity global lst modis -
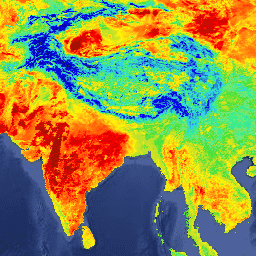
MOD11A2.061 Terra Land Surface Temperature and Emissivity 8-Day Global 1km
The MOD11A2 V6.1 product provides an average 8-day land surface temperature (LST) in a 1200 x 1200 kilometer grid. Each pixel value in MOD11A2 is a simple average of all the corresponding MOD11A1 LST pixels collected within that 8 day period. The MOD11A2 does a … 8-day climate emissivity global lst mod11a2 -
MOD21A1D.061 Terra Land Surface Temperature and 3-Band Emissivity Daily Global 1km

The MOD21A1D dataset is produced daily from daytime Level 2 Gridded (L2G) intermediate LST products at a spatial resolution of 1,000 meters. The L2G process maps the daily MOD21 swath granules onto a sinusoidal MODIS grid and stores all observations falling over a gridded cell … climate daily emissivity global lst nasa -
MOD21A1N.061 Terra Land Surface Temperature and 3-Band Emissivity Daily Global 1km

The MOD21A1N dataset is produced daily from nighttime Level 2 Gridded (L2G) intermediate LST products at a spatial resolution of 1,000 meters. The L2G process maps the daily MOD21 swath granules onto a sinusoidal MODIS grid and stores all observations falling over a gridded cell … climate daily emissivity global lst nasa -
MOD21C1.061 Terra Land Surface Temperature and 3-Band Emissivity Daily L3 Global 0.05 Deg CMG

The MOD21C1 dataset is produced daily in a 0.05 degree (5,600 meters at the equator) Climate Modeling Grid (CMG) from daytime Level 2 Gridded (L2G) intermediate LST products. The L2G process maps the daily MOD21 swath granules onto a sinusoidal MODIS grid and stores all … climate daily emissivity global lst nasa -
MOD21C2.061 Terra Land Surface Temperature and 3-Band Emissivity 8-Day L3 Global 0.05 Deg CMG

The MOD21C2 dataset is an 8-day composite LST product that uses an algorithm based on a simple averaging method. The algorithm calculates the average from all the cloud free MOD21A1D and MOD21A1N daily acquisitions from the 8-day period. Unlike the MOD21A1 data sets where the … climate emissivity global lst nasa surface-temperature -
MOD21C3.061 Terra Land Surface Temperature and 3-Band Emissivity Monthly L3 Global 0.05 Deg CMG
The MOD21C3 dataset is a monthly composite LST product that uses an algorithm based on a simple averaging method. The algorithm calculates the average from all the cloud free MOD21A1D and MOD21A1N daily acquisitions from the 8-day period. Unlike the MOD21A1 data sets where the … climate emissivity global lst monthly nasa -
MYD11A1.061 Aqua Land Surface Temperature and Emissivity Daily Global 1km

The MYD11A1 V6.1 product provides daily land surface temperature (LST) and emissivity values in a 1200 x 1200 kilometer grid. The temperature value is derived from the MYD11_L2 swath product. Above 30 degrees latitude, some pixels may have multiple observations where the criteria for clear-sky … aqua climate daily emissivity global lst -
MYD11A2.061 Aqua Land Surface Temperature and Emissivity 8-Day Global 1km

The MYD11A2 V6.1 product provides an average 8-day land surface temperature (LST) in a 1200 x 1200 kilometer grid. Each pixel value in MYD11A2 is a simple average of all the corresponding MYD11A1 LST pixels collected within that 8 day period. The MYD11A2 does a … 8-day aqua climate emissivity global lst -
MYD21A1D.061 Aqua Land Surface Temperature and 3-Band Emissivity Daily Global 1km

The MYD21A1D dataset is produced daily from daytime Level 2 Gridded (L2G) intermediate LST products at a spatial resolution of 1,000 meters. The L2G process maps the daily MOD21 swath granules onto a sinusoidal MODIS grid and stores all observations falling over a gridded cell … aqua climate daily emissivity global lst -
MYD21A1N.061 Aqua Land Surface Temperature and 3-Band Emissivity Daily Global 1km

The MYD21A1N dataset is produced daily from nighttime Level 2 Gridded (L2G) intermediate LST products at a spatial resolution of 1,000 meters. The L2G process maps the daily MOD21 swath granules onto a sinusoidal MODIS grid and stores all observations falling over a gridded cell … aqua climate daily emissivity global lst -
MYD21C1.061 Aqua Land Surface Temperature and 3-Band Emissivity Daily L3 Global 0.05 Deg CMG

The MYD21C1 dataset is produced daily in a 0.05 degree (5,600 meters at the equator) Climate Modeling Grid (CMG) from daytime Level 2 Gridded (L2G) intermediate LST products. The L2G process maps the daily MYD21 swath granules onto a sinusoidal MODIS grid and stores all … aqua climate daily emissivity global lst -
MYD21C2.061 Aqua Land Surface Temperature and 3-Band Emissivity 8-Day L3 Global 0.05 Deg CMG

The MYD21C2 dataset is an 8-day composite LST product that uses an algorithm based on a simple averaging method. The algorithm calculates the average from all the cloud free MYD21A1D and MYD21A1N daily acquisitions from the 8-day period. Unlike the MYD21A1 data sets where the … aqua climate emissivity global lst nasa -
MYD21C3.061 Aqua Land Surface Temperature and 3-Band Emissivity Monthly L3 Global 0.05 Deg CMG

The MYD21C3 dataset is a monthly composite LST product that uses an algorithm based on a simple averaging method. The algorithm calculates the average from all the cloud free MYD21A1D and MYD21A1N daily acquisitions from the 8-day period. Unlike the MYD21A1 data sets where the … aqua climate emissivity global lst monthly -
OpenLandMap Long-term Land Surface Temperature Daytime Monthly Median
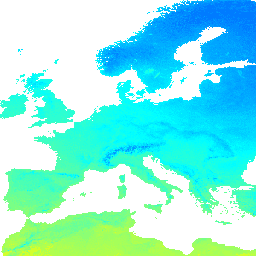
Land Surface Temperature daytime monthly mean value 2000-2017. Derived using the data.table package and quantile function in R. For more info about the MODIS LST product see this page. Antarctica is not included. To access and visualize maps outside of Earth Engine, use this page. … climate envirometrix lst mod11a2 modis monthly -
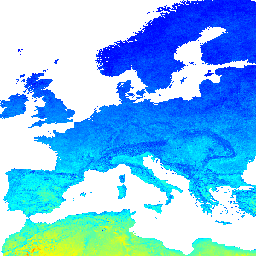
OpenLandMap Long-term Land Surface Temperature Daytime Monthly Standard Deviation
Long-term MODIS LST day-time and night-time temperatures standard deviation at 1 km based on the 2000-2017 time series. Derived using the data.table package and quantile function in R. For more info about the MODIS LST product see this page. Antarctica is not included. To access … climate envirometrix lst mod11a2 modis monthly -
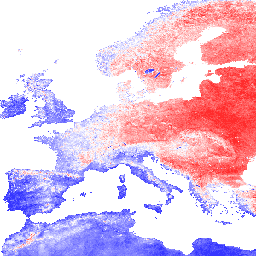
OpenLandMap Long-term Land Surface Temperature Monthly Day-Night Difference
Long-term MODIS LST day-time and night-time differences at 1 km based on the 2000-2017 time series Derived using the data.table package and quantile function in R. For more info about the MODIS LST product see this page. Antarctica is not included. To access and visualize … climate day envirometrix lst mod11a2 modis -
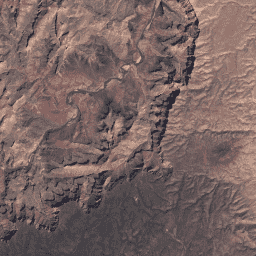
USGS Landsat 4 Level 2, Collection 2, Tier 1

This dataset contains atmospherically corrected surface reflectance and land surface temperature derived from the data produced by the Landsat TM sensor. These images contain 4 visible and near-infrared (VNIR) bands and 2 short-wave infrared (SWIR) bands processed to orthorectified surface reflectance, and one thermal infrared … cfmask cloud fmask global landsat lasrc -
USGS Landsat 4 Level 2, Collection 2, Tier 2

This dataset contains atmospherically corrected surface reflectance and land surface temperature derived from the data produced by the Landsat TM sensor. These images contain 4 visible and near-infrared (VNIR) bands and 2 short-wave infrared (SWIR) bands processed to orthorectified surface reflectance, and one thermal infrared … cfmask cloud fmask global landsat lasrc -
USGS Landsat 5 Level 2, Collection 2, Tier 1

This dataset contains atmospherically corrected surface reflectance and land surface temperature derived from the data produced by the Landsat TM sensor. These images contain 4 visible and near-infrared (VNIR) bands and 2 short-wave infrared (SWIR) bands processed to orthorectified surface reflectance, and one thermal infrared … cfmask cloud fmask global landsat lasrc -
USGS Landsat 5 Level 2, Collection 2, Tier 2

This dataset contains atmospherically corrected surface reflectance and land surface temperature derived from the data produced by the Landsat TM sensor. These images contain 4 visible and near-infrared (VNIR) bands and 2 short-wave infrared (SWIR) bands processed to orthorectified surface reflectance, and one thermal infrared … cfmask cloud fmask global landsat lasrc -
USGS Landsat 7 Level 2, Collection 2, Tier 1

This dataset contains atmospherically corrected surface reflectance and land surface temperature derived from the data produced by the Landsat 7 ETM+ sensor. These images contain 4 visible and near-infrared (VNIR) bands and 2 short-wave infrared (SWIR) bands processed to orthorectified surface reflectance, and one thermal … cfmask cloud etm fmask global landsat -
USGS Landsat 7 Level 2, Collection 2, Tier 2
This dataset contains atmospherically corrected surface reflectance and land surface temperature derived from the data produced by the Landsat 7 ETM+ sensor. These images contain 4 visible and near-infrared (VNIR) bands and 2 short-wave infrared (SWIR) bands processed to orthorectified surface reflectance, and one thermal … cfmask cloud etm fmask global landsat -
USGS Landsat 8 Level 2, Collection 2, Tier 1

This dataset contains atmospherically corrected surface reflectance and land surface temperature derived from the data produced by the Landsat 8 OLI/TIRS sensors. These images contain 5 visible and near-infrared (VNIR) bands and 2 short-wave infrared (SWIR) bands processed to orthorectified surface reflectance, and one thermal … cfmask cloud fmask global l8sr landsat -
USGS Landsat 8 Level 2, Collection 2, Tier 2

This dataset contains atmospherically corrected surface reflectance and land surface temperature derived from the data produced by the Landsat 8 OLI/TIRS sensors. These images contain 5 visible and near-infrared (VNIR) bands and 2 short-wave infrared (SWIR) bands processed to orthorectified surface reflectance, and one thermal … cfmask cloud fmask global l8sr landsat -
USGS Landsat 9 Level 2, Collection 2, Tier 1

This dataset contains atmospherically corrected surface reflectance and land surface temperature derived from the data produced by the Landsat 9 OLI/TIRS sensors. These images contain 5 visible and near-infrared (VNIR) bands and 2 short-wave infrared (SWIR) bands processed to orthorectified surface reflectance, and one thermal … cfmask cloud fmask global l9sr landsat -
USGS Landsat 9 Level 2, Collection 2, Tier 2

This dataset contains atmospherically corrected surface reflectance and land surface temperature derived from the data produced by the Landsat 9 OLI/TIRS sensors. These images contain 5 visible and near-infrared (VNIR) bands and 2 short-wave infrared (SWIR) bands processed to orthorectified surface reflectance, and one thermal … cfmask cloud fmask global l9sr landsat