Page Summary
-
Global accessibility maps for cities and healthcare are available, showing land-based travel times.
-
A global friction surface is provided, detailing land-based travel speed, including walking-only options.
-
A fractional landcover product, derived from MODIS data, indicates the percentage of different landcover types.
-
Accessibility to Cities 2015
This global accessibility map enumerates land-based travel time to the nearest densely-populated area for all areas between 85 degrees north and 60 degrees south for a nominal year 2015. Densely-populated areas are defined as contiguous areas with 1,500 or more inhabitants per square kilometer or … accessibility jrc map oxford population twente -
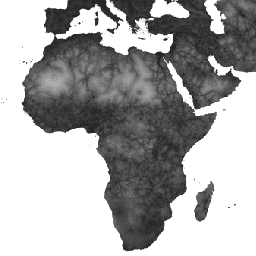
Accessibility to Healthcare 2019

This global accessibility map enumerates land-based travel time (in minutes) to the nearest hospital or clinic for all areas between 85 degrees north and 60 degrees south for a nominal year 2019. It also includes "walking-only" travel time, using non-motorized means of transportation only. Major … accessibility jrc map oxford population twente -
Global Friction Surface 2019
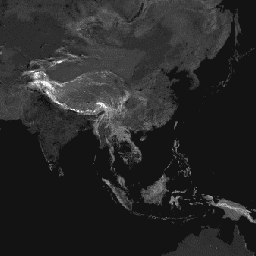
This global friction surface enumerates land-based travel speed for all land pixels between 85 degrees north and 60 degrees south for a nominal year 2019. It also includes "walking-only" travel speed, using non-motorized means of transportation only. This map was produced through a collaboration between … accessibility jrc map oxford population twente -
Oxford MAP: Malaria Atlas Project Fractional International Geosphere-Biosphere Programme Landcover
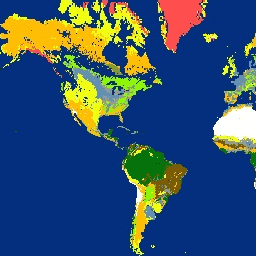
The underlying dataset for this landcover product is the IGBP layer found within the MODIS annual landcover product (MCD12Q1). This data was converted from its categorical format, which has a ≈500 meter resolution, to a fractional product indicating the integer percentage (0-100) of the output … landcover landuse-landcover map oxford