Page Summary
-
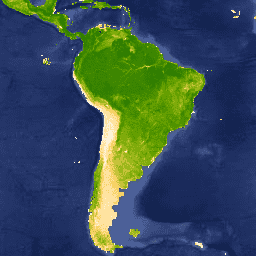
This dataset, which provides a monthly Enhanced Vegetation Index (EVI) at approximately 5km resolution, has been superseded by a newer version.
-
The EVI data is based on MODIS imagery and was gap-filled to address missing data issues.
-
The dataset includes bands for the mean EVI value and the proportion of raw data used in each pixel.
-
It is provided by the Oxford Malaria Atlas Project and is available under a CC-BY-NC-SA-4.0 license.
- Dataset Availability
- 2001-02-01T00:00:00Z–2015-06-01T00:00:00Z
- Dataset Producer
- Oxford Malaria Atlas Project
- Cadence
- 1 Month
- Tags
Description
The underlying dataset for this Enhanced Vegetation Index (EVI) product is MODIS BRDF-corrected imagery (MCD43B4), which was gap-filled using the approach outlined in Weiss et al. (2014) to eliminate missing data caused by factors such as cloud cover. Gap-free outputs were then aggregated temporally and spatially to produce the monthly ≈5km product.
This dataset was produced by Harry Gibson and Daniel Weiss of the Malaria Atlas Project (Big Data Institute, University of Oxford, United Kingdom, https://malariaatlas.org/).
Bands
Pixel Size
5000 meters
Bands
| Name | Units | Min | Max | Pixel Size | Description |
|---|---|---|---|---|---|
Mean |
0* | 1* | meters | The mean value of the Enhanced Vegetation Index for each aggregated pixel. |
|
FilledProportion |
% | 0* | 100* | meters | A quality control band that indicates the percentage of each resulting pixel that was comprised of raw data (as opposed to gap-filled estimates). |
Terms of Use
Terms of Use
Citations
Weiss, D.J., P.M. Atkinson, S. Bhatt, B. Mappin, S.I. Hay & P.W. Gething (2014) An effective approach for gap-filling continental scale remotely sensed time-series. ISPRS Journal of Photogrammetry and Remote Sensing, 98, 106-118.
Explore with Earth Engine
Code Editor (JavaScript)
var dataset = ee.ImageCollection('Oxford/MAP/EVI_5km_Monthly')
                  .filter(ee.Filter.date('2015-01-01', '2015-12-31'));
var evi = dataset.select('Mean');
var eviVis = {
  min: 0.0,
  max: 1.0,
  palette: [
    'ffffff', 'fcd163', '99b718', '66a000', '3e8601', '207401', '056201',
    '004c00', '011301'
  ],
};
Map.setCenter(-60.5, -20.0, 2);
Map.addLayer(evi, eviVis, 'EVI');