Page Summary
-
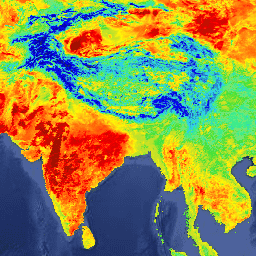
The MYD21C3 dataset is a monthly composite Land Surface Temperature (LST) product generated using a simple averaging method of cloud-free daily acquisitions.
-
The dataset is available from February 24, 2000, to September 1, 2025, with a monthly cadence.
-
Provided by the NASA LP DAAC at the USGS EROS Center, this dataset includes various bands for daytime and nighttime LST, quality control, view angles, view times, and emissivity, with a pixel size of 1000 meters.
-
MODIS data and products from LP DAAC have no restrictions on subsequent use, sale, or redistribution.
-
The dataset can be explored and analyzed using the Google Earth Engine platform.
- Dataset Availability
- 2000-02-24T00:00:00Z–2026-06-01T00:00:00Z
- Dataset Producer
- NASA LP DAAC at the USGS EROS Center
- Cadence
- 1 Month
- Tags
Description
The MYD21C3 dataset is a monthly composite LST product that uses an algorithm based on a simple averaging method. The algorithm calculates the average from all the cloud free MYD21A1D and MYD21A1N daily acquisitions from the 8-day period. Unlike the MYD21A1 data sets where the daytime and nighttime acquisitions are separate products, the MYD21A2 contains both daytime and nighttime acquisitions. The LST, Quality Control (QC), view zenith angle, and viewing time have separate day and night bands, while the values for the MODIS emissivity bands 29, 31, and 32 are the average of both the nighttime and daytime acquisitions.
Documentation:
Bands
Bands
Pixel size: 1000 meters (all bands)
| Name | Units | Min | Max | Scale | Offset | Pixel Size | Description | ||||||||||||||||||||||||||||||||||||||||||||||||||||||||||||||||||||||||||||||||||||||||||||
|---|---|---|---|---|---|---|---|---|---|---|---|---|---|---|---|---|---|---|---|---|---|---|---|---|---|---|---|---|---|---|---|---|---|---|---|---|---|---|---|---|---|---|---|---|---|---|---|---|---|---|---|---|---|---|---|---|---|---|---|---|---|---|---|---|---|---|---|---|---|---|---|---|---|---|---|---|---|---|---|---|---|---|---|---|---|---|---|---|---|---|---|---|---|---|---|---|---|---|---|
Count_Day |
1 | 65535 | 1000 meters | Count of Daytime Input Values |
|||||||||||||||||||||||||||||||||||||||||||||||||||||||||||||||||||||||||||||||||||||||||||||||
Count_Night |
1 | 65535 | 1000 meters | Count of Nighttime Input Values |
|||||||||||||||||||||||||||||||||||||||||||||||||||||||||||||||||||||||||||||||||||||||||||||||
QC_Day |
1000 meters | Quality Control for Daytime LST and Emissivity |
|||||||||||||||||||||||||||||||||||||||||||||||||||||||||||||||||||||||||||||||||||||||||||||||||
QC_Night |
1000 meters | Quality Control for Nighttime LST and Emissivity |
|||||||||||||||||||||||||||||||||||||||||||||||||||||||||||||||||||||||||||||||||||||||||||||||||
LST_Day |
K | 7500 | 65535 | 0.02 | 1000 meters | Average Daytime Land Surface Temperature |
|||||||||||||||||||||||||||||||||||||||||||||||||||||||||||||||||||||||||||||||||||||||||||||
LST_Night |
K | 7500 | 65535 | 0.02 | 1000 meters | Average Nighttime Land Surface Temperature |
|||||||||||||||||||||||||||||||||||||||||||||||||||||||||||||||||||||||||||||||||||||||||||||
LST_Day_err |
K | 1 | 255 | 0.04 | 1000 meters | Root-mean-square-error Daytime Land Surface Temperature |
|||||||||||||||||||||||||||||||||||||||||||||||||||||||||||||||||||||||||||||||||||||||||||||
LST_Night_err |
K | 1 | 255 | 0.04 | 1000 meters | Average Nighttime Land Surface Temperature |
|||||||||||||||||||||||||||||||||||||||||||||||||||||||||||||||||||||||||||||||||||||||||||||
Day_view_angle |
deg | 0 | 130 | -65 | 1000 meters | Average Daytime View Zenith Angle |
|||||||||||||||||||||||||||||||||||||||||||||||||||||||||||||||||||||||||||||||||||||||||||||
Night_view_angle |
deg | 0 | 130 | -65 | 1000 meters | Average Nighttime View Zenith Angle |
|||||||||||||||||||||||||||||||||||||||||||||||||||||||||||||||||||||||||||||||||||||||||||||
Day_view_time |
h | 0 | 120 | 0.2 | 1000 meters | Average Daytime View Time (UTC) |
|||||||||||||||||||||||||||||||||||||||||||||||||||||||||||||||||||||||||||||||||||||||||||||
Night_view_time |
h | 0 | 120 | 0.2 | 1000 meters | Average Nighttime View Time (UTC) |
|||||||||||||||||||||||||||||||||||||||||||||||||||||||||||||||||||||||||||||||||||||||||||||
Emis_29_Day |
1 | 255 | 0.002 | 0.49 | 1000 meters | Average Daytime Band 29 Emissivity |
|||||||||||||||||||||||||||||||||||||||||||||||||||||||||||||||||||||||||||||||||||||||||||||
Emis_29_Night |
1 | 255 | 0.002 | 0.49 | 1000 meters | Average Nighttime Band 29 Emissivity |
|||||||||||||||||||||||||||||||||||||||||||||||||||||||||||||||||||||||||||||||||||||||||||||
Emis_29_Day_err |
1 | 65535 | 0.0001 | 1000 meters | Root-mean-square-error Daytime Band 29 Emissivity |
||||||||||||||||||||||||||||||||||||||||||||||||||||||||||||||||||||||||||||||||||||||||||||||
Emis_29_Night_err |
1 | 65535 | 0.0001 | 1000 meters | Root-mean-square-error Nighttime Band 29 Emissivity |
||||||||||||||||||||||||||||||||||||||||||||||||||||||||||||||||||||||||||||||||||||||||||||||
Emis_31_Day |
1 | 255 | 0.002 | 0.49 | 1000 meters | Average Daytime Band 31 Emissivity |
|||||||||||||||||||||||||||||||||||||||||||||||||||||||||||||||||||||||||||||||||||||||||||||
Emis_31_Night |
1 | 255 | 0.002 | 0.49 | 1000 meters | Average Nighttime Band 31 Emissivity |
|||||||||||||||||||||||||||||||||||||||||||||||||||||||||||||||||||||||||||||||||||||||||||||
Emis_31_Day_err |
1 | 65535 | 0.0001 | 1000 meters | Root-mean-square-error Daytime Band 31 Emissivity |
||||||||||||||||||||||||||||||||||||||||||||||||||||||||||||||||||||||||||||||||||||||||||||||
Emis_31_Night_err |
1 | 65535 | 0.0001 | 1000 meters | Root-mean-square-error Nighttime Band 31 Emissivity |
||||||||||||||||||||||||||||||||||||||||||||||||||||||||||||||||||||||||||||||||||||||||||||||
Emis_32_Day |
1 | 255 | 0.002 | 0.49 | 1000 meters | Average Daytime Band 32 Emissivity |
|||||||||||||||||||||||||||||||||||||||||||||||||||||||||||||||||||||||||||||||||||||||||||||
Emis_32_Night |
1 | 255 | 0.002 | 0.49 | 1000 meters | Average Nighttime Band 32 Emissivity |
|||||||||||||||||||||||||||||||||||||||||||||||||||||||||||||||||||||||||||||||||||||||||||||
Emis_32_Day_err |
1 | 65535 | 0.0001 | 1000 meters | Root-mean-square-error Daytime Band 32 Emissivity |
||||||||||||||||||||||||||||||||||||||||||||||||||||||||||||||||||||||||||||||||||||||||||||||
Emis_32_Night_err |
1 | 65535 | 0.0001 | 1000 meters | Root-mean-square-error Nighttime Band 32 Emissivity |
||||||||||||||||||||||||||||||||||||||||||||||||||||||||||||||||||||||||||||||||||||||||||||||
View_Angle |
deg | -65 | 1000 meters | MODIS view zenith angle |
|||||||||||||||||||||||||||||||||||||||||||||||||||||||||||||||||||||||||||||||||||||||||||||||
Percent_land_in_grid |
% | 1 | 100 | 1000 meters | Percent of Land Detections in Grid Cell |
||||||||||||||||||||||||||||||||||||||||||||||||||||||||||||||||||||||||||||||||||||||||||||||
Clear_sky_days |
0 | 2.14748e+09 | 1000 meters | Bitmap of Clear Sky Days (1 = clear, LSB = 1st day) |
|||||||||||||||||||||||||||||||||||||||||||||||||||||||||||||||||||||||||||||||||||||||||||||||
Clear_sky_nights |
0 | 2.14748e+09 | 1000 meters | Bitmap of Clear Sky Nights (1 = clear, LSB = 1st day) |
|||||||||||||||||||||||||||||||||||||||||||||||||||||||||||||||||||||||||||||||||||||||||||||||
Terms of Use
Terms of Use
MODIS data and products acquired through the LP DAAC have no restrictions on subsequent use, sale, or redistribution.
Citations
Please visit LP DAAC 'Citing Our Data' page for information on citing LP DAAC datasets.
DOIs
Explore with Earth Engine
Code Editor (JavaScript)
var dataset = ee.ImageCollection('MODIS/061/MYD21C3')
                  .filter(ee.Filter.date('2018-01-01', '2018-05-01'));
var landSurfaceTemperature = dataset.select('LST_Day');
var landSurfaceTemperatureVis = {
  min: 216.0,
  max: 348.0,
  palette: [
    '040274', '040281', '0502a3', '0502b8', '0502ce', '0502e6',
    '0602ff', '235cb1', '307ef3', '269db1', '30c8e2', '32d3ef',
    '3be285', '3ff38f', '86e26f', '3ae237', 'b5e22e', 'd6e21f',
    'fff705', 'ffd611', 'ffb613', 'ff8b13', 'ff6e08', 'ff500d',
    'ff0000', 'de0101', 'c21301', 'a71001', '911003'
  ],
};
Map.setCenter(6.746, 46.529, 2);
Map.addLayer(
    landSurfaceTemperature, landSurfaceTemperatureVis,
    'Average Daytime Land Surface Temperature');