Men-debug aplikasi web Canvas Interaktif Anda dengan Chrome DevTools
Tetap teratur dengan koleksi
Simpan dan kategorikan konten berdasarkan preferensi Anda.
Anda dapat men-debug aplikasi web Canvas Interaktif menggunakan Chrome DevTools. Debugger Chrome
didukung di layar smart Google Home atau Google Nest dengan versi software
30 atau yang lebih baru (update ini mulai diluncurkan pada Oktober 2020)
dan firmware Cast versi 1.50 atau yang lebih baru. Anda dapat
memeriksa versi di bawah System settings / About device di layar smart.
Menyiapkan lingkungan Anda
Sebelum Anda dapat melakukan debug, lakukan hal berikut untuk menyiapkan lingkungan dengan benar:
Aktifkan Action Anda untuk pengujian di simulator konsol Action.
Hubungkan komputer ke jaringan area lokal yang sama dengan perangkat Google Home
atau Google Nest yang Anda uji.
Pastikan jaringan Anda tidak memblokir paket antar-perangkat.
Login dengan Akun Google yang sama di konsol Actions dan
di perangkat Google Home atau Google Nest.
Setelah lingkungan siap, Anda dapat meluncurkan Action di layar smart
pengujian Anda.
Menghubungkan aplikasi web Canvas ke debugger
Untuk menghubungkan aplikasi web Canvas ke debugger Chrome DevTools, ikuti
langkah-langkah berikut:
Di kolom alamat browser Chrome, masukkan chrome://inspect#devices
untuk meluncurkan pemeriksa Chrome. Anda akan melihat daftar perangkat di
halaman, dan URL HTML Canvas akan dicantumkan di bawah nama
perangkat Google Home atau Google Nest pengujian Anda. Perhatikan bahwa mungkin perlu waktu beberapa saat agar
Chrome menemukan semua perangkat di jaringan Anda.
Klik link inspect di bawah URL HTML untuk meluncurkan Chrome DevTools.
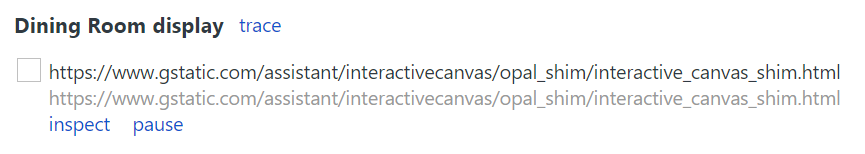
Chrome DevTools akan dimuat di jendelanya sendiri. Anda dapat mengklik tombol screencast
()
untuk melihat GUI web yang dirender di perangkat. Screenshot berikut menunjukkan
tampilan aplikasi web Anda di Chrome DevTools:
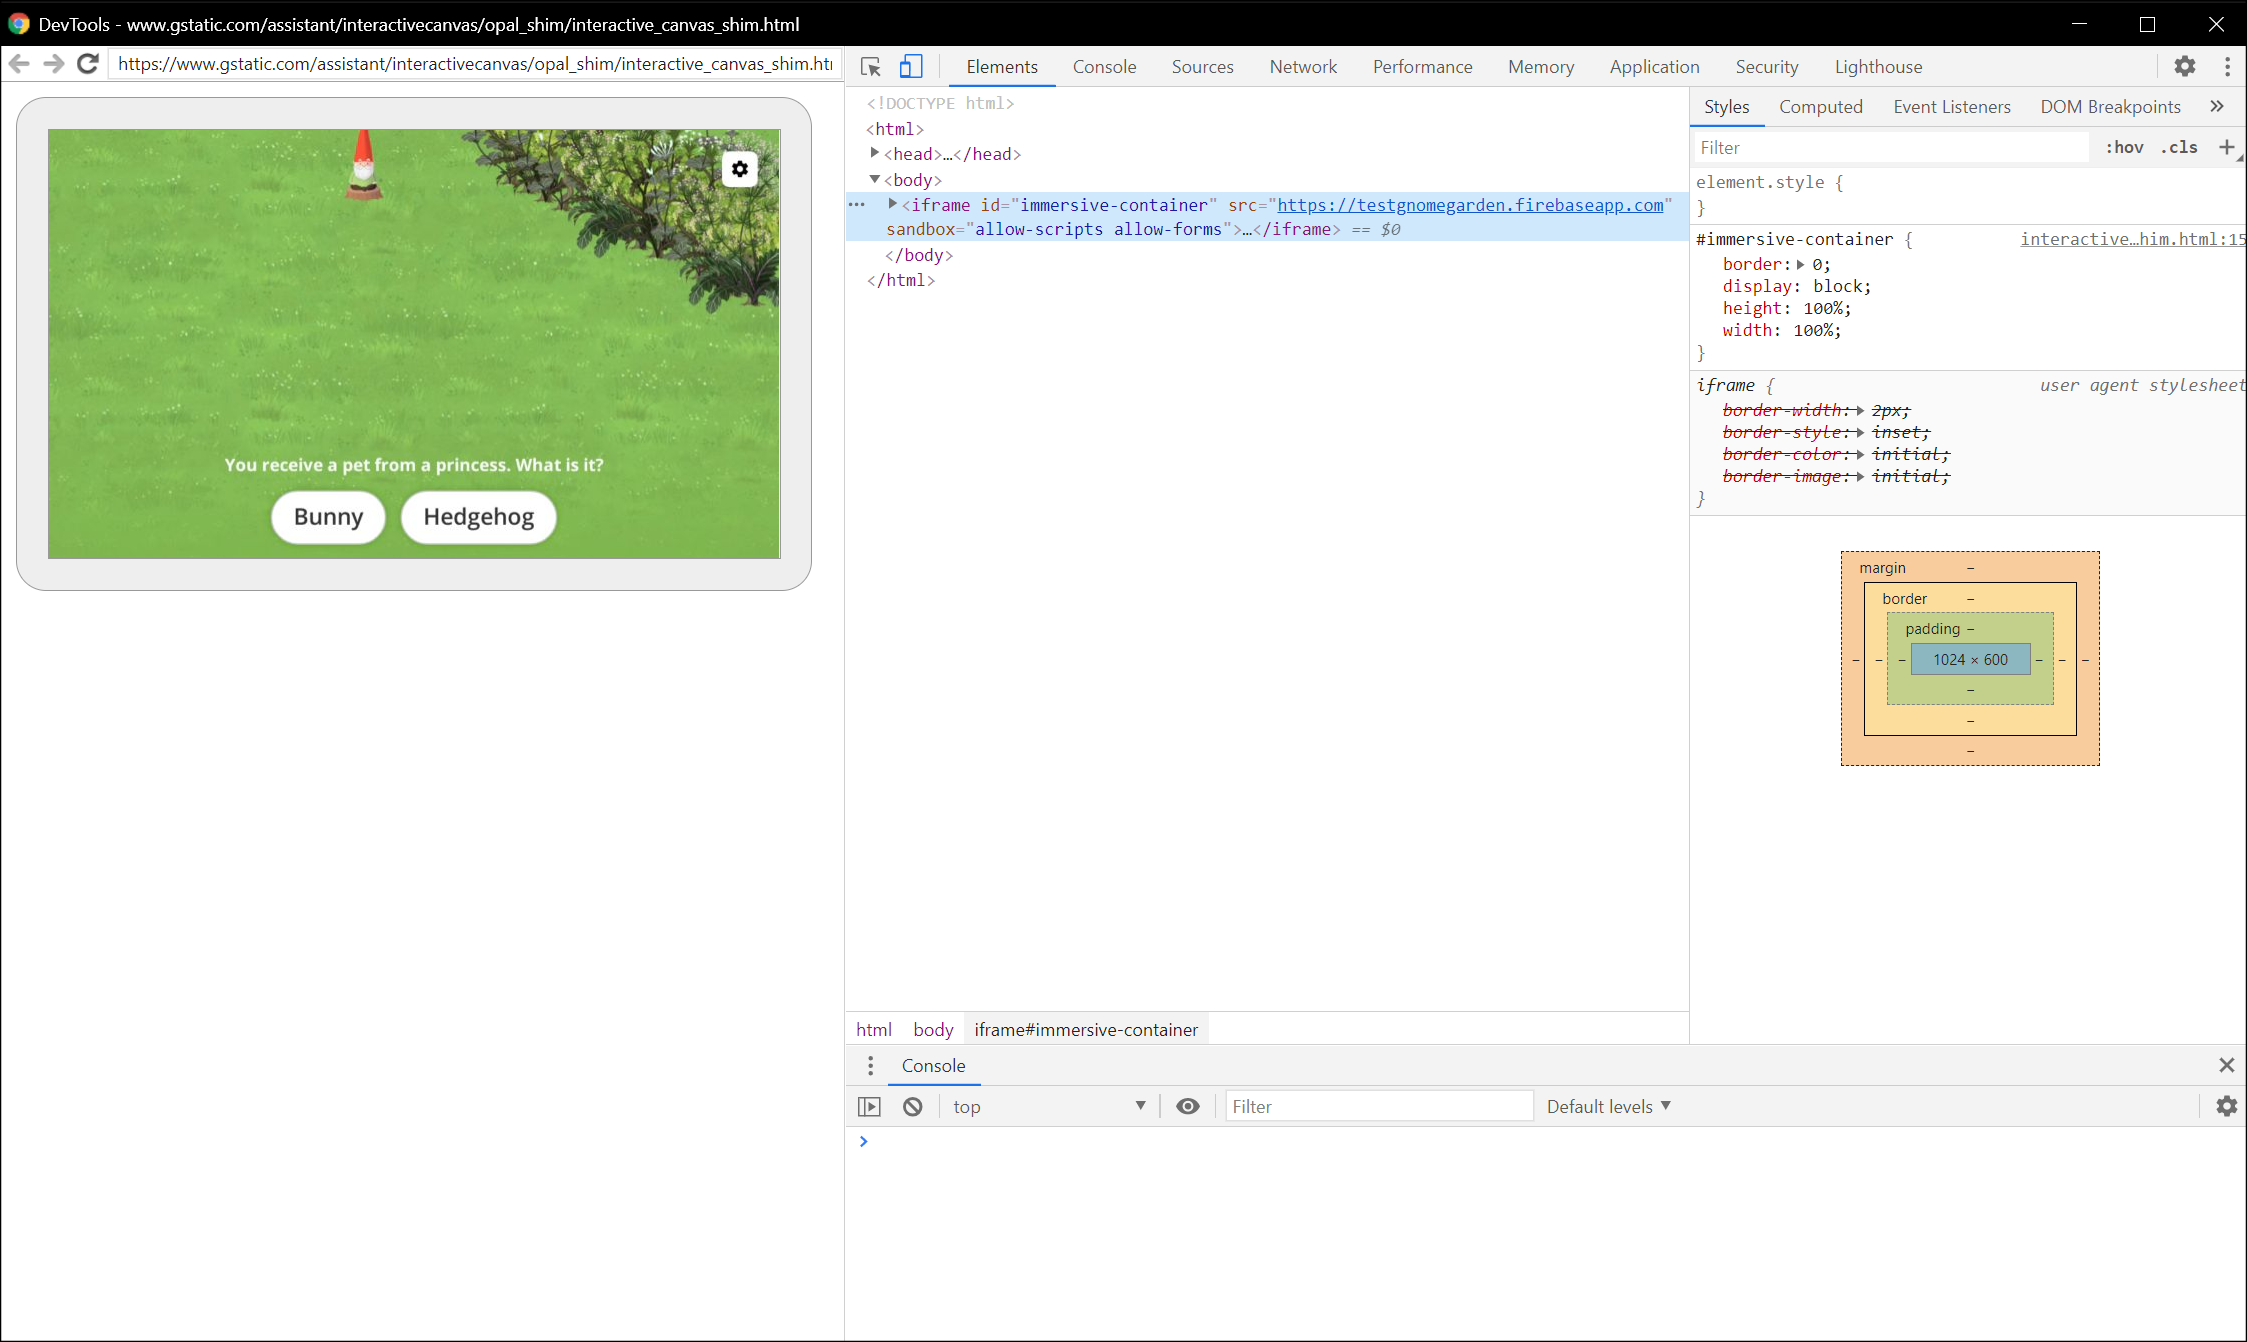
Perhatikan bahwa aplikasi web Canvas Anda dimuat dalam iframe.
Tips proses debug
Perhatikan tips tambahan berikut selama proses debug:
Muat ulang halaman di Chrome DevTools untuk memuat ulang container aplikasi
fulfillment lokal Anda dengan kode terbaru dari URL pengembangan Anda.
Pastikan aplikasi JavaScript Anda dimuat tanpa error. Untuk melakukannya, periksa
bagian konsol pada halaman DevTools.
Tambahkan titik henti sementara manual ke kode Anda menggunakan debugger; dalam
kode aplikasi web Anda.
Jika Anda tidak melihat perangkat di chrome://inspect#devices dalam jangka waktu yang lama, muat ulang halaman pemeriksaan.
Karena memori layar smart terbatas, aplikasi web Anda mungkin error atau hang
jika melebihi 200 MB. Untuk men-debug masalah memori, ikuti tutorial Memperbaiki Masalah Memori.
Jika ada error fulfillment, lihat permintaan yang dikirim oleh server Actions on Google
ke webhook dari log webhook Anda atau dari log Stackdriver.
[[["Mudah dipahami","easyToUnderstand","thumb-up"],["Memecahkan masalah saya","solvedMyProblem","thumb-up"],["Lainnya","otherUp","thumb-up"]],[["Informasi yang saya butuhkan tidak ada","missingTheInformationINeed","thumb-down"],["Terlalu rumit/langkahnya terlalu banyak","tooComplicatedTooManySteps","thumb-down"],["Sudah usang","outOfDate","thumb-down"],["Masalah terjemahan","translationIssue","thumb-down"],["Masalah kode / contoh","samplesCodeIssue","thumb-down"],["Lainnya","otherDown","thumb-down"]],["Terakhir diperbarui pada 2025-07-25 UTC."],[[["\u003cp\u003eDebug your Interactive Canvas web app using Chrome DevTools on Google Home or Nest smart displays running supported software and firmware versions.\u003c/p\u003e\n"],["\u003cp\u003eSet up your environment by enabling your Action for testing, connecting devices to the same network, ensuring network connectivity, and using the same Google account.\u003c/p\u003e\n"],["\u003cp\u003eConnect to the debugger by launching Chrome Inspector, locating your device and Canvas HTML URL, and clicking "inspect" to open DevTools.\u003c/p\u003e\n"],["\u003cp\u003eUtilize debugging tips such as refreshing the DevTools page, checking for JavaScript errors, adding breakpoints, and monitoring performance and memory usage.\u003c/p\u003e\n"],["\u003cp\u003eThird-party smart display devices are not supported for debugging Canvas web apps.\u003c/p\u003e\n"]]],[],null,["# Debug your Interactive Canvas web app with Chrome DevTools\n\nYou can debug your Interactive Canvas web app using [Chrome DevTools](https://developers.google.com/web/tools/chrome-devtools). The Chrome debugger\nis supported on Google Home or Google Nest smart displays with a software\nversion of 30 or later (this update starts rolling out in October 2020)\nand a Cast firmware version of 1.50 or later. You can\ncheck the versions under `System settings / About device` on your smart display.\n| **Note:** Debugging Canvas web apps on third-party smart display devices is not supported.\n\nSet up your environment\n-----------------------\n\nBefore you can debug, do the following to set up your environment correctly:\n\n- Enable your Action for testing in the Actions console [simulator](/assistant/conversational/build/projects#test_projects_in_the_simulator).\n- Connect your machine to the same local area network as the Google Home or Google Nest device you are testing.\n- Ensure that your network doesn't block packets between devices.\n- Log in with the same Google account on the Actions console and on the Google Home or Google Nest device.\n\nOnce your environment is ready, you can launch your Action on your test\nsmart display.\n| **Note:** You cannot debug your Canvas web app until you've launched your development Action on your test smart display.\n\nConnect Canvas web app to debugger\n----------------------------------\n\nTo connect your Canvas web app to the Chrome DevTools debugger, follow these\nsteps:\n\n1. In your local development machine, install and launch the [Google Chrome browser](https://www.google.com/chrome/).\n2. In the address field of your Chrome browser, enter `chrome://inspect#devices` to launch the Chrome inspector. You should see a list of devices on the page, and the Canvas HTML URL should be listed under the name of your test Google Home or Google Nest device. Note that it might take some time for Chrome to discover all the devices on your network.\n3. Click the `inspect` link under the HTML URL to launch Chrome DevTools.\n\nChrome DevTools loads in its own window. You can click the screencast\n()\nbutton to see the web GUI rendered on the device. The following screenshot shows\nhow your web app appears in Chrome DevTools:\n\nNote that your Canvas web app is loaded in an iframe.\n\nDebugging tips\n--------------\n\nKeep the following additional tips in mind during debugging:\n\n- Refresh the page in Chrome DevTools to reload your local fulfillment app container with the latest code from your development URL.\n- Check that your JavaScript app loads without errors. To do this, check the console section of the DevTools page.\n- Add manual breakpoints to your code by using `debugger;` within your web app code.\n- If you don't see your device in the `chrome://inspect#devices` for an extended period of time, refresh the inspect page.\n- To debug any performance issues, follow the [Get Started with Analyzing Runtime Performance tutorial](https://developers.google.com/web/tools/chrome-devtools/evaluate-performance).\n- Because the smart display memory is limited, your web app might crash or hang if it goes over 200MB. To debug any memory issues, follow the [Fix Memory Problems tutorial](https://developers.google.com/web/tools/chrome-devtools/memory-problems).\n- For any fulfillment errors, look at requests sent by Actions on Google servers to the webhook from your webhook logs or from Stackdriver logs."]]