This section covers the key metrics of Meridian - Return on Investment (ROI), marginal ROI (mROI) and response curves.
Quick Takeaways
Incremental Outcome, return on Investment (ROI), marginal ROI (mROI), and response curves are the tools that turn your model's findings into actionable business strategy. They help you answer the most critical marketing questions: "How well did my channels perform?" and "Where should I spend my next dollar?"
By understanding these metrics, you can identify your most efficient channels, understand current saturation levels, and optimize your budget to maximize your business outcomes. Response curves, in particular, provide a powerful visualization of how the incremental outcome responds to more spending, which is the foundation of data-driven budget allocation.
Marketing Example
Imagine you run an online shoe store. You spend \$10,000 on a video media channel. After running your Meridian model, you find that the channel caused \$25,000 in incremental sales.
- Incremental Outcome is the value your marketing caused. For example, your total sales were \$150,000, but Meridian estimates that without the campaign, sales would have been \$125,000. The Incremental Outcome is the difference: \$25,000.
- Your ROI is \$2.50 (\$25,000 sales / \$10,000 cost), meaning you earned \$2.50 for every dollar spent. (See Considerations for interpreting ROI and response curves for more details on how this is calculated).
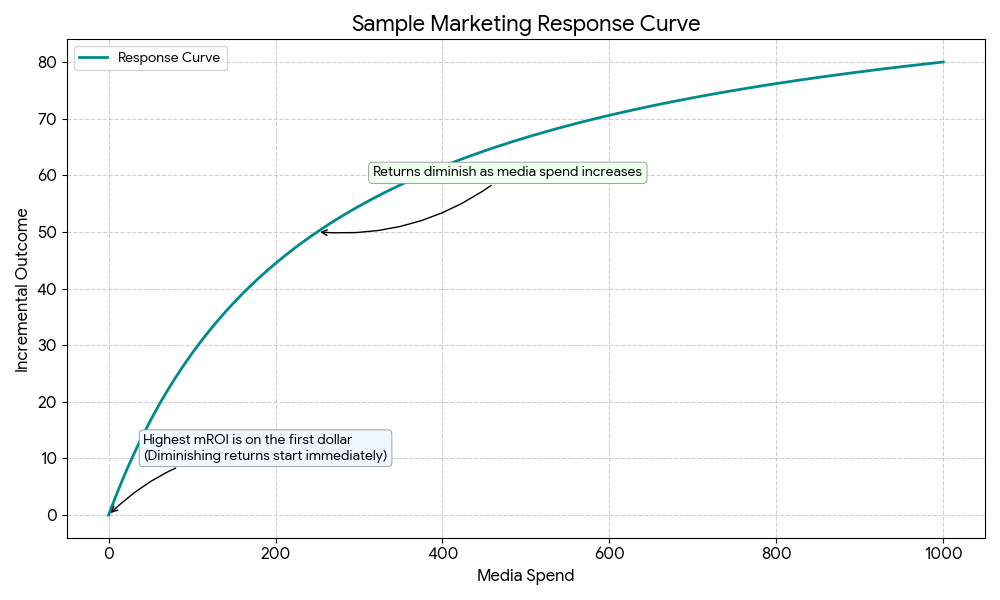
- The response curve shows you how your sales would change at different spend levels. It shows that spending even more money yields progressively smaller returns.
- Your mROI is the return you'd get from some small increase in spend (for example, the next dollar). If your channel is nearing saturation, the mROI might be only \$0.80, signaling it's time to invest elsewhere.
Rule-of-Thumb Recommendation
- Use ROI to evaluate historical performance: It gives you a clear, overall grade for how effective your past spending was on a given channel.
- Use response curves to optimize future budgets: They visualize the point of diminishing returns, helping you understand how much you can invest in a channel before it becomes inefficient.
- Use mROI to evaluate saturation level: If the mROI is much lower compared to the ROI, then the channel is beginning to saturate at historical spend level. Channels with the highest mROI are the best for investing additional funds.
Comparison Table
| Metric | Best For | Definition |
|---|---|---|
| ROI | Evaluating past performance. | A historical, channel-wide average. |
| Response Curves | Optimizing future spend and visualizing diminishing returns. | Incremental outcome as a function of spend. |
| mROI | Understanding current saturation level. | The return on the next dollar spent. |
Code Examples
Refer to Example - ROI, mROI & Response Curves in Meridian for working code examples.
Detailed Explanation
This section provides a deeper dive into the definitions and methodologies behind ROI, mROI, and response curves.
Incremental Outcome Explained
The foundation for ROI, mROI, and response curves is incremental outcome. This is the portion of your outcome, such as sales or conversions, that was caused by a specific marketing activity. Meridian calculates this by comparing the actual outcome to a counterfactual scenario where the marketing activity never happened. For paid media, the incremental outcome can be further contextualized by its spend in the following ways:
- The response curve estimates the incremental outcome at any given spend level.
- ROI is the incremental outcome at your historical spend level divided by the spend.
- mROI is the incremental outcome on your next dollar spent above the historical budget level.
How Response Curves Are Generated
A response curve visualizes the relationship between spend and incremental outcome for a single channel, assuming all other channels' spending remains the same.
Meridian generates this curve at different spending levels for a channel. It scales the channel's historical spend up or down by a factor (for example, from 1.2x the historical spend) and estimates the incremental outcome at each level. The historical distribution of spending over time and geography (the flighting pattern) is preserved during this scaling. This process reveals the point at which a channel becomes saturated and further investment yields diminishing returns.
Considerations for interpreting ROI and response curves
- Lagged effects: The ROI definition uses a channel's total cost over a specific period as the denominator. The numerator is the incremental outcome accrued during that same period. This numerator includes lagged effects from ads that ran before the period but excludes future effects from ads that ran during the period. Over a long time window (for example, one year), this has a minor effect on the ROI estimate. However, for shorter periods, the effect can be more meaningful.
- Extrapolation risk: Calculating the incremental outcome requires the model to estimate what would have happened if spend was zero. If you have always spent consistently on a channel, the model has little data for this zero-spend scenario and must extrapolate based on its learned assumptions. Extrapolation risk also affects incremental outcome estimation for points on the response curve that are greater than historical spend, and the risk increases the further out you go.
Mathematical Appendix
This section contains the mathematical underpinnings behind ROI, mROI and response curves.
Incremental outcome
For a given treatment variable \(q\), the incremental outcome is defined as:
\[\text{IncrementalOutcome}_q = \text{IncrementalOutcome} \left(\Bigl\{ x_{g,t,i}^{[M]} \Bigr\}, \Bigl\{ x_{g,t,i}^{[M](0,q)} \Bigr\} \right)\]
Where:
- The function $\text{IncrementalOutcome}()$ is defined here and is a more generic function that represents the incremental outcome between any two media counterfactual scenarios (not necessarily the incremental outcome of one isolated treatment variable).
- \(\left\{ x_{g,t,i}^{[M]} \right\}\) are the observed treatment values
- \(\left\{ x_{g,t,i}^{[M] (0,q)} \right\}\) denotes the observed treatment
values for all treatments except treatment \(q\), which is set to its
baseline value \(b_q\) everywhere. More specifically:
- \(x_{g,t,q}^{[M] (0,q)}=b_q\ \forall\ g,t\)
- \(x_{g,t,i}^{[M](0,q)}=x_{g,t,i}^{[M]}\ \forall\ g,t,i \neq q\)
For paid and organic media, the baseline values \(b_q\) are zero. For non-media treatment variables, the baseline value can be set to the observed minimum value of the variable (default), the maximum, or a user-provided float.
ROI
The ROI of channel \(q\) is defined as:
\[\text{ROI}_q = \dfrac{\text{IncrementalOutcome}_q}{\text{Cost}_q}\]
Where \(\text{Cost}_q= \sum\limits _{g,t} \overset \sim x^{[M]}_{g,t,q}\)
Note that the ROI denominator represents media cost over a specified time period that aligns with the time period over which the incremental outcome is defined. As a result, the incremental outcome in the numerator includes the lagged effect of media executed prior to this time window, and similarly excludes the future effect of media executed during this time window. So, the incremental outcome in the numerator does not perfectly align with the cost in the denominator. However, this misalignment will be less material over a reasonably long time window.
Note that the counterfactual media scenario (\(\left\{ x_{g,t,i}^{[M](0,q)} \right\}\)) may not actually be represented in the data. When this happens, extrapolation based on model assumptions is necessary to infer the counterfactual.
Response curves
Generalizing the incremental outcome definition, the response curve is defined for channel \(q\) as a function which returns the incremental outcome as a function of the spend on channel \(q\):
\[\text{IncrementalOutcome}_q (\omega \cdot \text{Cost}_q) = \text{IncrementalOutcome} \left(\left\{ x^{[M](\omega,q)}_{g,t,i} \right\}, \left\{ x^{[M](0,q)}_{g,t,i} \right\}\right)\]
Where \(\left\{ x^{[M](\omega,q)}_{g,t,i} \right\}\) denotes the observed media values for all channels except channel \(q\), which is multiplied by a factor of \(\omega\) everywhere. More specifically:
- \(x^{[M](\omega,q)}_{g,t,q}=\omega \cdot x^{[M]}_{g,t,q}\ \forall\ g,t\)
- \(x^{[M](\omega,q)}_{g,t,i}=x^{[M]}_{g,t,i} \forall\ g,t,i \neq q\)
Marginal ROI (mROI)
The marginal ROI (mROI) of channel \(q\) is defined as:
Where \(\delta\) is a small quantity, such as \(0.01\).
Note that the response curve and marginal ROI definitions implicitly assumes a constant cost per media unit that equals the historical average cost per media unit.