The PLACES_COUNT_CHANGE function calculates changes in Places of Interest
counts and retrieves sample added and removed Place IDs between two specific
months across multiple input geographies.
Like PLACES_COUNT_V2, this function is designed for efficient batch processing
by accepting an input table parameter of geographies, allowing you to evaluate
growth trends and commercial shifts across many locations simultaneously.
Syntax
SELECT *
FROM
  `PROJECT_NAME.LINKED_DATASET_NAME.PLACES_COUNT_CHANGE`(
    TABLE input_geographies,
    filters
  );
Parameters
PROJECT_NAME: The name of your Google Cloud project.LINKED_DATASET_NAME: The name of the BigQuery dataset containing the Places Insights functions (e.g.,places_insights___us).input_geographies: A BigQuery table containing the geographies to analyze. This table must include the following columns:filters(JSON): A JSON object containing key-value pairs for filtering the places. See Filter Parameters. It must include the following filters:
Output table schema
The PLACES_COUNT_CHANGE function returns a table with columns:
| Column name | Data type | Description |
|---|---|---|
geo_id |
STRING | The ID from the input geography. |
start_count |
INT64 | The count of places from the first month. |
end_count |
INT64 | The count of places from the second month. |
net_change |
INT64 | The difference between end_count and start_count (end_count - start_count). |
percentage_change |
FLOAT64 | The percentage change from month1 to month2. |
compound_monthly_growth_rate |
FLOAT64 | The compound monthly growth rate from month1 to month2. |
added_count |
INT64 | The number of sample place IDs in sample_added_place_ids. |
removed_count |
INT64 | The number of sample place IDs in sample_removed_place_ids. |
sample_added_place_ids |
ARRAY<STRING> | A list of sample place IDs present in month2 but not month1. |
sample_removed_place_ids |
ARRAY<STRING> | A list of sample place IDs present in month1 but not month2. |
The results are sorted by percentage_change and start_count descending.
How it works
The function processes each row in the input_geographies table. For each geo
object, it counts the number of places that fall within the geography (or within
the geography_radius if the geo is a point and the radius is specified in
the filters) in the two months specified in month1 and month2 in the
filters. Using those places, it calculates other useful statistics such as
percentage change and compound monthly growth rate from the first to second
month.
The count includes only those places that match all the conditions defined in
the filters JSON object.
Example: Calculate changes in POI counts between two months
This example demonstrates how to query the changes in POI counts between two
specific months using the month1 and month2 parameters, with a radius of
5000 from a given geolocation point.
WITH my_locations AS (
  SELECT
    'loc_1' AS geo_id,
    ST_GEOGFROMTEXT('POINT(-122.4194 37.7749)') AS geo
  -- Add more target locations as needed...
)

SELECT *
FROM `PROJECT_NAME.places_insights___us.PLACES_COUNT_CHANGE`(
  TABLE my_locations,
  JSON_OBJECT(
    'geography_radius', 5000,
    'month1', '2026-01', -- Baseline snapshot month (YYYY-MM)
    'month2', '2026-02'  -- Comparison snapshot month (YYYY-MM)
  )
);
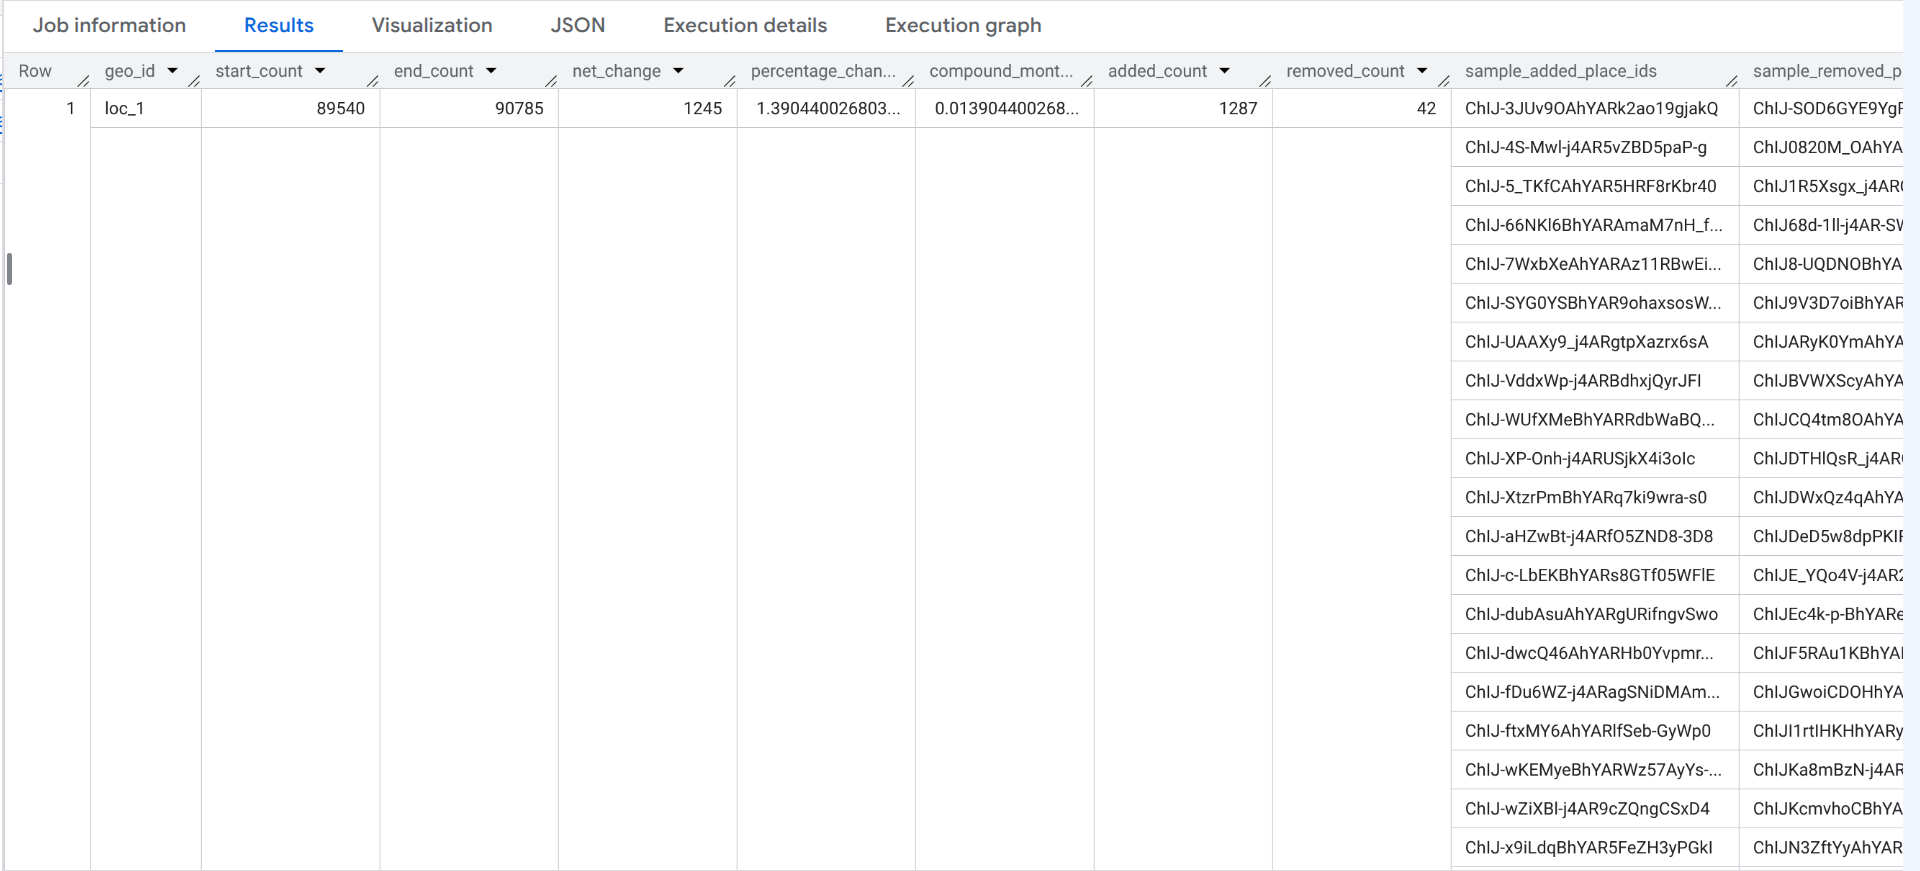
Analyzing the output
The query returns a table with a row for each input geography.
- Growth metrics: The output displays the baseline count (
start_count: 89,560) and comparison count (end_count: 90,923), yielding anet_changeof +1,363 places (+1.52%percentage_change). - Ground-truth inspection: The
sample_added_place_idsarray lists specific Place IDs that became active inmonth2(February 2026), whilesample_removed_place_idslists Place IDs no longer present. - Bridge to Places API: You can pass these sample Place IDs directly to the Place Details API (New) to look up store names, addresses, and attributes for newly opened or closed businesses.