Page Summary
-
The GHSL project offers several global raster datasets related to human settlements and populations.
-
Datasets include information on the degree of urbanization from 1975-2030, global building height for 2018, and global building volume from 1975-2030.
-
The collection also provides global built-up surface data at both 10m (2018) and 100m (1975-2030) resolutions.
-
Global population surfaces from 1975-2030 and detailed global settlement characteristics for 2018 are available.
-
GHSL: Degree of Urbanization 1975-2030 V2-0 (P2023A)

This raster dataset represents a global, multitemporal rural-urban classification, applying the "Degree of Urbanisation" stage I methodology recommended by UN Statistical Commission, based on global gridded population and built-up surface data generated by the GHSL project for the epochs 1975-2030 in 5-year intervals. The Degree … ghsl jrc population sdg settlement -
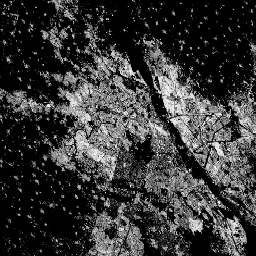
GHSL: Global building height 2018 (P2023A)
This spatial raster dataset depicts the global distribution of building heights at a resolution of 100 m, referred to the year 2018. The input data used to predict building heights are the ALOS Global Digital Surface Model (30 m), the NASA Shuttle Radar Topographic Mission … alos building built built-environment builtup copernicus -
GHSL: Global building volume 1975-2030 (P2023A)
This raster dataset depicts the global distribution of building volume, expressed in cubic metres per 100 m grid cell. The dataset measures the total building volume and the building volume allocated to grid cells of predominant non-residential (NRES) use. Estimates are based on the built-up … alos building built-environment copernicus dem ghsl -
GHSL: Global built-up surface 10m (P2023A)
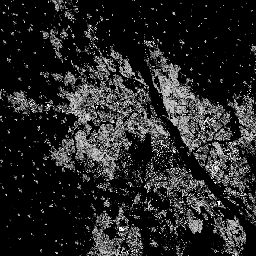
This raster dataset depicts the distribution of built-up surfaces, expressed in square metres per 10 m grid cell, for 2018 as observed from the S2 image data. The datasets measure: a) the total built-up surface, and b) the built-up surface allocated to grid cells of … built built-environment builtup copernicus ghsl jrc -
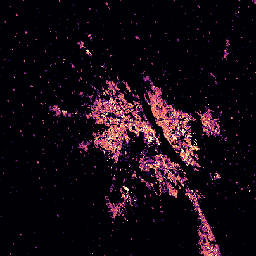
GHSL: Global built-up surface 1975-2030 (P2023A)
This raster dataset depicts the distribution of built-up surfaces, expressed in square metres per 100 m grid cell. The dataset measures: a) the total built-up surface, and b) the built-up surface allocated to grid cells of predominant non-residential (NRES) use. Data are spatially-temporally interpolated or … built built-environment builtup copernicus ghsl jrc -
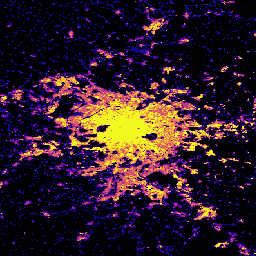
GHSL: Global population surfaces 1975-2030 (P2023A)
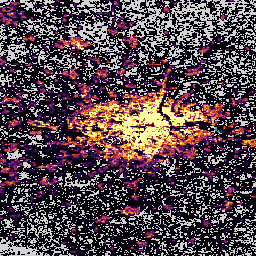
This raster dataset depicts the spatial distribution of residential population, expressed as the absolute number of inhabitants of the cell. Residential population estimates between 1975 and 2020 in 5-year intervals and projections to 2025 and 2030 derived from CIESIN GPWv4.11 were disaggregated from census or … ghsl jrc population sdg -
GHSL: Global settlement characteristics (10 m) 2018 (P2023A)
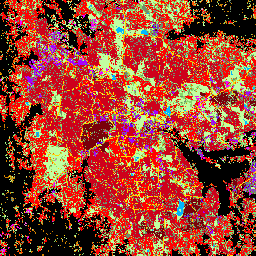
This spatial raster dataset delineates human settlements at 10 m resolution, and describes their inner characteristics in terms of the functional and height-related components of the built environment. More information about the GHSL data products can be found in the GHSL Data Package 2023 report … building built builtup copernicus ghsl height