
Time-based regression (TBR) is a statistical methodology used by Meridian GeoX for measuring the causal impact of marketing interventions. The framework is designed to provide reliable incremental conversion measurements by using historical geographic data to predict future counterfactual outcomes.
Core framework and execution
The TBR process is divided into two operational phases that train predictive models before an experiment begins:
- Pretest period: During this phase, a linear model is trained using historical conversion time series data from aggregated treatment and control geos before any marketing intervention occurs.
- Test period: After the experiment or marketing intervention begins, the model is used to predict the counterfactual—what the treatment group's conversion would've been in the absence of the intervention.
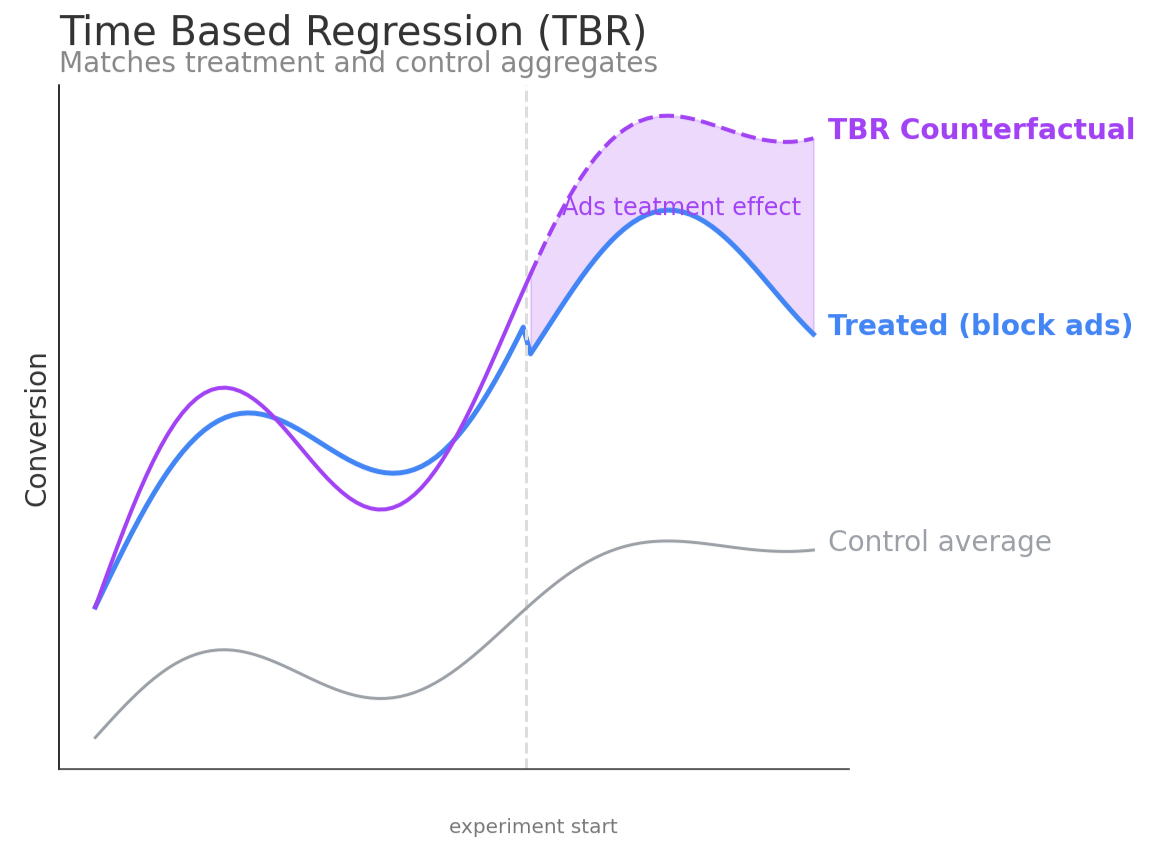
The incremental effect is estimated on each test day by subtracting the predicted counterfactual from the observed conversion. The total incremental effect is then calculated by summing these daily incremental effects over all test days.
Mathematical formulation
TBR models the relationship between the treatment group and the control group during the pre-experiment period. This relationship is then used to predict the treatment group's counterfactual baseline—what would have happened without the intervention during the experiment.
To ensure numerical stability and support multi-geo cells, the model is fitted on the average KPI of the treatment and control groups, and the final estimated effect is scaled back to the total.
Group aggregation
GeoX computes the average KPI time series for treatment and control groups using the following equations:
- Treatment group average KPI at time \(t\): \(\bar{Y}_{treat, t} = \frac{1}{|G_T|} \sum_{g \in G_T} Y_{g, t}\)
- Control group average KPI at time \(t\): \(\bar{Y}_{control, t} = \frac{1}{|G_C|} \sum_{g \in G_C} Y_{g, t}\)
In the equations:
- \(G_T\) is the set of treatment geos.
- \(G_C\) is the set of control geos.
- \(Y_{g, t}\) is the observed KPI for geo \(g\) at time \(t\), such as conversions or sales.
Pre-experiment model fitting
During the pre-experiment period (\(t \in T_{pre}\)), GeoX establishes a baseline linear relationship between the treatment and control averages:
In the equation:
- \(\alpha\) is the intercept, capturing the baseline difference in average volume between the treatment and control groups.
- \(\beta\) is the regression coefficient, capturing the structural correlation between the two groups. To ensure physical plausibility, GeoX uses a non-negativity constraint: \(\beta \ge 0\).
- \(\epsilon_t\) represents the residual error term. No distributional assumptions are made on \(\epsilon_t\), and uncertainty is quantified using non-parametric placebo-based inference.
The model is fitted using ordinary least squares (OLS) over the pre-experiment training data to estimate \(\hat{\alpha}\) and \(\hat{\beta}\).
Counterfactual prediction
During the experiment period (\(t \in T_{test}\)), the treatment group receives the marketing intervention while the control group remains business-as-usual. GeoX predicts the average counterfactual baseline—what the treatment group would've produced on average if no intervention occurred—using the equation:
Incremental conversion estimation
The daily incremental conversion or average pointwise lift \(\bar{\delta}_t\) at time \(t\) during the experiment period is computed as:
To find the total cumulative incremental conversion up to the day \(k\) of the experiment, GeoX sums the daily average effects and scale by the number of treatment geos \(|G_T|\):
Experiment type adjustment
Depending on the experiment design, the direction of the effect is adjusted:
- Heavy-up and holdback: The incremental conversion is \(\Delta_k\).
- Go-dark: The intervention is a spend shutdown, so the expected effect is negative. The incremental conversion is negated to represent the positive value of the advertising that was turned off: