
Page Summary
-
Google Maps Platform provides various reports including Usage, Quota, Billing, and Engagement reports to monitor API usage, cost, and user engagement.
-
Reports are accessible via the Google Cloud Console, including the APIs & Services Dashboard and Google Maps Platform APIs & Services pages.
-
API usage is tracked through requests, with quota limits to prevent overages, and billing reports detailing costs based on usage.
-
Business Insights is an experimental feature providing anonymized data on user interactions, like map views and POI interactions, for understanding user engagement.
-
Key concepts include credentials, response codes, and the
solution_channelparameter, which are essential for understanding report data and customizing tracking.
Reporting in the Google Maps Platform provides a set of predefined visual reports of basic API usage, quota, and billing information in the Google Cloud console. Use these reports to determine the number of API calls you've made, how close you are to hitting API usage quotas, and monitor your billing usage over time.
The types of reports include:
- Usage reports: Reports the number of requests your project makes to the Google Maps Platform APIs using credentials associated with your project.
- Quota reports: Reports quota usage in graphs that can be grouped in requests per minute. The current quota limits for selected APIs are displayed in tables below the quota usage graphs.
- Billing reports: Reports costs over time as a stacked line chart. View the current month's quota usage, inclusive of any usage-specific credits applied, as well as the total forecasted cost for the entire current month.
For a complete list of the response statuses and response codes that define whether a request appears in the Usage, Quota, and Billing reports, see Response status and reports.
View the reports of Google Maps Platform usage, quota, and billing using the Cloud console.
Usage reports
Usage is based on the number of requests your project makes to the Google Maps Platform APIs using the credentials associated with your project. Requests include successful requests, requests that result in server errors, and requests that result in client errors. Credentials include API keys and client IDs (for Premium Plan and migrated Premium Plan projects). For details, see the Premium Plan Overview and information on using a client ID.
Usage metrics are displayed in tables (Requests, Errors, and Latency) and graphs (Traffic, Errors, and Latency). For tracking purposes:
All APIs: You can filter and group usage metrics for all APIs in these ways:
- Filter by time period and API.
- See traffic, error, and latency grouped by response code, API, and credential.
A specific API: You can filter and group usage metrics for a specific API in these ways:
- Filter by time period, API versions, credentials, and methods.
- See traffic, error and latency grouped by response code, API method and version, and credential.
APIs & Services Dashboard page
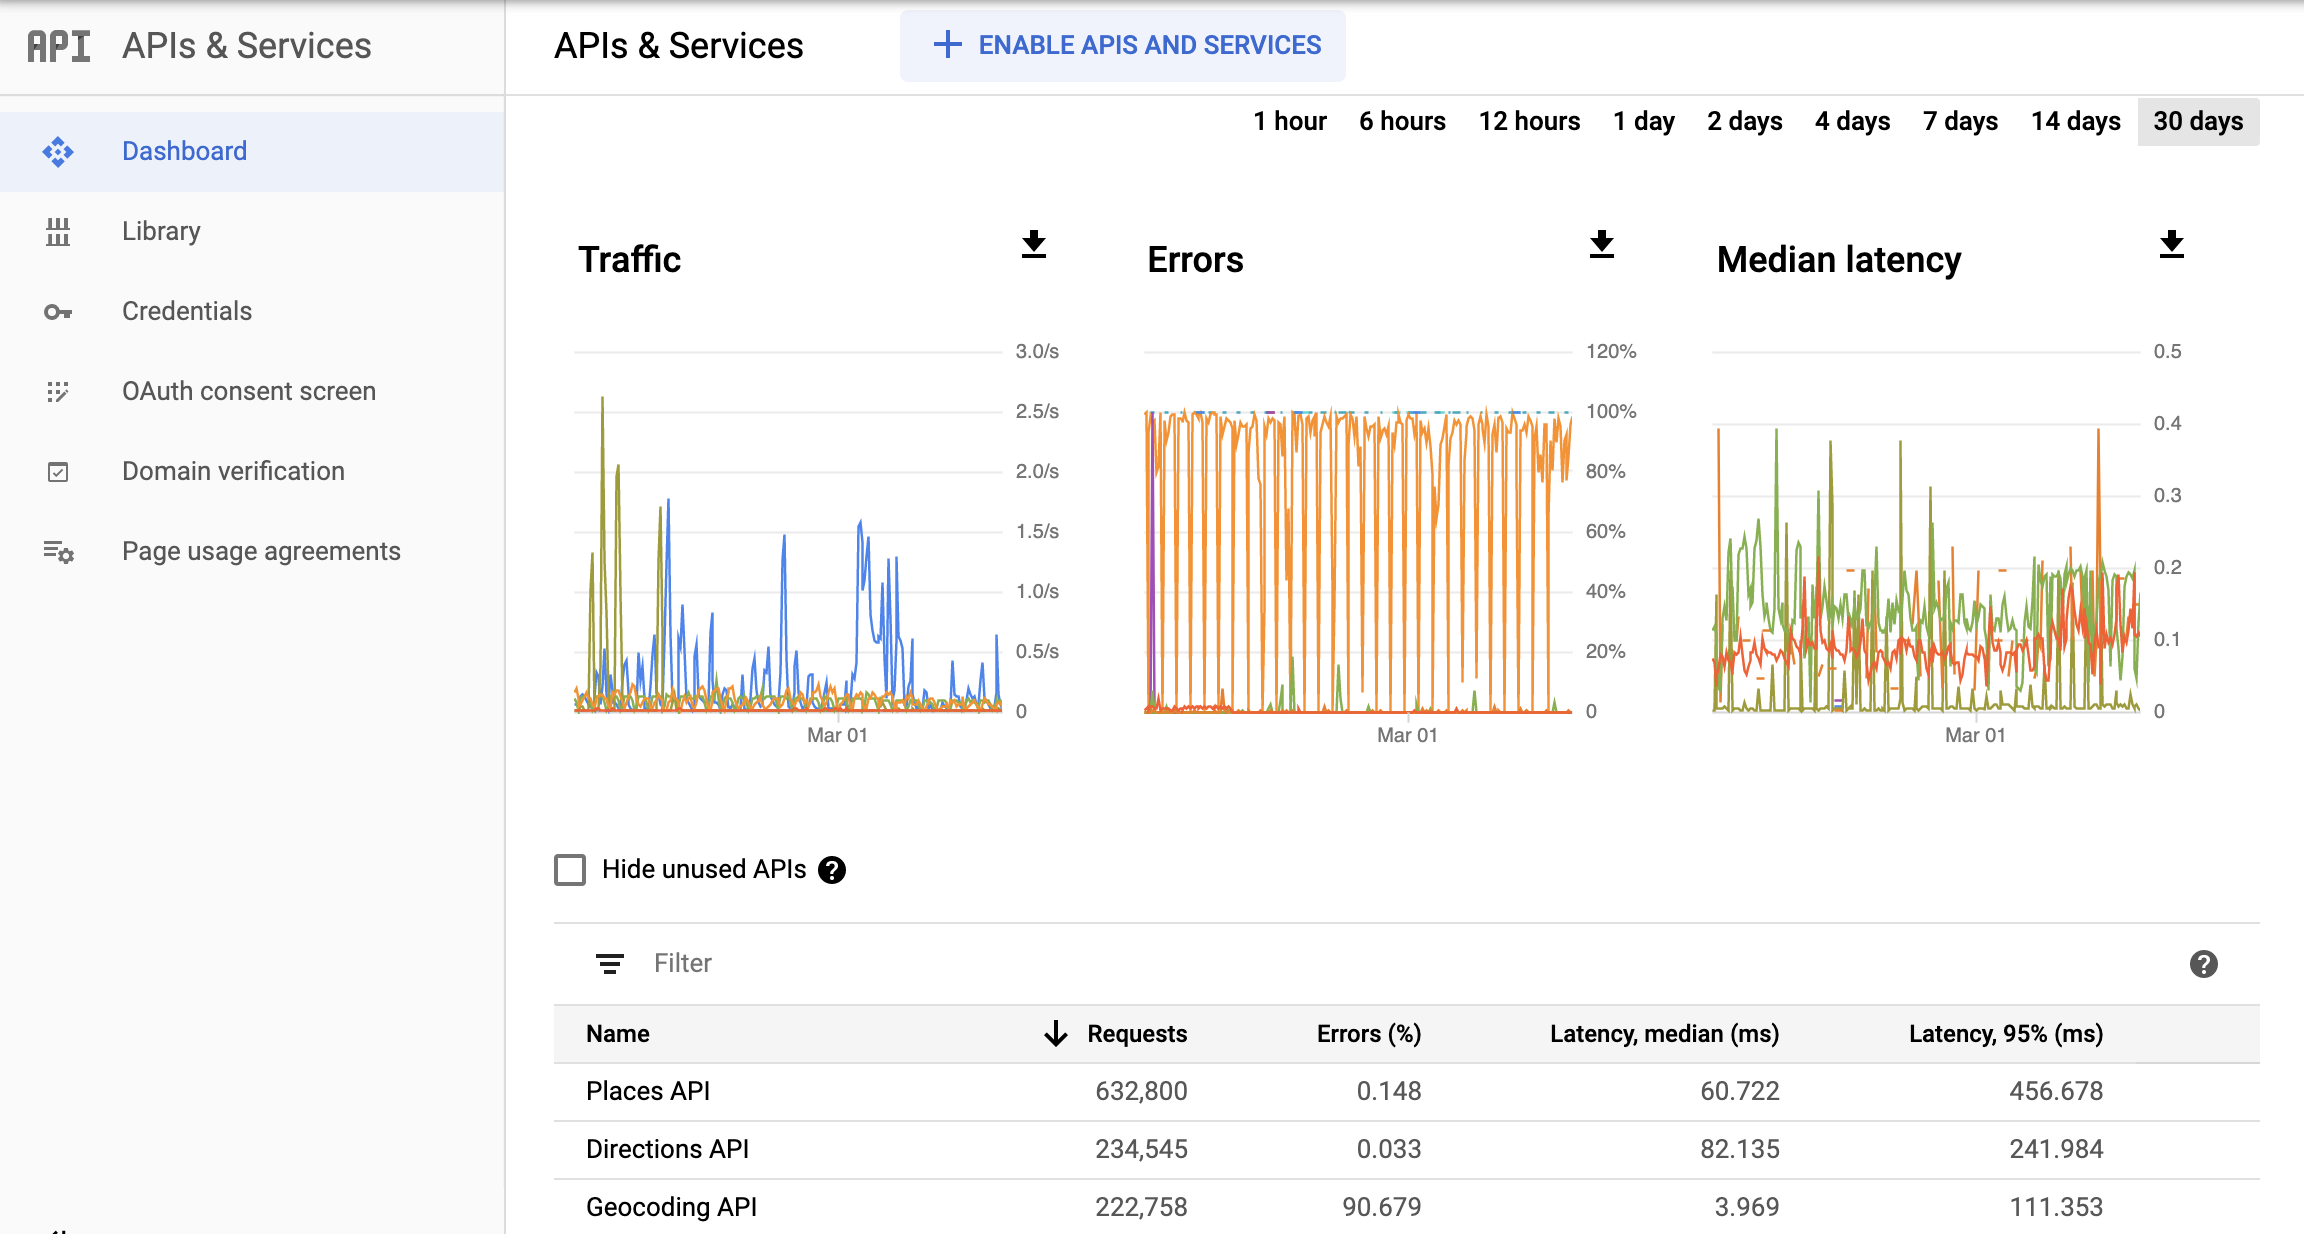
The APIs & Services Dashboard provides an overview of the usage metrics for all APIs enabled for your project: the Google Maps Platform APIs as well as other APIs and services.
The Dashboard page features three graphs and a table. You can filter the usage displayed in the graphs and tables by selecting a time period from 1 hour up to the last 30 days.
The Traffic graph shows usage in queries per minute (QPM) per API.
The Errors graph shows percentage of the requests that resulted in errors per API.
The Latency graph shows the median latency of the requests per API.
Beneath the graphs, a table lists the enabled APIs and services. Requests are the number of requests (for the selected time period). Errors are the number of these requests that resulted in errors. Latency (medium latency and percentile) is the latency for these requests.
To access the APIs & Services Dashboard page:
- Open the Project selector page in the Cloud console:
- Select your project. The APIs & Services Dashboard page appears.
If the page does not appear, select the menu button and then select APIs & Services.
For more information, see Monitoring your API Usage.
Google Maps Overview page
The Google Maps Overview page includes a table listing enabled APIs and usage requests for the last 30 days. Requests by API are also shown in graph form. A billing graph shows your current bill and total usage for the last 3 months.
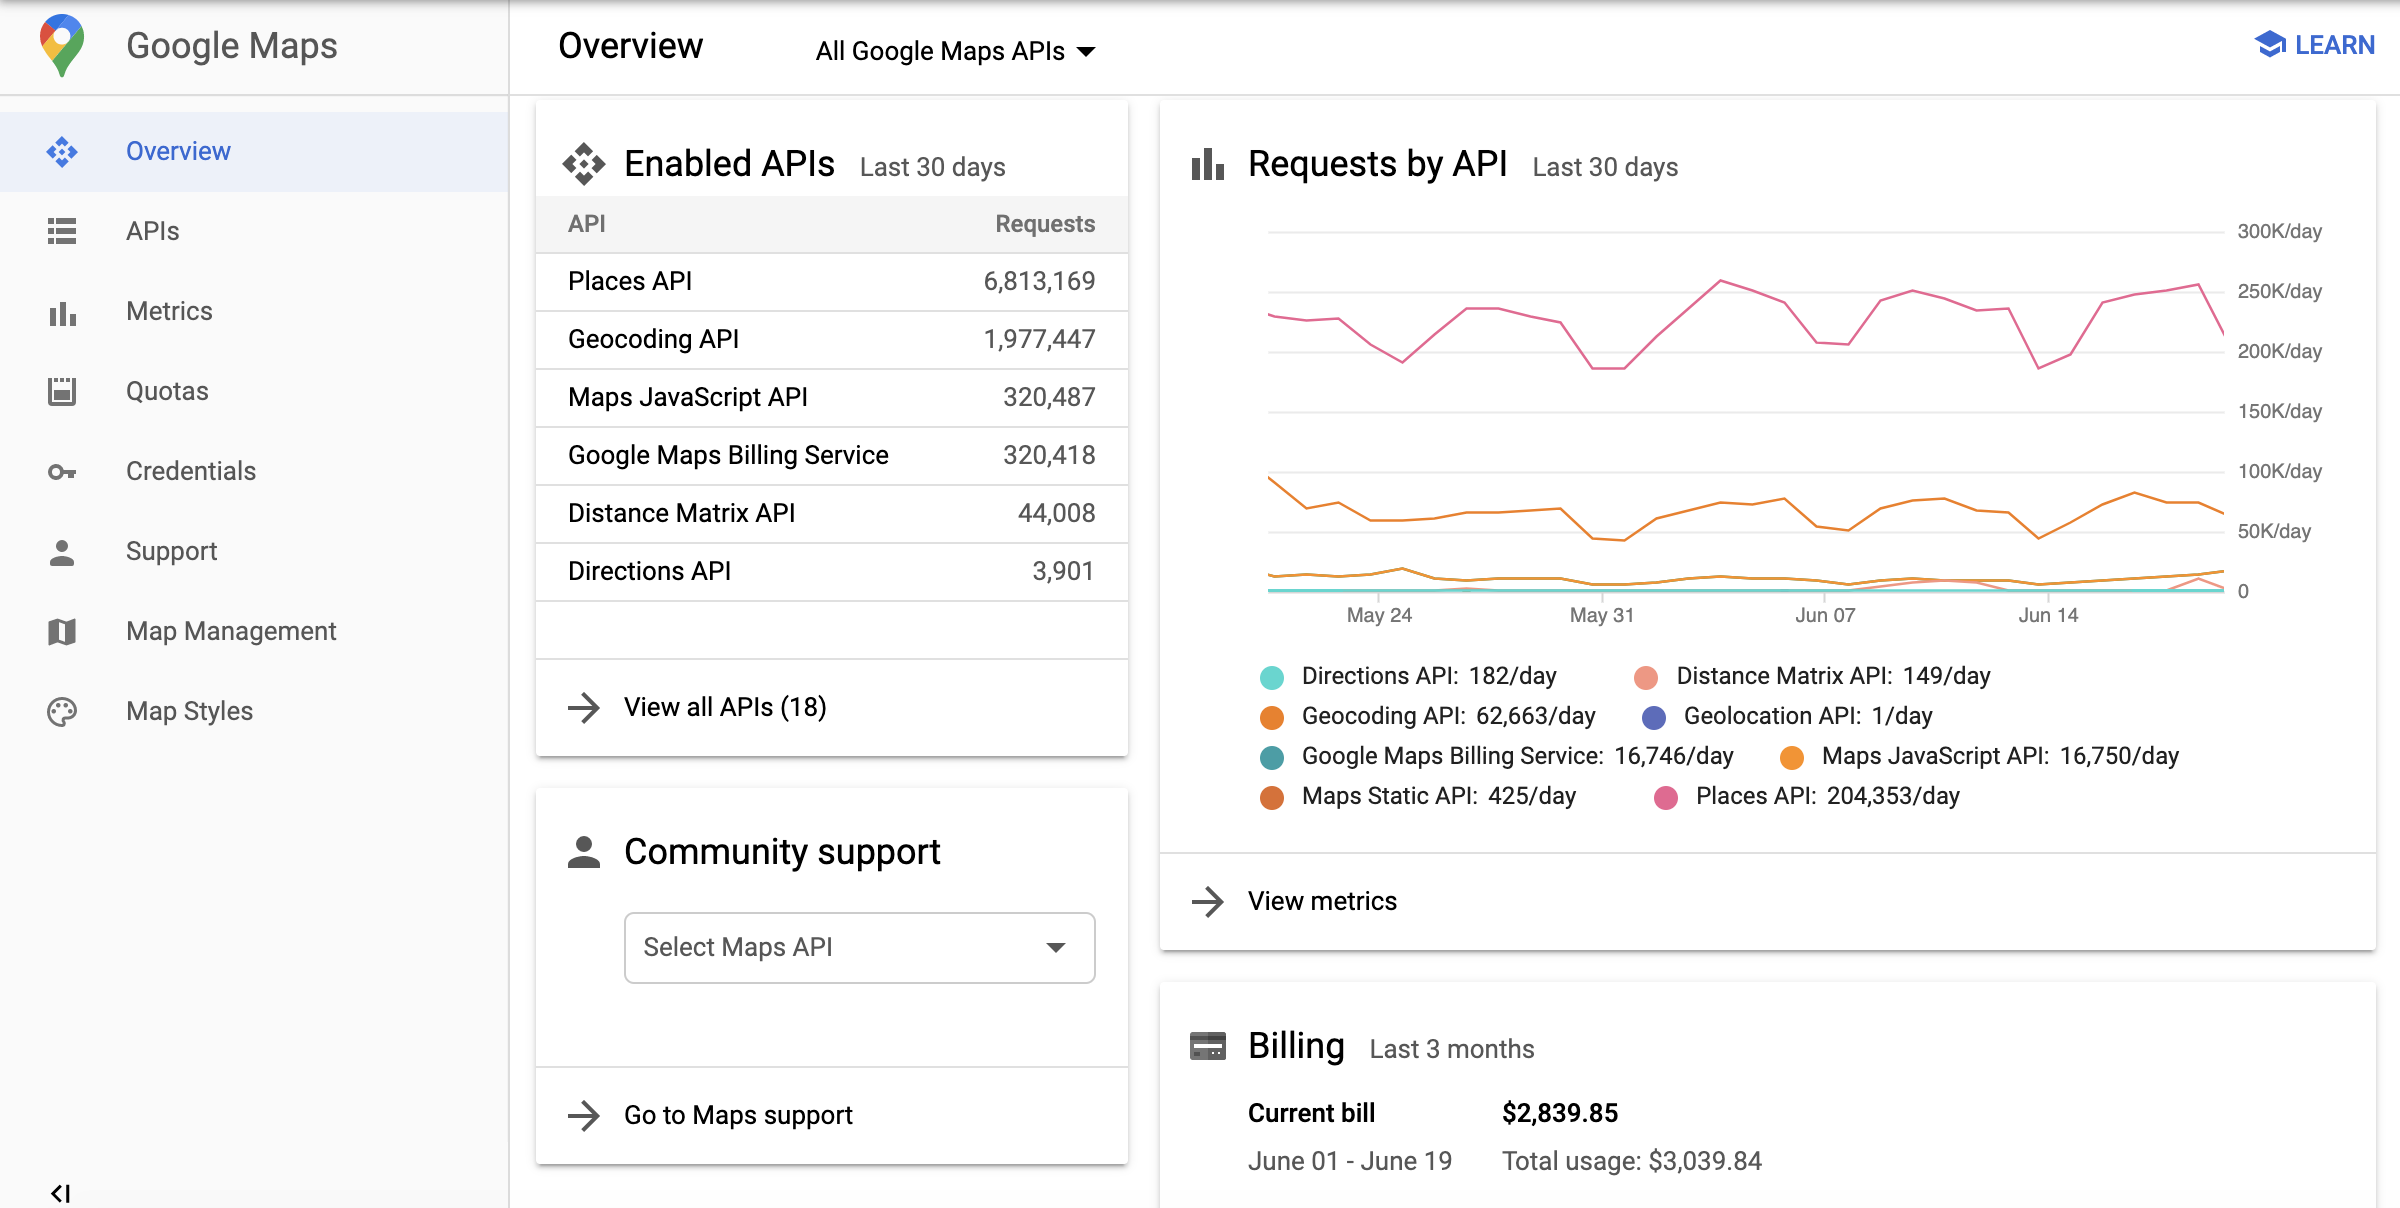
To access Google Maps Platform Overview page:
- Open the Google Maps Platform page in the Cloud console:
- In the left menu, select Overview.
Google Maps Platform APIs & Services page
The Google Maps APIs & Services page contains a grid of tiles representing the APIs, SDKs, and other services available to your project. Within each tile, you can enable or disable that service by selecting Enable or Disable, and you can access credentials information, metrics, and user guides for enabled APIs. You can also use the page filters to view enabled or disabled services and other service categories.
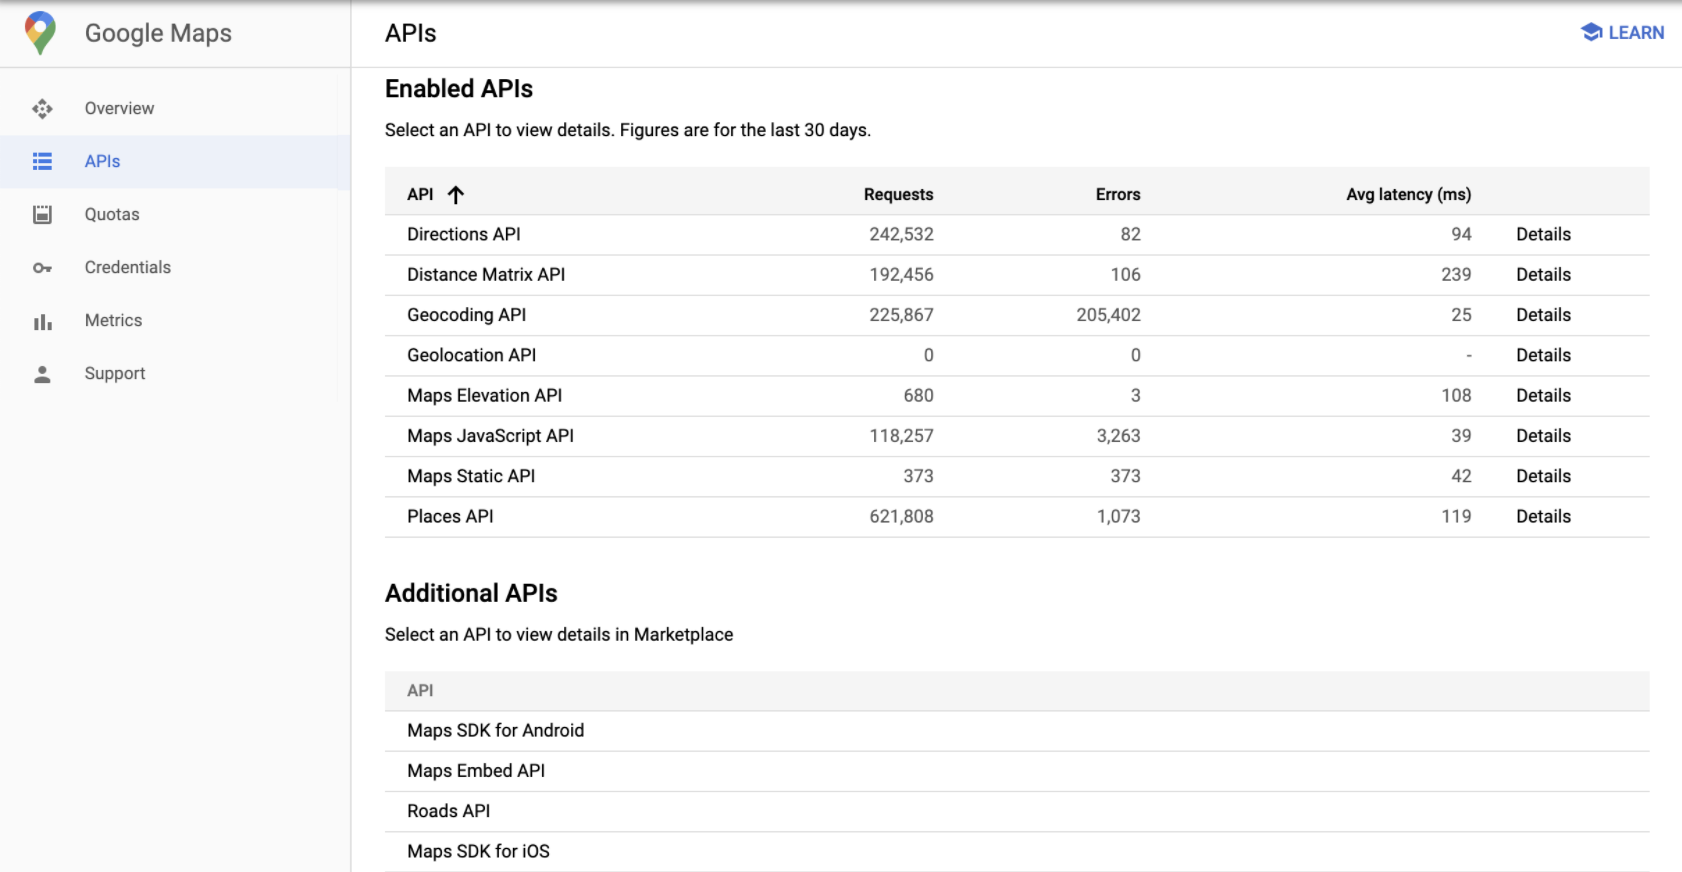
To access Google Maps Platform APIs & Services page:
- Open the Google Maps Platform page in the Cloud console:
- In the left menu, select APIs & Services.
Google Maps Metrics page
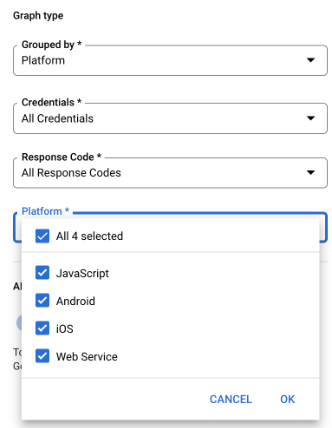
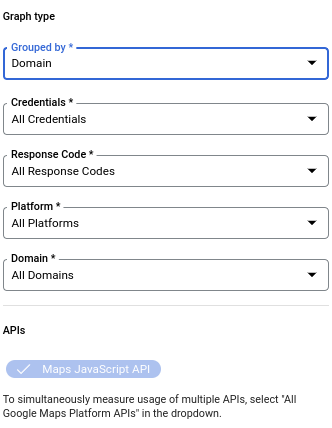
The Google Maps Metrics page displays three graphs: Traffic, Errors, and Median Latency. The usage data in the graphs can be grouped by Response Code class, API, API method, Credential, Platform, and Domain.
Beneath the graphs, the Metrics page includes an APIs table that shows requests, errors, and latency for the APIs you have selected.
Using the API drop-down at the top, and the grouping and filtering options in the right pane, you can group and filter displayed usage metrics by selecting specific or multiple APIs, Credentials, Response Code classes, Platform type and Domain. You can also select a time period (from one hour up to the last 30 days) and granularity (per second or day) for the displayed usage metrics.
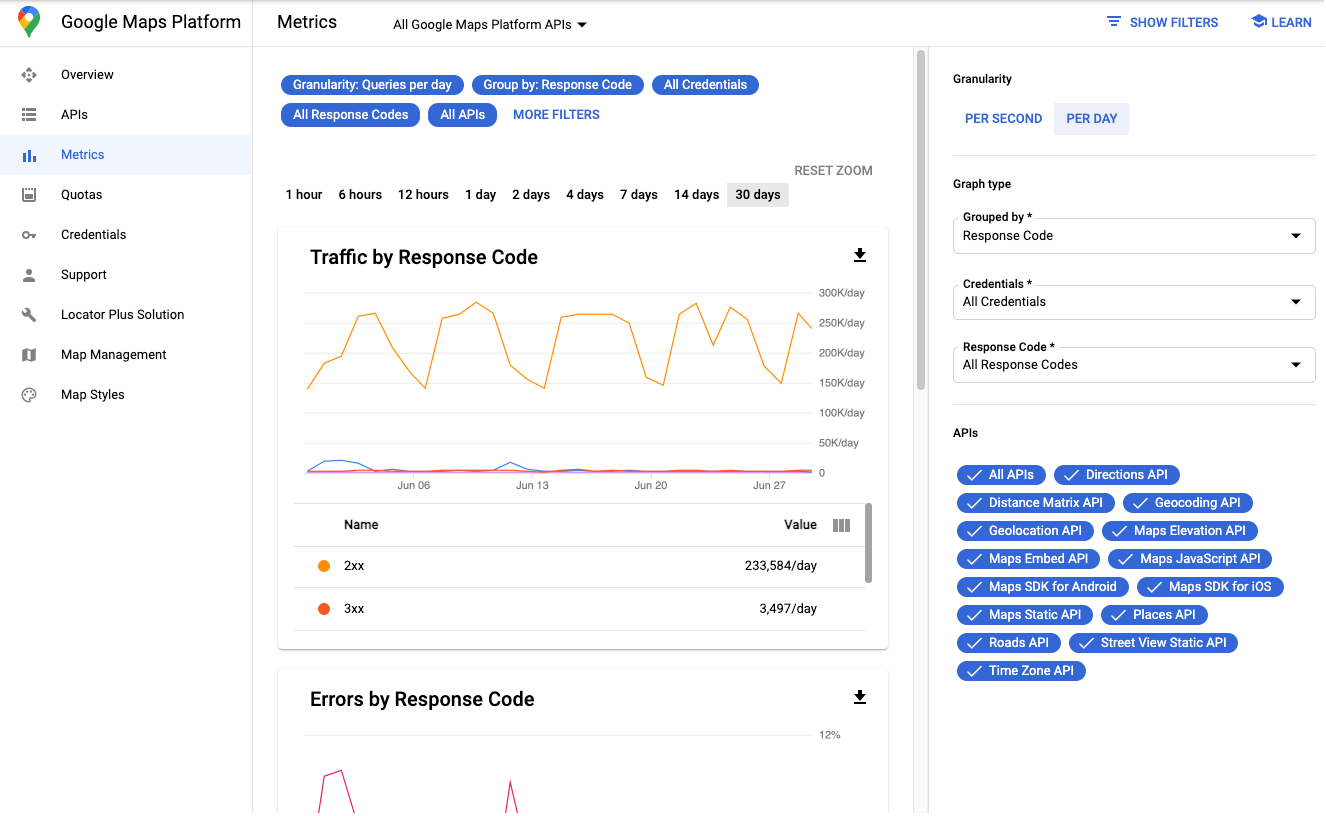
The following images show Platform and Domain filters for a specific API when grouping by Platform and Domain is selected in the Grouped by drop-down list:
To access Google Maps Platform API Metrics page:
- Open the Google Maps Platform page in the Cloud console:
- In the left menu, select Metrics.
Credential reporting
You can filter and group metrics by the credential that was used to load the API.
| Credential format | Meaning |
|---|---|
| Key name For example, "Mobile app key" |
An API key was used to load the API using
?key=...: You can find the key names on the Maps Platform
Console under Keys & Credentials. |
| Project Number For example, "project_number:123456", where 123456 is your project number. |
There are two possibilities if you see this credential:
|
Response code graphs
The Traffic by response code and Error by response code graphs split usage by HTTP response code class. This table shows the mapping between the Google Maps Platform API response status and HTTP response code class:
| Maps API status | HTTP response code class - Usage report (2xx, 3xx, 4xx, 5xx) |
Notes |
|---|---|---|
| OK | 2xx | Successful response. This is a billable request and will consume quota. |
| OK | 3xx | Successful response. This is a billable request and will consume quota. For example, the Place Photo successful requests return 302 redirect to the referenced image. |
| DATA_NOT_AVAILABLE | 4xx(1) | Successful response indicating that there's no available data for the
input locations. This is a billable request and will consume quota. |
| ZERO_RESULTS | 4xx(1) | Successful response returned no result. This is a billable request and will consume quota. |
| NOT_FOUND | 4xx(1) | For the Directions API (Legacy), this message indicates that at least one of the locations specified in the request's origin, destination, or waypoints couldn't be geocoded. For the Places API this message indicates that the referenced location (place_id) was not found in the Places database. This is a billable request and will consume quota. |
| INVALID_REQUEST (invalid parameter value), MAX_WAYPOINTS_EXCEEDED, MAX_ROUTE_LENGTH_EXCEEDED, and others. |
4xx | Error caused by invalid parameter value. Check the API
response for more details. This is a billable request and will consume quota. |
| REQUEST_DENIED | 4xx | Client error caused by authentication error, access error, and others. Check the API response for more details. |
| OVER_DAILY_LIMIT, OVER_QUERY_LIMIT, RESOURCE_EXHAUSTED, rateLimitExceeded, dailyLimitExceeded, userRateLimitExceeded |
4xx | Client error caused by too many requests per allowed time period. Retry the request at a later time. Check the API response for more details. |
| INVALID_REQUEST (invalid or missing parameter, request parsing or validation error) | 4xx | Client error caused by invalid request. Check the API response for more details. |
| NOT_FOUND (404) | 4xx | For the
Directions API (Legacy), this message indicates that at least one of the locations specified in the request's origin, destination, or waypoints couldn't be geocoded. For the Geolocation API, this message indicates that the inputs weren't sufficient to produce a location estimate. For the Roads API, this message indicates that the inputs couldn't be reasonably snapped to roads. This is a billable request and will consume quota. |
| UNKNOWN_ERROR | 5xx | Server error indicating that request cannot be proceeded: internal error, service overloaded, not available, time out, and others. |
1
To improve the consistency of error code reporting, Google Maps Platform
APIs are migrating:
1) from HTTP response code class 2xx to 4xx for
Maps API statuses: DATA_NOT_AVAILABLE, NOT_FOUND,
ZERO_RESULTS - status,
2) from HTTP response code class 2xx to 4xx for
Maps API statuses: REQUEST_DENIED, OVER_DAILY_LIMIT,
OVER_QUERY_LIMIT, dailyLimitExceeded,
rateLimitExceeded, userRateLimitExceeded,
3) from HTTP response code class 2xx to 5xx for
Maps API status: UNKNOWN_ERROR.
You can see both response codes during the transition
period. Response codes returned in Maps API responses are not changing.
Confirm that an increase in 4xx and/or 5xx in
Google Maps Platform Metrics
is related to this migration by checking which exact response code increases in
the Metrics Explorer
(learn more on using
Google Cloud Monitoring for Google Maps Platform).
For more information about status codes and error messages, see the response documentation for the API you are interested in (for example, Geocoding Responses or Directions Responses).
Google Maps Platform usage attribution parameter
Google Maps Platform provides many types of sample code to help you get up and running quickly. For example, you can use Quick Builder in Cloud console, follow the industry solutions implementation guides, and learn from codelabs.
To understand usage and ways to improve our solutions, Google includes the internal_usage_attribution_ids parameter in API calls to gather information about sample code usage:
- The
internal_usage_attribution_idsparameter may be included by default in solution sample code. - The parameter returns analytics on solution adoption to Google to improve solution quality in future iterations.
- You can opt out by deleting the
internal_usage_attribution_idsparameter and its value from sample code. - There is no requirement to keep the parameter. Removing the parameter does not affect performance.
- The parameter is only used for sample code usage reporting.
- The parameter is separate from any API-specific analytics and reporting. That means removing the parameter from solution sample code does not disable internal Maps JavaScript API reporting.
Quota reports
Quotas set limits on the number of requests your project can make to the Google Maps Platform APIs. Requests can be limited in three ways: per day, per minute, and per user per minute. Only successful requests and requests that cause server errors count against quota. Requests that fail authentication don't count against quota.
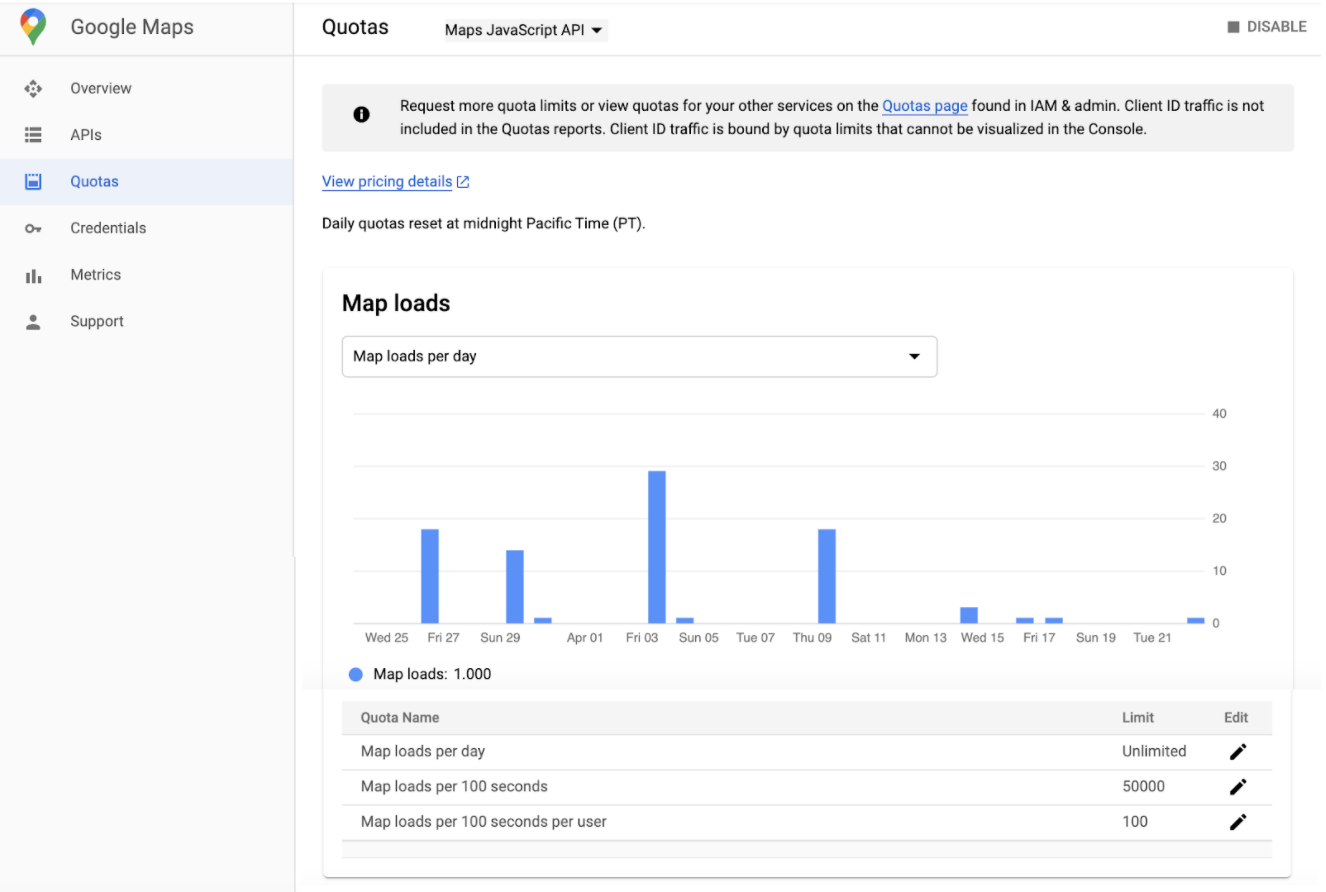
Quota usage is displayed in graphs on the Quotas page in the Cloud console, and can be grouped in requests per minute. The current quota limits for selected APIs are displayed in tables below the quota usage graphs.
To get your per-minute quota value for any GMP API product, use this calculator.
Google Maps Quotas page
The Google Maps Quotas page shows quota limits and quota consumption for the specific API you have selected.
The quota usage chart on the Google Cloud console shows the total traffic for your API keys and client IDs. Client ID traffic is also available in the Metrics chart on the Cloud console.
The page shows only requests that consume quota: successful requests (OK,
ZERO_RESULTS, DATA_NOT_AVAILABLE) and requests that cause server errors
(NOT_FOUND, INVALID_REQUEST/INVALID_VALUE (invalid parameter value), and
UNKNOWN_ERROR).
Requests that cause client errors — authentication, authorization, and
invalid argument errors (REQUEST_DENIED, OVER_QUERY_LIMIT, INVALID_REQUEST
(invalid parameter, request parsing error)) — don't consume quota and are
not displayed.
The quota unit is a request for most of the Google Maps Platform APIs ( Maps Static API, Street View Static API, Geocoding API, Directions API (Legacy), Places API, Time Zone API, Geolocation API, and Elevation API), but there are some exceptions:
- For the Distance Matrix API (Legacy), the quota unit is an element which is an origin-destination pair.
- For the Maps JavaScript API, the quota unit is a map load.
- For the Maps SDK for Android and Maps SDK for iOS, the quota unit is a Street View request or Panorama load. Map loads are available at no charge and don't consume quota.
To access Google Maps Platform Quotas page:
- Open the Google Maps Platform page in the Cloud console:
- In the left menu, select Quotas.
- Select an API from the API drop-down list.
Quota units
This table shows the quota unit for the Google Maps Platform APIs.
| Google Maps Platform API | Quota Unit |
|---|---|
| Maps | |
| Maps SDK for Android | 1 Panorama |
| Maps SDK for iOS | 1 Panorama |
| Map Tiles API | 1 Request |
| Maps Aerial View API | 1 Request |
| Maps Static API | 1 Request |
| Maps JavaScript API | 1 Map Load |
| Street View Static API | 1 Request |
| Maps Embed API | 1 Map Load |
| Routes | |
| Routes API (Compute Routes) | 1 Request |
| Routes API (Compute Route Matrix) | 1 Element (origin-destination pair) |
| Directions API (Legacy) | 1 Request |
| Distance Matrix API (Legacy) | 1 Element (origin-destination pair) |
| Roads API | 1 Request |
| Route Optimization API | 1 Request |
| Navigation SDK for Android | 1 Destination |
| Navigation SDK for iOS | 1 Destination |
| Places | |
| Places API | 1 Request |
| Places Aggregate API | 1 Request |
| Address Validation API | 1 Request |
| Geocoding API | 1 Request |
| Geolocation API | 1 Request |
| Time Zone API | 1 Request |
| Maps Grounding Lite | 1 Request |
| Environment | |
| Air Quality API (CurrentConditions and HeatmapTile) | 1 Request |
| Air Quality API (History) | 1 page |
| Pollen API | 1 Request |
| Solar API | 1 Request |
| Weather API | 1 Request |
Billing reports
View your billing report
Billing reports for your use of the Google Maps Platform products are available in the Google Cloud console. For more information, see Billing.
To access the billing reports:
- Open the Project selector page in the Cloud console:
- Select a project.
- Select the menu button
and then select Billing.
- If you have multiple billing accounts, select Go to linked billing account to open the Overview page for the linked billing account.
- In the left menu, select Reports to open the billing Reports page for the linked billing account.
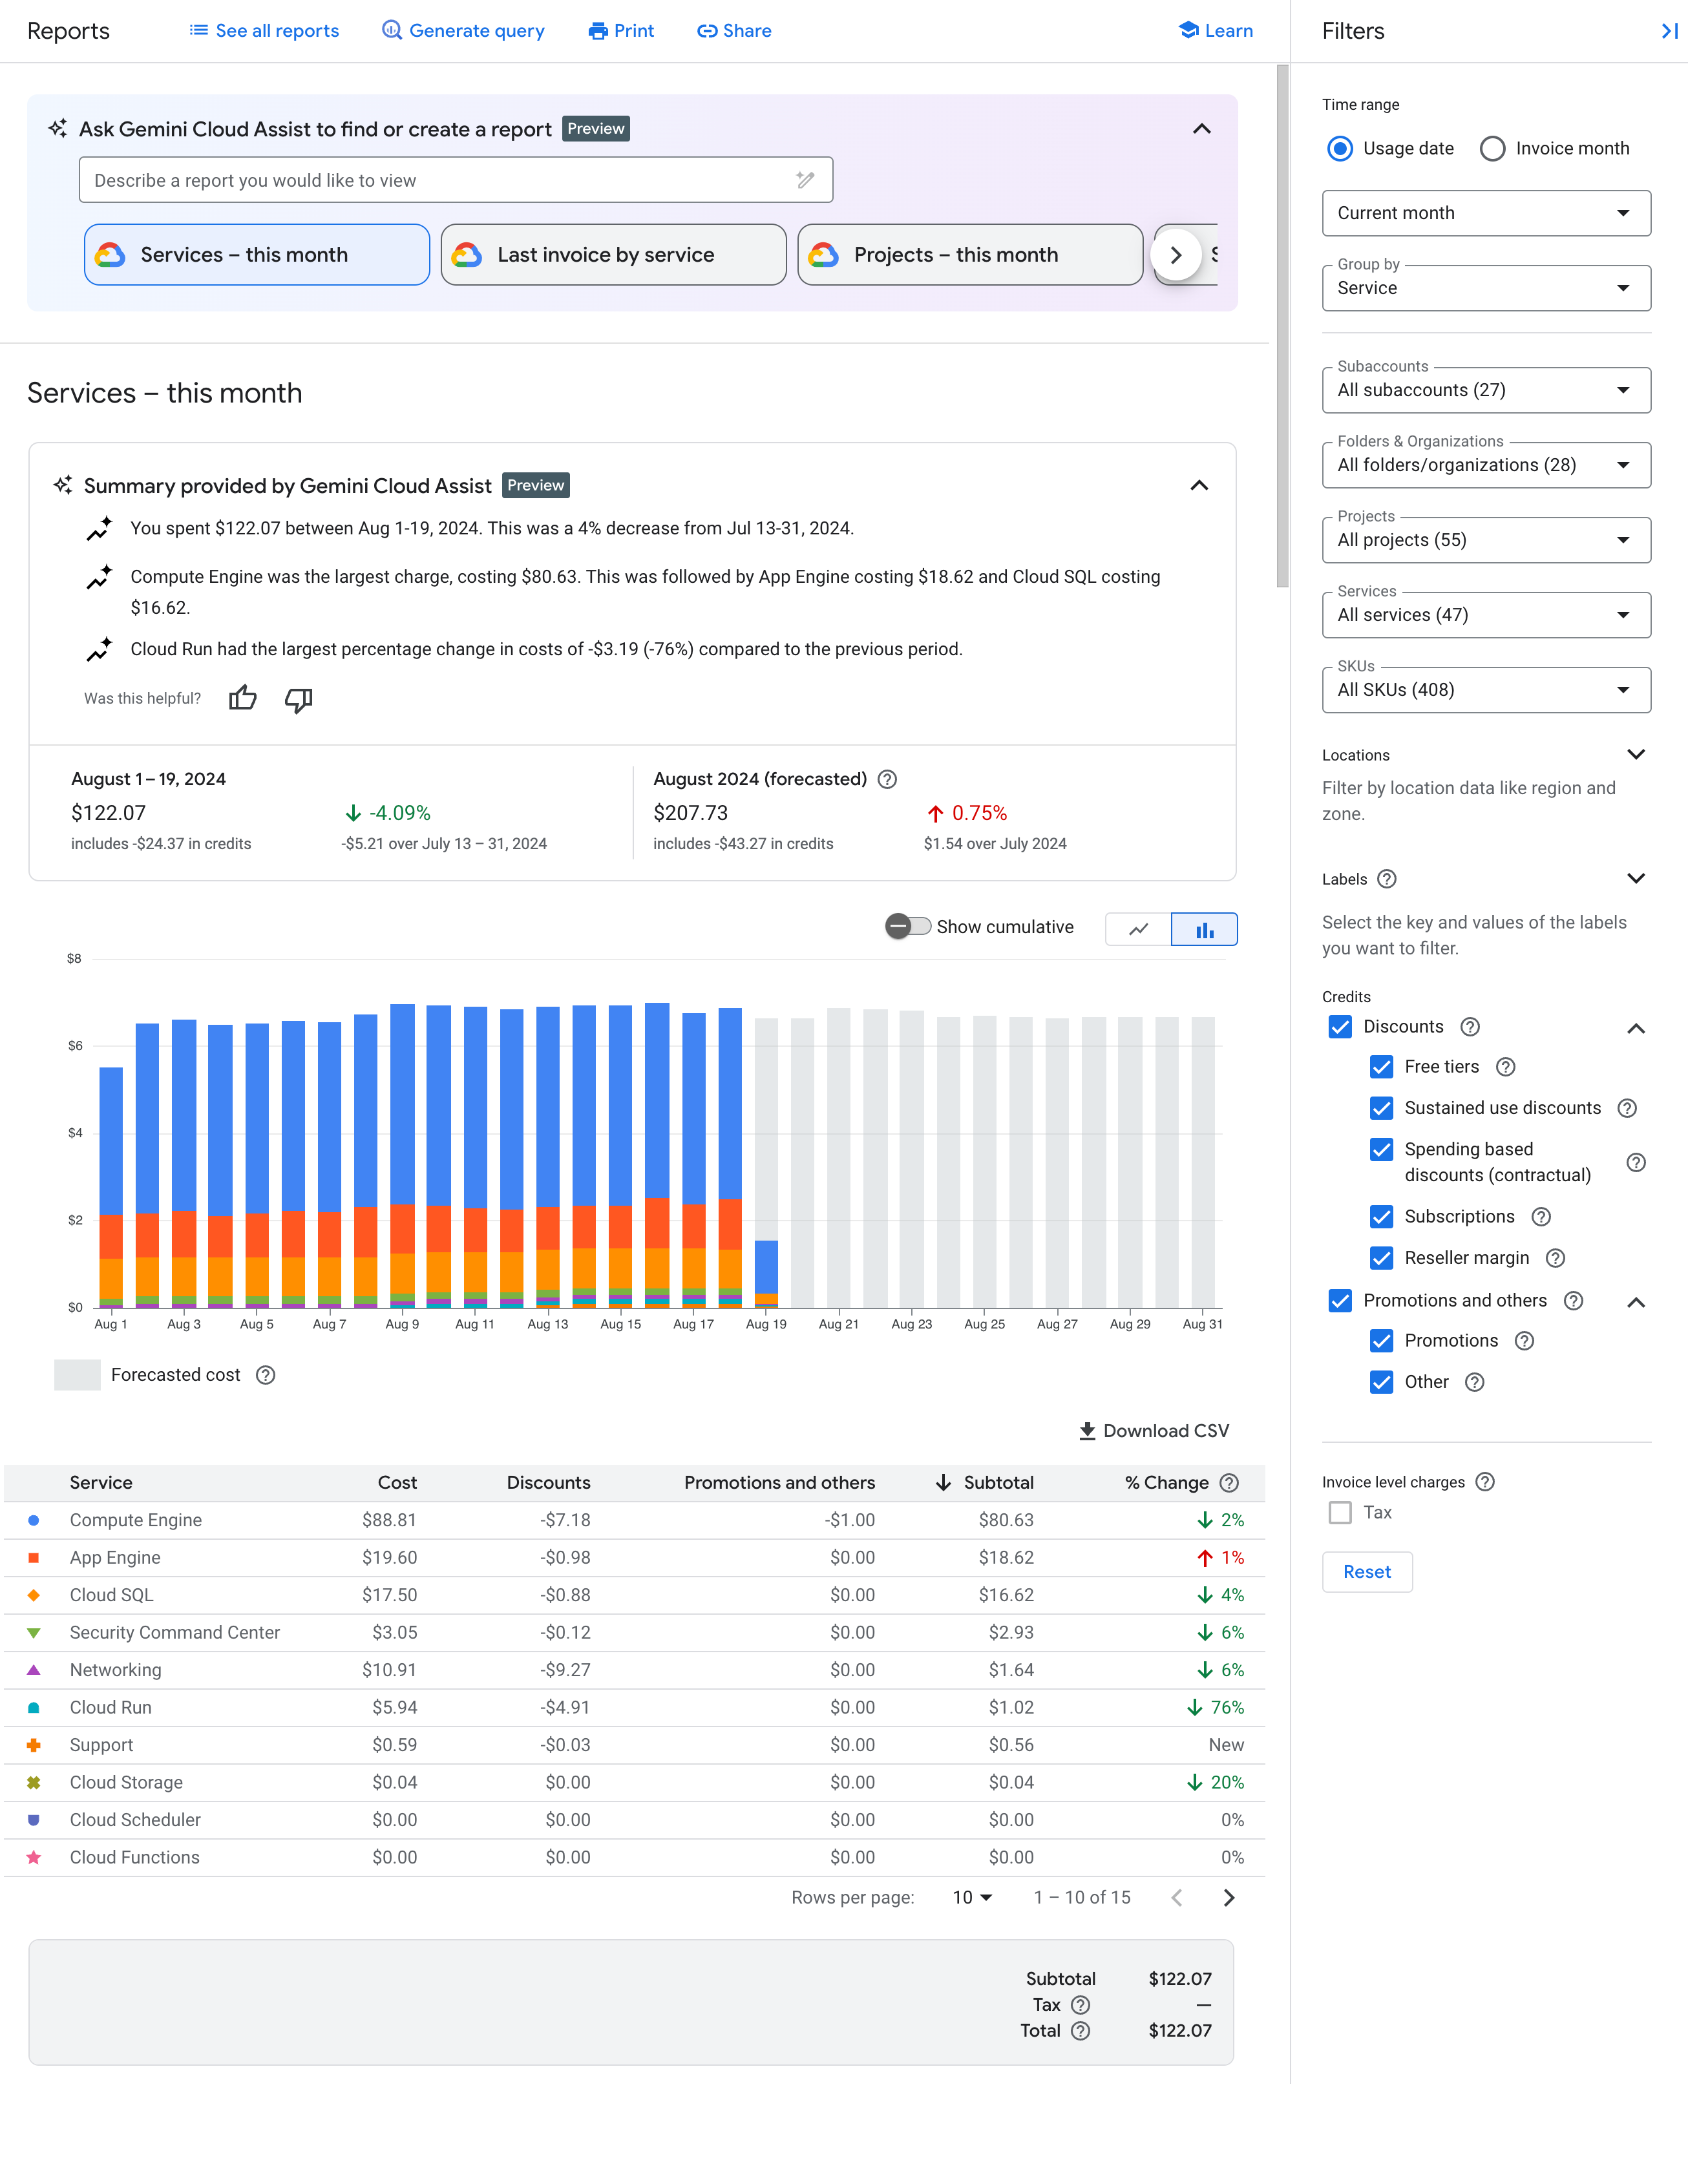
How to read the billing report chart
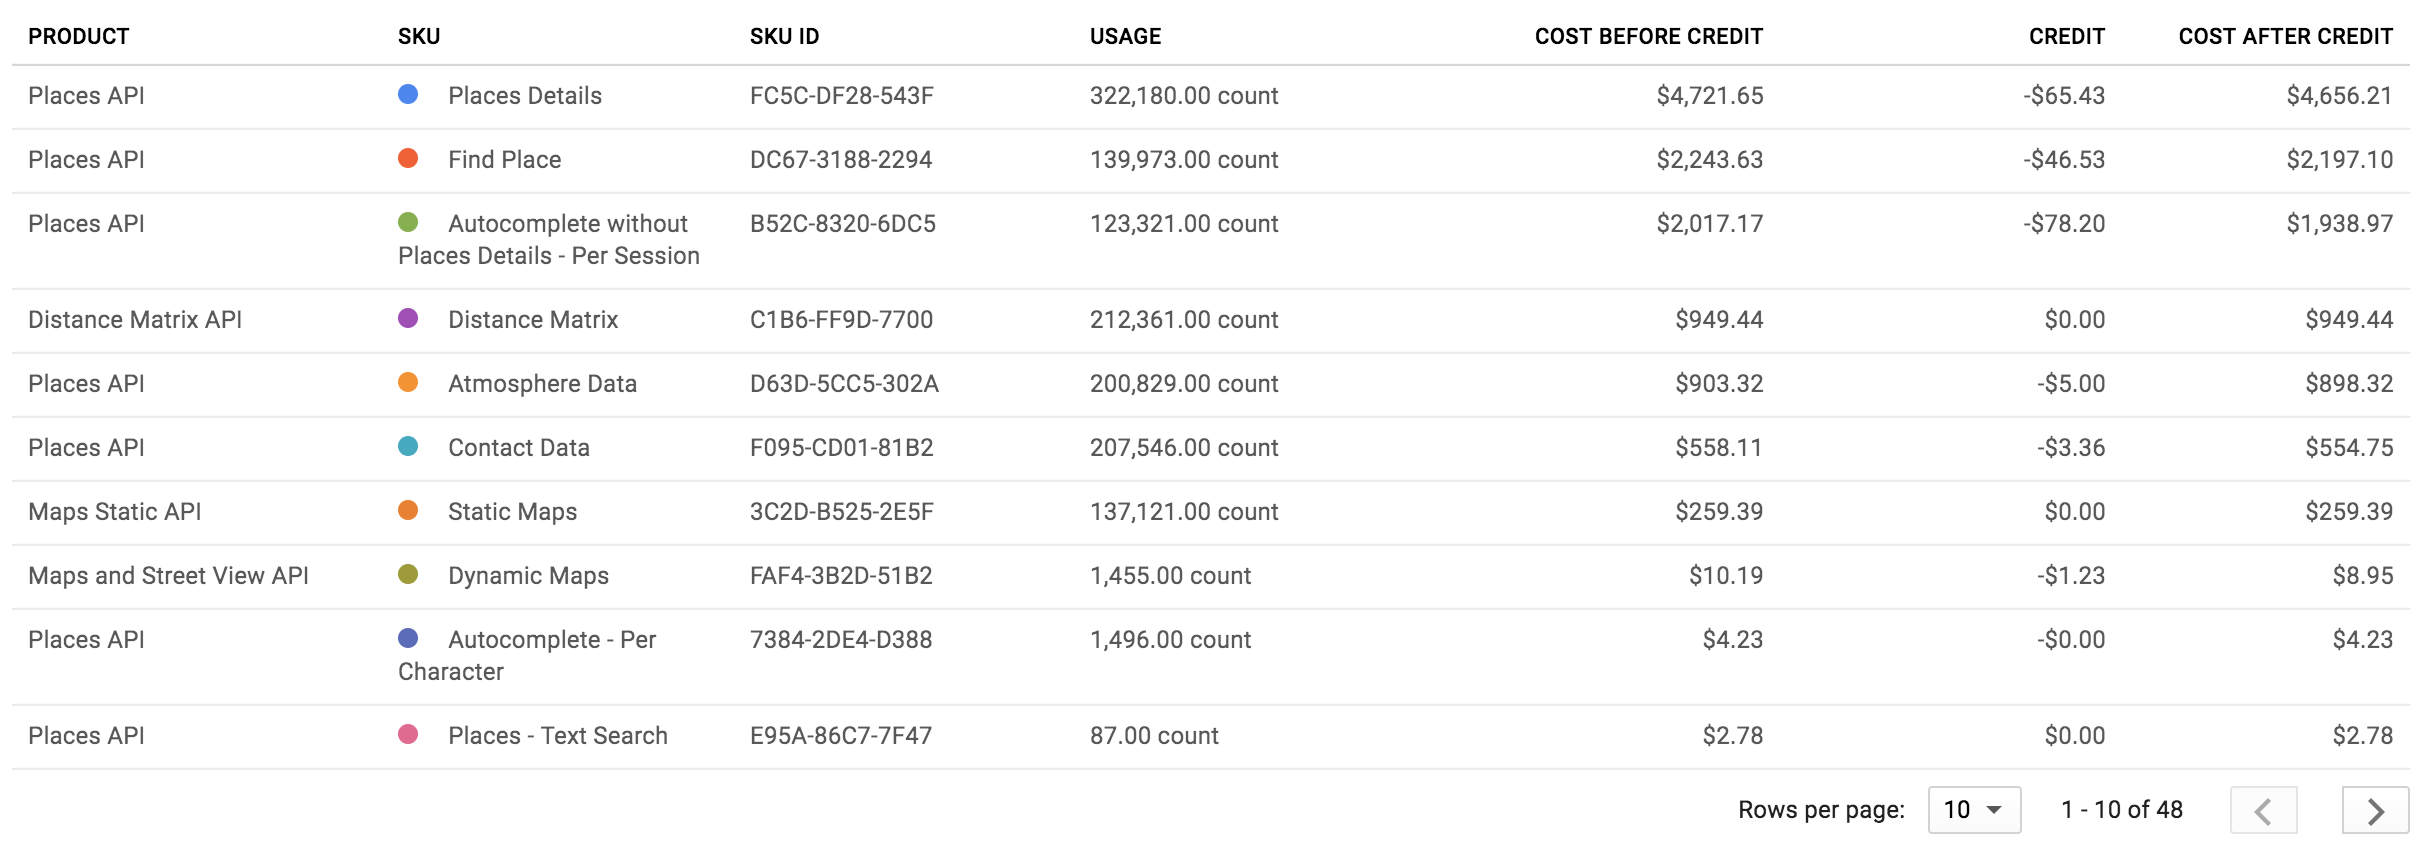
Billing reports plot cost over time as a stacked line chart. The default view displays the current month's daily usage-specific costs grouped by project (for all products), inclusive of any usage-specific credits applied, as well as the total forecasted cost for the entire current month. Each line in the chart (and row in the summary table) corresponds to the project, ranked largest to smallest by cost. Learn more about interpreting the billing report chart.
Tip: Analyze the usage and cost per SKU
To more accurately understand the details of the pay-as-you-go pricing model and how it impacts your implementation, look at your usage and cost by SKU.
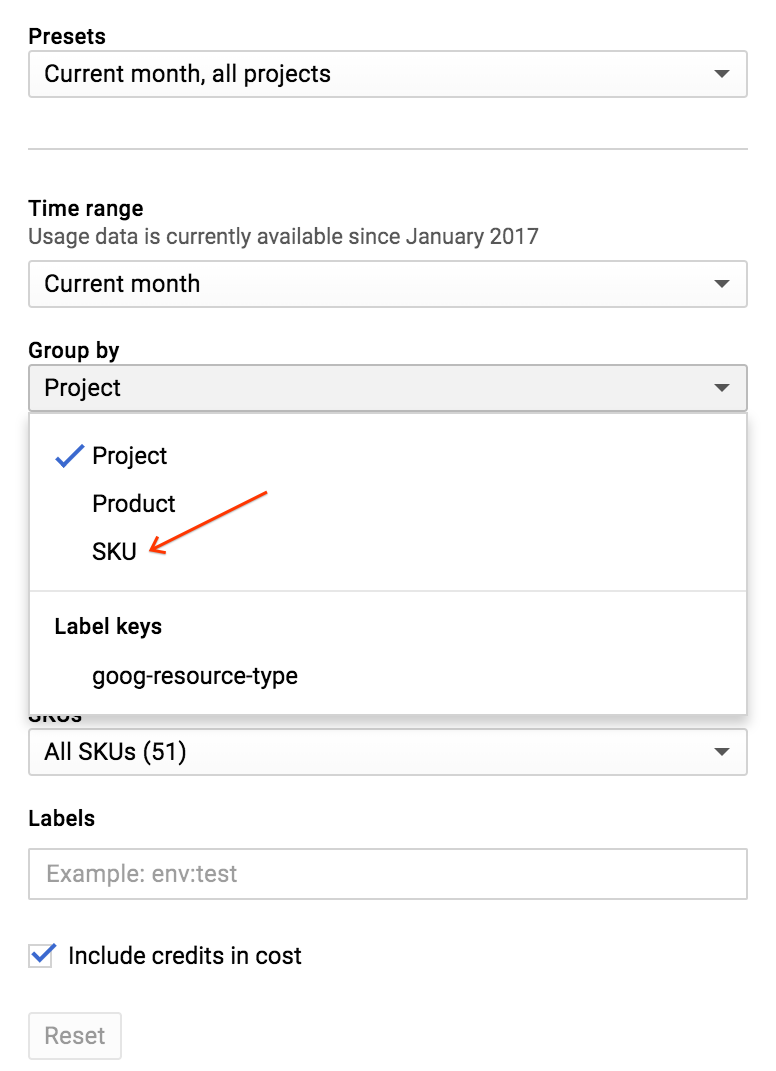
To change the report view to display line items by SKU:
- In the panel to the right of the chart, expand the Group by filter.
- Select SKU.
Other billing-report filters available include Time range, Projects, Products, SKUs, and Locations which lets you filter by where the API requests are served from.
To categorize the source of your usage in addition to the product, group billing reports by one of the listed values. The three keys that relate to Google Maps Platform APIs are goog-maps-api-key-suffix (the final four characters of an API key), goog-maps-platform-type (the platform: Android, iOS, JavaScript or webservice), and goog-maps-channel (a set numeric channel value from an API query). More information on filtering and grouping.
You can change the chart view to exclude usage-specific credits by clearing the Include credits in cost checkbox in the right panel.
Monitor and restrict consumption
To help you to plan your budget and control costs, you can do the following:
-
alert, to track how your spend is growing toward a particular amount. A budget does not cap API usage, it only alerts you when your spend amount gets near the specified amount.
-
usage, to manage your cost of use of billable APIs. By setting caps on requests per day, you can limit your spend. Use an equation to determine your daily cap depending on how much you want to spend. For example: (Monthly spend / price per each SKU) / 30 = requests per day cap (for one API).
Usage tracking per channel
To track your usage using numeric channels, you must add the 'channel' parameter to your API requests. The only acceptable channel values are numbers from 0-999. Here are a few examples:
- Geocoding Web Service API
https://maps.googleapis.com/maps/api/geocode/json?address=1600+Amphitheatre+Parkway,+Mountain+View,+CA&key=YOUR_API_KEY&channel=1
- Maps JavaScript API
<script src="https://maps.googleapis.com/maps/api/js?key=YOUR_API_KEY&channel=2&callback=initMap"
async defer></script>
Monitor your channel usage directly on your Billing Report. Channel usage is under Labels as key goog-maps-channel.
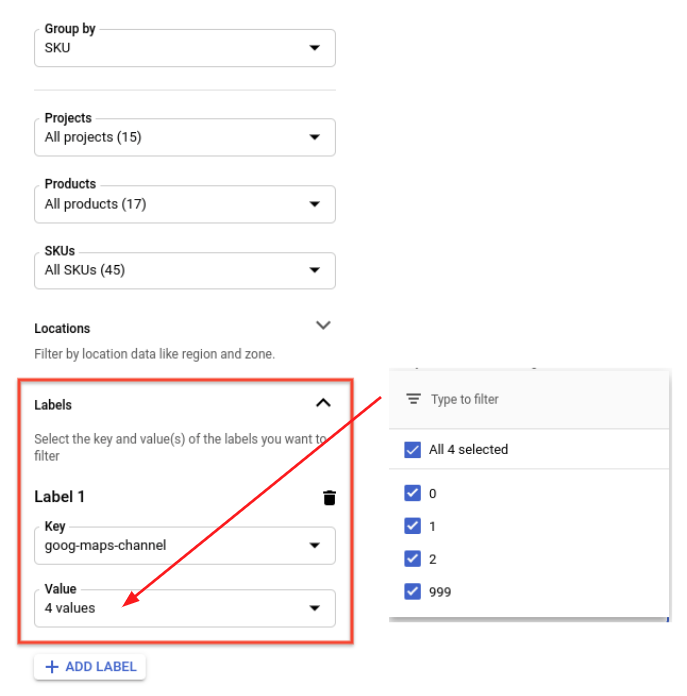
To filter your billing report by SKU and channel
- Use the Group by SKU filter.
- Select the Labels caret.
- From the Key drop-down, select goog-maps-channel.
- From the Value drop-down, select the numerical channels you want to filter.
Group by Label key goog-maps-channel to see the cost generated by each channel.
Once you have implemented channel usage data in your requests, there may be a short delay (up to 24 hours) before the data is reflected in your billing report.
Export your billing data with BigQuery
You can also export your billing data to BigQuery.
Use BigQuery Export to export detailed Cloud Billing data (such as usage and cost estimate data) automatically throughout the day to a BigQuery dataset that you specify. Then you can access your billing data from BigQuery for detailed analysis. This gives an extra layer of granularity in understanding the source of your Google Maps Platform usage.
If you'd like to get started with BigQuery exports and querying the data, you can try the sample query below. Prior to running this query, you must:
- Enable billing and BigQuery billing export on your account.
- The table format is PROJECT_ID.DATASET_NAME.gcp_billing_exportv1BILLING_ACCOUNT_ID where:
- PROJECT_ID is your actual project ID (e.g. "my-project-123456").
- DATASET_NAME is the name of the dataset you created (e.g. "SampleDataSet").
- BILLING_ACCOUNT_ID is a reference of your Billing Account ID,
prefixed with "gcp_billing_exportv1", and changing dashes (-) to underscores (_).
For example, billing account ID 123456-7890AB-CDEF01 would become
gcp_billing_export_v1_123456_789AB_CDEF01.
  #standardSQL
  SELECT   Date(usage_start_time, "America/Los_Angeles") AS billing_day,
           invoice.month                                 AS invoice_month,
           service.description                           AS service,
           sku.description                               AS sku,
           (
                  SELECT l.value
                  FROM   Unnest(labels) AS l
                  WHERE  l.KEY = 'goog-maps-channel' ) AS goog_maps_channel,
           Round(Sum(usage.amount), 2)                 AS usage_amount,
           usage.unit                                  AS usage_unit,
           Round(Sum(cost), 2)                         AS cost,
           cost_type,
           currency
  FROM     PROJECT_ID.DATASET_NAME.gcp_billing_export_v1_BILLING_ACCOUNT_ID
  WHERE    invoice.month = '202002' -- Change the invoice month with the same format as the example.
  GROUP BY billing_day,
           invoice_month,
           service,
           sku,
           goog_maps_channel,
           usage_unit,
           cost_type,
           currency
  ORDER BY billing_day,
           service,
           sku
Related resources
Cloud Billing:
- Create, modify, or close your Cloud Billing account
- Modify a project's billing settings
- View Your Billing Reports and Cost Trends
- Set budgets and budget alerts
- Capping API Usage
Response status and reports
The table below shows mapping between the Maps API status, HTTP response code returned in Maps API responses and HTTP response code class in Usage Report, and indicates if the corresponding request appears in the Usage, Quota, and Billing reports.
The Usage Report in Google Maps Platform Metrics
provide HTTP response code class granularity. If you need a higher level of
granularity see Response status codes
available in Google Maps Platform Usage monitoring.
| Response codes available in Maps API responses | Available in Usage Report | Reported to | |||
|---|---|---|---|---|---|
| Maps API status | HTTP response code | HTTP response code class | Usage | Quota | Billing |
| OK | 200, 204, 302 |
2xx, 3xx |
Yes | Yes | Yes |
| DATA_NOT_AVAILABLE, NOT_FOUND, ZERO_RESULTS |
200, 404 |
4xx1 | Yes | Yes | Yes |
| INVALID_REQUEST (invalid parameter value), MAX_ROUTE_LENGTH_EXCEEDED, MAX_WAYPOINTS_EXCEEDED, etc. |
200, 400 |
4xx | Yes | Yes | Yes |
| INVALID_REQUEST (invalid/missing parameter, request parsing error) | 200, 400 |
4xx | Yes | No | No |
| REQUEST_DENIED | 200, 400, 403 |
4xx1 | Yes | No | No |
| OVER_DAILY_LIMIT, OVER_QUERY_LIMIT, RESOURCE_EXHAUSTED, dailyLimitExceeded, rateLimitExceeded, userRateLimitExceeded |
200, 403, 429 |
4xx1 | Yes | No | No |
| UNKNOWN_ERROR | 200, 500, 503 |
5xx1 | Yes | Yes | No |
1
To improve the consistency of error code reporting, Google Maps Platform
APIs are migrating:
1) from HTTP response code class 2xx to 4xx for
Maps API statuses: DATA_NOT_AVAILABLE, NOT_FOUND,
ZERO_RESULTS - status,
2) from HTTP response code class 2xx to 4xx for
Maps API statuses: REQUEST_DENIED, OVER_DAILY_LIMIT,
OVER_QUERY_LIMIT, dailyLimitExceeded,
rateLimitExceeded, userRateLimitExceeded,
3) from HTTP response code class 2xx to 5xx for
Maps API status: UNKNOWN_ERROR.
You can see both response codes during the transition
period. Response codes returned in Maps API responses are not changing.
Confirm that an increase in 4xx and/or 5xx in
Google Maps Platform Metrics
is related to this migration by checking which exact response code increases in
the Metrics Explorer
(learn more on using
Google Cloud Monitoring for Google Maps Platform).
|
|||||